- IELTS Scores
- Life Skills Test
- Find a Test Centre
- Alternatives to IELTS
- Find Student Housing
- General Training
- Academic Word List
- Topic Vocabulary
- Collocation
- Phrasal Verbs
- Writing eBooks
- Reading eBook
- All eBooks & Courses
- Task 1 Lessons & Tips
- Describing a Graph

How to Describe an IELTS Academic Writing Task 1 Graph
On the following pages there are lessons to teach you how to write an academic IELTS writing task 1 but in this first lesson you’ll get an overview of how to answer a task 1.
You can also view a video of this lesson:

Once you have studied the general structure, you can view other examples by looking at the model graphs that are on this site.
Alternatively, follow on with these lessons to a variety of strategies and tips to achieve the writing score you need.
Steps to Respond to a Task 1
To analyse this, we’ll look at a line graph. Look at the following question and the graph.
You should spend about 20 minutes on this task.
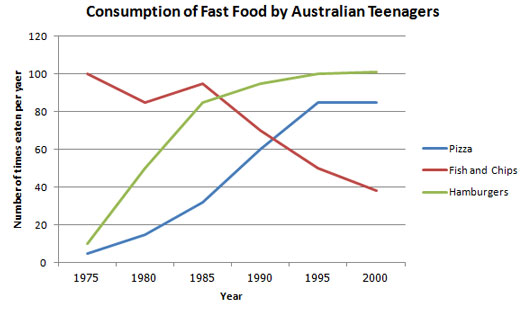
The line graph below shows changes in the amount and type of fast food consumed by Australian teenagers from 1975 to 2000.
Summarize the information by selecting and reporting the main features and make comparisons where relevant.
Write at least 150 words.
There are three basic things you need to structure an IELTS writing task 1.
- Introduce the graph
- Give an overview
- Give the detail
We’ll look at each of these in turn.
Introduce the Graph
You need to begin with one or two sentences that state what the IELTS writing task 1 shows. To do this, paraphrase the title of the graph, making sure you put in a time frame if there is one.
Here is an example for the above line graph:
The line graph compares the fast food consumption of teenagers in Australia between 1975 and 2000, a period of 25 years.
You can see this says the same thing as the title, but in a different way.
Give an Overview
You also need to state what the main trend or trends in the graph are. Don’t give detail such as data here – you are just looking for something that describes what is happening overall.
One thing that stands out in this graph is that one type of fast food fell over the period, whilst the other two increased, so this would be a good overview.
Here is an example:
Overall, the consumption of fish and chips declined over the period, whereas the amount of pizza and hamburgers that were eaten increased.
This covers the main changes that took place over the whole period.
You may sometimes see this overview as a conclusion. It does not matter if you put it in the conclusion or the introduction when you do an IELTS writing task 1, but you should provide an overview in one of these places.
Give the Detail
You can now give more specific detail in the body paragraphs.
When you give the detail in your body paragraphs in your IELTS writing task 1, you must make reference to the data.
The key to organizing your body paragraphs for an IELTS writing task 1 is to group data together where there are patterns . To do this you need to identify any similarities and differences .
Look at the graph – what things are similar and what things are different? As we have already identified in the overview, the consumption of fish and chips declined over the period, whereas the amount of pizza and hamburgers that were eaten increased.
So it is clear that pizza and hamburgers were following a similar pattern, but fish and chips were different. On this basis, you can use these as your ‘groups’, and focus one paragraph on fish and chip and the other one on pizza and hamburgers.
Here is an example of the first paragraph:
In 1975, the most popular fast food with Australian teenagers was fish and chips, being eaten 100 times a year. This was far higher than Pizza and hamburgers, which were consumed approximately 5 times a year. However, apart from a brief rise again from 1980 to 1985, the consumption of fish and chips gradually declined over the 25 year timescale to finish at just under 40.
As you can see, the focus is on fish and chips. This does not mean you should not mention the other two foods, as you should still make comparisons of the data as the questions asks.
The second body then focuses on the other foods:
In sharp contrast to this, teenagers ate the other two fast foods at much higher levels. Pizza consumption increased gradually until it overtook the consumption of fish and chips in 1990. It then levelled off from 1995 to 2000. The biggest rise was seen in hamburgers as the occasions they were eaten increased sharply throughout the 1970’s and 1980’s, exceeding that of fish and chips in 1985. It finished at the same level that fish and chips began, with consumption at 100 times a year.
Full Model Answer:

The line graph compares the fast food consumption of teenagers in Australia between 1975 and 2000, a period of 25 years. Overall, the consumption of fish and chips declined over the period, whereas the amount of pizza and hamburgers that were eaten increased.
(194 words)
Now you've been through this first introductory lesson, you can go to the next lesson or start viewing some model answers.
More Task 1 Academic Lessons:
IELTS Task 1 Line Graph Structure Using Groups
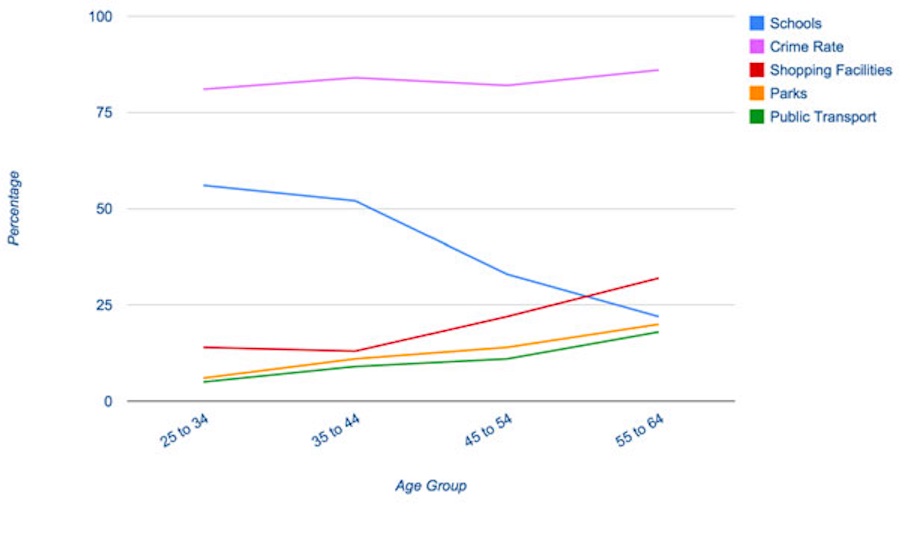
For an IELTS Task 1 Line Graph there are different ways to organise your answer. Grouping information is a good way to get a logically structured response.
Writing Tips for a Graph in the Future in IELTS Academic
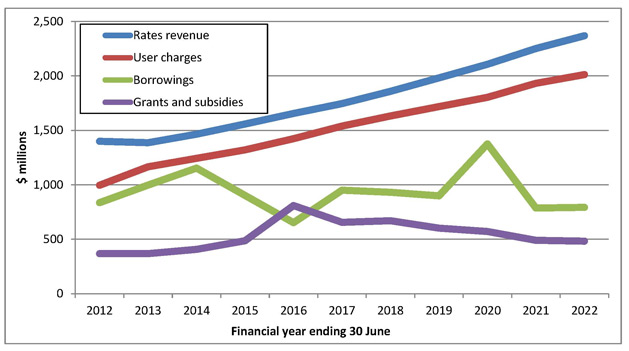
Graph in the future: Sometimes graphs in IELTS refer to a future time. You must know the language to write about these. In this lesson, learn how to write about an IELTS graph in the future. Getting the tenses right is an important part of the IELTS writing task 1.
IELTS Process Diagram Strategies and Tips
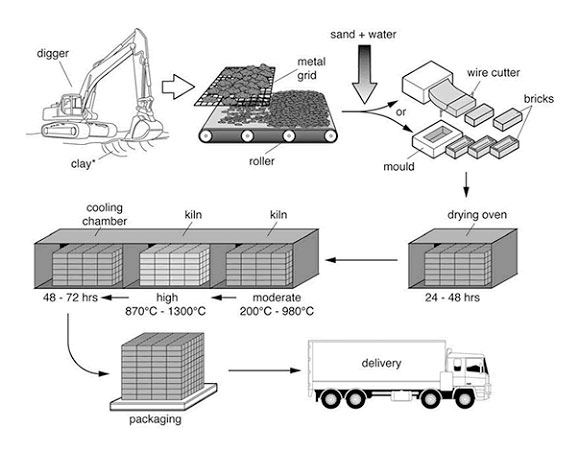
IELTS Process Diagram: In task 1 of IELTS writing you usually have to describe some kind of graph or chart. But sometimes you get a process. It is therefore crucial that you know how to do this. This easy to follow lesson explains how.
Which Tenses for IELTS are the Most Important?
Candidates often ask which tenses for IELTS are needed in order to do well in the exam. This lesson goes through the grammar tenses and how they apply to the test.
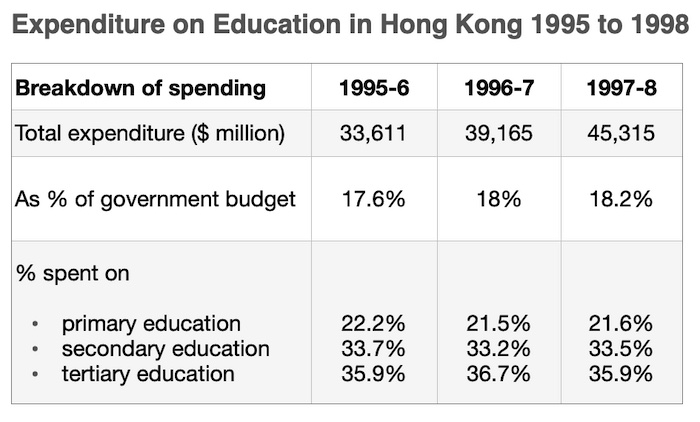
Describing Graph Trends Using the Language of Change
Describing graph trends: In IELTS you must know how to describe the trends that you see in the graph you are given. This lesson provides practice with some common language used to describe trends.
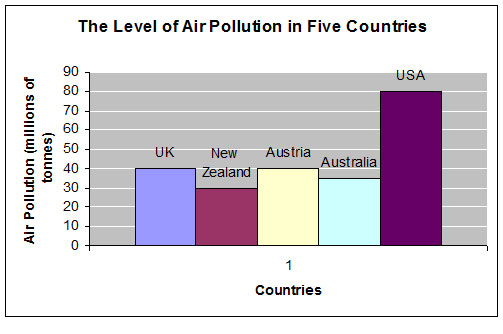
Learn Compare and Contrast Language for IELTS Graphs
Compare and Contrast Language: In the academic IELTS task 1, you have to know the right language if you want to get a band 7 or higher. Practice your IELTS language for bar charts in this task 1 writing lesson.
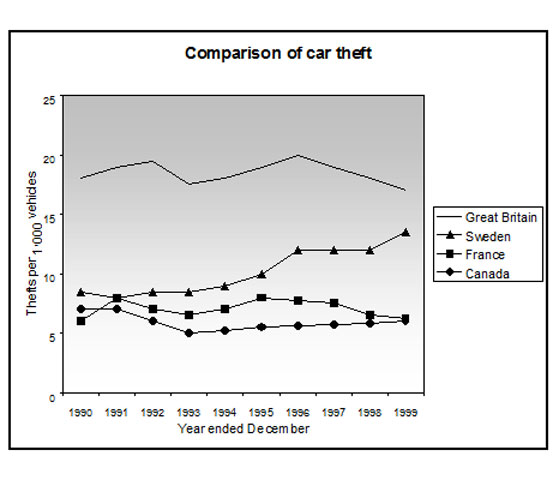
Prepositions in Graphs Quiz: Between; from; to; at; of; in; with; by
Prepositions in Graphs: Practice using prepositions in the IELTS test. View a model answer and practice using a gap fill.
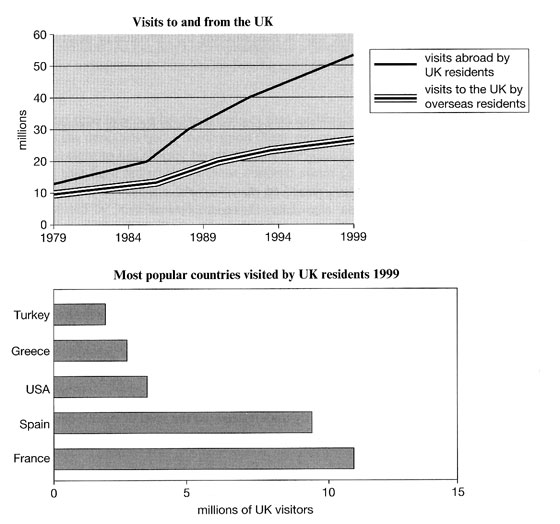
IELTS Bar and Line Graph: How to describe two graphs together
This Bar and Line Graph example shows you how you can write about two charts together in the IELTS test for task 1, with strategies and techniques.

Describing IELTS Graphs: Tips to avoid a common mistake
IELTS Graphs: A common mistake In IELTS graphs is to get the subject of the graph wrong. This lesson explains how this mistake is made and show you what you need to do to avoid it. There is a also a practice exercise.
IELTS Table: Tips and techniques for a high score.
IELTS Table advice for a high score. Learn how to describe an IELTS table, which is just another way to present data.

Take an IELTS Quiz to test your IELTS knowledge
IELTS Quizzes to test and train you on the writing task and task 2 of the IELTS test. Gap fills and multiple choice.
Tips for Organising an IELTS Line Graph
Organising an IELTS Line Graph - This lesson shows you have to improve the coherency of your graph in order to achieve a high band score.
Describing an IELTS task 1 graph over time
This lesson shows you how to write an IELTS task 1 graph or chart that is over time.
IELTS Pie Chart Strategies and Tips for a Band 7, 8 or 9
This IELTS pie chart lesson provides you with tips and advice on how to describe an IELTS Pie Chart in order to get a Band 7, 8 or 9.
Any comments or questions about this page or about IELTS? Post them here. Your email will not be published or shared.
Before you go...
Check out the ielts buddy band 7+ ebooks & courses.
Would you prefer to share this page with others by linking to it?
- Click on the HTML link code below.
- Copy and paste it, adding a note of your own, into your blog, a Web page, forums, a blog comment, your Facebook account, or anywhere that someone would find this page valuable.
Band 7+ eBooks
"I think these eBooks are FANTASTIC!!! I know that's not academic language, but it's the truth!"
Linda, from Italy, Scored Band 7.5

IELTS Modules:
Other resources:.
- All Lessons
- Band Score Calculator
- Writing Feedback
- Speaking Feedback
- Teacher Resources
- Free Downloads
- Recent Essay Exam Questions
- Books for IELTS Prep
- Student Housing
- Useful Links

Recent Articles
Decreasing House Sizes Essay
Apr 06, 24 10:22 AM

Latest IELTS Writing Topics - Recent Exam Questions
Apr 04, 24 02:36 AM

IELTS Essay: English as a Global Language
Apr 03, 24 03:49 PM
Important pages
IELTS Writing IELTS Speaking IELTS Listening IELTS Reading All Lessons Vocabulary Academic Task 1 Academic Task 2 Practice Tests
Connect with us
Copyright © 2022- IELTSbuddy All Rights Reserved
IELTS is a registered trademark of University of Cambridge, the British Council, and IDP Education Australia. This site and its owners are not affiliated, approved or endorsed by the University of Cambridge ESOL, the British Council, and IDP Education Australia.
Useful Vocabulary for Writing an IELTS Graph Essay

When it comes to IELTS writing task 1, 25% of your marks are for the range of words you use. That means IELTS graph vocabulary is a very important component to review as you prepare for the Writing Task 1. You can start by checking out this IELTS writing task 1 vocabulary guide . And below, I’ll provide an overview of words and useful phrases to incorporate into your writing so that you can get top marks on the lexical resource category and a high band score overall. Basically, the better your IELTS writing chart vocabulary, the higher score you’ll get. It’s not hard, but there is a clear formula to doing well.
How to Use IELTS Graph Vocabulary in Writing Task 1
Because IELTS writing task 1 involves describing a graph or chart of some type, it will help to have a handle on IELTS writing chart vocabulary — words and phrases that help you write about the information on the chart or graph.
How are graphs described in IELTS? Let’s walk through the best vocabulary for the task, step by step.
1. Start With Introduction Phrases
Often ESL students start their essay with ‘The graph shows…’. While this is fine, the verb ‘shows’ could be replaced by a more exciting and high-level vocabulary word. Here are four different prompts to start your essay:

- The graph illustrates the trends in…
- The graph reveals information about the changes in…
- The graph provides the differences between…
- The graph presents how X has changed over a period of…
- DO NOT write the word below or above in your introduction. i.e. The graph above/below shows…
2. Add Suitable Adverbs
Adverbs help express a relation of place, time, circumstance, manner, cause, and degree, and can greatly add some color and interest to your writing as well as show off your range of vocabulary. Unlike adjectives (which describe nouns), adverbs describe verbs, or actions. Here’s a great list of adverbs to use:
3. Use Appropriate Synonyms
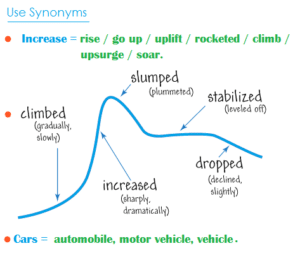
Again using a variety of nouns and verbs for words like rise and fall will help increase your overall score. Here are some suggestions:
4. Add Time Phrases
Below are some excellent time phrases with sentence examples:
Using IELTS Graph Vocabulary in a Model Essay
Look at the sample IELTS writing Task 1 graphs on the British Council website . Below is my model answer with useful words in bold:
The bar charts illustrate the trends in computer ownership, with a further classification by level of education, from 2002 to 2010.
Over the period, it can be observed that there was a significant surge in the percentage of the population that owned a computer. In the year 2002, only about 58% of the population owned a computer, whereas by 2010 , this gradually increased to where over three-quarters of individuals had a home computer.
Looking at the information by level of education reveals that higher levels of education correspond to higher levels of computer ownership in both of those years. In 2002, a significantly low percentage of the population who did not finish high school had a computer, but this figure skyrocketed by 2010, going from 15% to over 40%. There were also dramatic climbs , of approximately 30 percentage points, for those with a high school diploma or an unfinished college education (reaching 65% and 85%, respectively, in 2010).
To conclude, during the last decade, there has been a substantial growth in computer ownership across all educational levels.
Other IELTS Graph Vocabulary Resources
Keep in mind that IELTS writing task 1 may contain one of several different types of infographic: a bar chart, pie chart, line graph, diagram, etc. Regardless of the type, you’ll want to have a good handle on IELTS writing chart vocabulary.
For more specific guides to the different kinds of graphs, charts, and graphics you may find on IELTS writing task 1, check out the following resources:
- How to Describe a Bar Chart
- How to Describe a Pie Chart
- How to Describe a Map
- How to Describe a Process Diagram
You can also check out Magoosh’s IELTS linking words PDF for transitions between ideas. Hopefully you’ll start to incorporate some of these key words and phrases, as well as the above suggestions, in your IELTS Task 1 Writing. If you still don’t feel comfortable doing so, consider dedicating more time to your IELTS studies with Magoosh’s fun, engaging IELTS prep for extra practice.

Eliot Friesen-Meyers is the Senior Curriculum Manager for Magoosh IELTS and TOEFL. He attended Goshen College (B.A.), New York University (M.A.), and Harvard University (M.T.S.), gaining experience and skills in curriculum development, ESOL instruction, online teaching and learning, and IELTS and TOEFL test prep education. Eliot’s teaching career started with Literacy Americorps in Pittsburgh, Pennsylvania, and later, taught ESL programs at Northeastern University, University of California-Irvine, and Harold Washington College. Eliot was also a speaker at the 2019 TESOL International Conference . With over 10 years of experience, he understands the challenges students face and loves helping them overcome those challenges. Come join Eliot on Youtube , Facebook , and Instagram . Recent blog posts Complete Guide to IELTS Writing Task 1 Complete Guide to IELTS Writing Task 2
View all posts
More from Magoosh

11 responses to “Useful Vocabulary for Writing an IELTS Graph Essay”
I would like to get sample of all types of graph eassy
IELTS Liz offers a pretty good range of graphs and charts for IELTS Writing Task 1 (Academic) . You can also get a nice selection of these on the official IELTS websites . And last but not least, Magoosh offers a good selection of these types of questions with a Magoosh IELTS Premium subscription. 🙂
Thank you Magoosh for the comprehensive guide. I’m a subscriber to you GMAT course and is now checking out IELTS.
Wanna ask, I read and watched many other sources that says we should not write a conclusion. However, yours did.
So, is it permissible or not permissible?
The concluding sentence is optional–if you have time to write a concluding sentence after writing and reviewing your essay, then it looks good to have a concluding sentence. If you don’t have time to write a concluding essay or you’d rather focus on other parts of your essay, then it’s totally fine to leave it out. You can read more about this in our Complete Guide to IELTS Academic Writing Task 1.
“Growth” is not an noun? Because in the board it’s saying that it is a verb
Thanks for pointing this out! It seems like a mistake on our part. We should probably change that to “grow”. I’ll make a note for our writing team to make this change 🙂
I appreciate you very much. Your blog on Useful Words for Writing an IELTS Graph Essay was the outstanding blog ever. You have given so much good information about the new english words & grammar in your post, which will help me in future. Always keep data like this on your website
I have two significant questions. The first one is related to the unit of measurement in over view. Is it academic? And the second one is of conclusion. Do we need to write conclusion?
Hi Aakash, I’m afraid I don’t understand your first question. Can you please provide some more information? For your second question: a conclusion is not necessary. You can add one if you’d like, but it’s more important to spend time analyzing the graph.
This is one of the best among the essay I’ve read recently.
Thanks for the feedback! 🙂
Leave a Reply Cancel reply
Your email address will not be published. Required fields are marked *

IELTS with Mark Teacher
How to write ielts task 1 academic ‘static graphs’.
There are 3 main types of diagrams in Writing Task 1 Academic: a.) Dynamic graphs b.) Static graphs <– we’re talking about this one c.) Diagrams ( Maps , Processes )
In this post I will show you how to write about static graphs.

I now check IELTS Writing Task 1 Essays! Submit you work and get 4 pages of feedback in 72 hours

Fortunately, the essay structure for every type of Task 1 is basically the same.
Structure: Task 1 – Academic 4 paragraphs 1.) Summary / Introduction 2.) Overview 3.) Body 1 4.) Body 2
What are static graphs?
Static graphs are graphs that contain data in only 1 time period.
For example:

In this graph there are 3 age groups, but no time period is mentioned. We understand that all the data comes from the same time period.

In this graph, only 1 time period is mentioned: 2019. We understand that all time data comes from 2019.

Again, there are 2 different graphs, but no time period is mentioned. These are 2 static graphs.
In contrast, this is a dynamic graph . This is because it has 2 or more time periods. In this graph the data is measured in 3 time periods: 2005, 2010 and 2015.

As a result, the main features of static graphs are not changes (like in a dynamic graph), but instead the main features are proportions and popularity .
1.) Static Graph Introduction / Summary
The introduction paragraph in Task 1 only needs to be 1 or 2 sentences. Like all IELTS Writing Task 1 essays, your introduction should present the main purpose of the graph to the reader in your own words . This means paraphrasing the official IELTS diagram description if you can.
Again, static graphs only record data in 1 time period, which affects the language we use in the introduction. This language table can help you create static introductions. Notice that there is no time period mentioned at the end.
Here are some example introductions to IELTS Task 1 Static Graphs:
The chart gives information about marriage and children in a selection of countries.

- The graph provides data about + the average age of married couples, as well as their average number of children per couple + in a variety of countries.
- The graph measures + how old couples are on average when they get married, as well as how many children they have + in a selection of different countries.
Here’s another example:

- The graph shows + the sectors of employment chosen + by graduates of Brighton University in 2019.
- The pie graph provides data about + the popularity of different job sectors + among graduates from Brighton University in 2019.
- The pie graph reveals + the various job markets entered + by Brighton graduates in 2019.
You try! – Write an introduction sentence for this static task. Use the table above to help you.

- The graph provides data about + different book formats used by + 3 different age groups.
- The graph shows + the choices of various book formats + by people aged between 16 and 29.
- The graph measures + the book type preferences + of people in 3 different age ranges.
2.) Static Graph Overview
The purpose of the overview paragraph is to give a short summary of the main features. Static graphs show data in only one time period, so the main overall features are usually proportions or popularity of different categories. These features can include the most popular , the highest amount, the most chosen or the least popular, the lowest or least preferred.
Importantly, (just like dynamic graphs) you should describe these proportions in words – do not use any specific numbers or data points from the graph.
Here are some useful phrases you can use to describe these main features in words.
Here are some example overview paragraphs using the Task 1 graphs from earlier:

Main features:
+ Highest # of children : Kenya and India | Highest marriage age: AUS-NL-UK-DN
– Youngest marriage age: Kenya and India
+/- Exceptions: USA and China
- Overall, we can see that + there are large discrepancies between certain countries in terms of marriage age and family size. A select group of countries, Australia, the Netherlands, the UK and Denmark, had the latest marriage age and a similar amount of children. Meanwhile, the nations with the youngest marriage age, namely Kenya and India, had some of the highest numbers of children per couple. China and the United States are the only notable outliers of these two trends.
- Overall, we can see that + Kenya had the largest margin between marriage age and number of children, ahead of India. However, the majority of the countries surveyed showed a similar number of children. In contrast, China and the United States were the only nations outside of this trend.

Main features:
+ Most popular sector: Service industries
– Smallest sectors: civil service, transportation, science and technology + others
+/- Similar levels: Education, politics, manufacturing – make up around 33%
- Overall, we can see that + a significant majority of graduates entered the service industry. Education, manufacturing and politics and government also made up a large portion of Bright graduates, while the remaining amount was divided between six other work sectors.
- Overall, we can see that + the service industry was the most chosen job sector among graduates. Around a third of all graduates were spread across manufacturing, education and politics and government, while the remaining third of Bright graduates entered industries ranging from civil service to transportation and warehousing.
You try! – Write an overview paragraph for this static task. Use the table above to help you. The main features have been highlighted for you.
+ most common choice: printed books in all age groups
+/- similarly small: e-books and audiobooks
The chart shows data about reading among people under 30 years old.
- Overall, we can see that + printed books were the clear favourite across all age groups. Meanwhile, e-book and audiobook formats were only about a quarter as popular , though also spread evenly in popularity among the age groups questioned.
- Overall, we can see that + the most preferred book format by far was printed books. However, while audiobooks and e-books were equally popular among the age groups, their popularity was quarter of that of printed books.

My in-depth workbook explains the best way to organise and write your IELTS Task 1 Overview Paragraphs, as well as gives you the specific vocabulary and grammar for pie graphs, bar graphs, tables and more!

3.) Body Paragraphs
Next are the Body paragraphs of your Task 1 report. You can write 2 or 3 Body paragraphs.
Body paragraphs describe the main features in detail, including specific numbers from the graph. The data and features of a body paragraph should be similar in some way.
For example, you should describe the most popular categories together in one body paragraph. Then write about the least popular categories in a new body paragraph.
I usually use my overview paragraph to guide the structure of my body paragraphs.
Here is the complete example of a Task 1 static graph essay using the images from before:
Introduction : The graph provides data about the average age of married couples, as well as their average number of children per couple in a variety of countries.
Overview : Overall, we can see that there are large discrepancies between certain countries in terms of marriage age and family size. A select group of countries, Australia, the Netherlands, the UK and Denmark, had the latest marriage age and a similar amount of children. Meanwhile, the nations with the youngest marriage age, namely Kenya and India, had some of the highest numbers of children per couple. China and the United States are the only notable outliers of these two trends.
Body 1: (marriage age together)
Beginning with the latest marriage age, 4 nations waited until after 30 years old to get married, including Australia, the Netherlands, the United Kingdom and Denmark. Danish couples had the highest average of around 33 years old. In contrast, Kenyan, Indian and Chinese couples were notably younger. The average in Kenya was 22 years old, while India’s was 24 and China’s a year older than that.
Body 2: (number of children together + Exceptions)
Kenya and India, however, both had higher numbers of children per couple. Kenyan and Indian couples had on average 3 and 2.5 children respectively. American couples averaged the same number of children per couple, although their marriage age was closer to that of the 4 highest nations, which only typically had just under 2 children. China was another outlier in this regard, listing only 1.5 children per couple. (255 words)

Introduction: The graph shows the sectors of employment chosen by graduates of Brighton University in 2019.
Overview : Overall, we can see that a significant majority of graduates entered the service industry. Education, manufacturing and politics and government also made up a large portion of Bright graduates, while the remaining amount was divided between six other work sectors.
Body 1: (Biggest proportions together)
Starting with the most chosen sector on the graph, 33.0% of Brighton graduates entered service industries, making it the largest portion of the pie graph by some margin. Meanwhile, collectively the manufacturing industry, education sector and politics and government made up around a third of the graph. Manufacturing received 16.3%, education 14.7% and politics and government posted 12.1%. In total these 4 employment sectors account for almost three quarters of the whole graph.
Body 2: (Smaller portions together)
In regards to the less popular industries, 7.8% of graduates entered the transportation and warehousing sector while 7.3% entered science and technology fields. Civil service is the only remaining comparable sector, with 5.6%. The other sectors received small fractions of total graduates, with “Other” accounting for 2.8%, charity 0.3% and sport just 0.1%. (203 words)
You try! – Write the body paragraphs for this static task. Use the examples above to help you.
Introduction: The graph provides data about different book formats used by 3 different age groups.
Overview: Overall, we can see that printed books were the clear favourite across all age groups. Meanwhile, e-book and audiobook formats were only about a quarter as popular, though also spread evenly in popularity among the age groups questioned.
Body 1: (most popular category)
Starting with the most overwhelmingly popular choice of book format on the graph, printed books were chosen between 70% and 85% of readers in all age groups surveyed. 16-17 year-olds claimed they read printed books, while roughly 73% of 18-24 year-olds and 25-29 year-olds also chose printed books.
Body 2: (least popular together)
There you go! A high-band approach, several examples and a reliable framework for you to use in your own IELTS Writing test.
Questions? Write them in a comments below.

Want more IELTS Writing Task 1 help?
I’ve uploaded 28 more pages of high-band grammar, vocabulary and essay writing advice in my Static Graph workbook. If you want more practice and to see the structures behind high-band IELTS essays and sentences, click the image or click here to see more .
Show me what you’ve learnt from this guide – send me your IELTS Writing Task 1 Essays!

Share this:
- Click to share on Twitter (Opens in new window)
- Click to share on Facebook (Opens in new window)
Related Posts

IELTS Writing Task 1 Essay Sample – Static – News Sources
Learn how to write high-band IELTS Task 1 essays like this with my IELTS Task 1 – Static Graph eBook: Click here or the picture below! Want me…

IELTS Writing Task 1 Essay Sample – Static – Tea & Coffee Habits

IELTS Writing Task 1 Essay Sample – Static – Library Use

IELTS Writing Task 1 Essay Sample – Process – Geothermal Electricity
The diagram below shows how geothermal energy is used to produce electricity. Want me to check your IELTS Task 1 essays? You can send me your own IELTS…

IELTS Writing Task 1 Essay Sample – Map – Norbiton Industrial Area
If you want to learn how to write IELTS Task 1 essays like this one, you can get Advanced eBook here: Or …. you can send me your…

IELTS Writing Task 1 – Maps e-Book – Out now!
I’m excited to announce another addition to my growing IELTS Writing Task 1 eBook series! The latest downloadable PDF is all about Maps! 19 pages of grammar and…
- Skip to main content
IELTS Podcast
Pass IELTS with expert help.
How to score high on a bar graph question in writing task 1
The bar graph task 1 essay accounts for a third of your marks in the writing test so we recommend spending around 20 minutes on it, as this is a third of your time. There are a couple of different structures you can follow when describing an IELTS bar chart .
A strategy for bar graph questions
Essay structure, or how you organise your answer, is very important in academic writing. Today we will teach you a new method – a structure where you assign each sentence of your text to a topic – kind of the opposite of what you usually do when writing task 2 . It may look a little confusing, but this method really works! Just follow our lead for IELTS task 1.
Remember that bar chart and bar graph are synonyms and you can use the phrases interchangeably. Although each bar graph will be different, you are not required to be an expert on the information it shows, just to summarise the information, identify trends and make comparisons. Each bar graph IELTS question is different, so look at as many bar graph examples as you can and practice this strategy until you feel really confident.
How to choose information from the bar graph?
Assuming one sentence contains around 10 to 15 words, we can estimate that your description of the bar chart will consist of about 10 to 12 sentences. Now we can assign each sentence a specific task:
- One sentence for the introduction.
- Two sentences using superlatives.
- A sentence with a comparison. Make comparisons where relevant.
- A sentence grouping two data points to show similarity (for example, you might include a brief description showing a gradual decrease in two different areas).
- A sentence noting an exception to an overall trend.
- A sentence describing some data in an advanced manner, using complex sentence structure.
- A sentence describing relevant data using a simple structure.
- Two sentences for summary and conclusion.
Note that this method is quite flexible and these sentences don’t necessarily need to go in this particular order. You must write them in a way that makes your bar chart description flow naturally. Think about which sentences go together in each body paragraph as well as the introduction paragraph and conclusion. You may also have to repeat a few sentences using different data if you find your graphic contains more information or find a way to mention different groups in one sentence. The structure above is a rough guide to get you started. Once you have looked at the example and are comfortable with this structure, you can use this example as a model to describe different bar charts and answer as many bar graph questions as you can. Just remember to get feedback while you are testing your ideas otherwise, it’s quite difficult to improve.
A bar graph sample question and answer
Now that we have figured out what we want to write about in the description of the bar graph, it’s time to put our data selection skills to use and make comparisons where relevant. It is easy to get lost in all of the information provided by a bar chart as there can be so much data. That’s why it’s important to keep in mind what you are looking for when you are analyzing the chart.
The task achievement score for task 1 makes it clear that you need to answer all parts of the question – in other words, describe the main features AND compare them, in order to get a good score. Task achievement is 25% of your total marks so don’t forget to make comparisons! The first thing you should do is identify key features. Once you have decided on the main points, make note of any secondary features that will support the main features.
Ready for a high-level bar chart task 1 answer? Let’s begin with the analysis of this bar chart, and pick out the information that is relevant to our structure. See the model answer of a bar chart below.
Sample Answer Bar Graph Essay
The bar chart shows the caloric intake of UK males in three distinct age groups of 0-24, 25-49, and over 50 years old. The data is shown as percentages. Dairy for the 0-24 age group was the highest source of calories, whilst the other categories each represented about 20% each. In the next age group dairy fell to around a quarter, and meat became the main source of calories, reaching half of the total intake. Pulses and vegetables reached 10% and 15% respectively. Pulses in the final age group increased sixfold to over 60%, whereas calories obtained from vegetables was 10%, half that of meat (20%), and even slightly less than dairy (15%). The 50+ group shows the most marked preference out of all the groups. It also confirms the gradual decline in vegetable consumption as males become older. Overall it is clear that each age group has a clear favourite which varies depending on age. However, vegetables are consistently amongst the least popular, regardless of age.
Sample Answer Analysis
In this essay, the introduction paragraph restates the writing prompt. It is not the overview paragraph, which can be either the first or the last paragraph. In this case, the overview appears at the end in which the writer states the overall trends of the bar graph. While the horizontal axis contains information relating to the question keywords, it’s important not to overlook the vertical axis and state clearly how the data is given (for example, is it as percentages, in kilos, or tonnes, or hours?) Make sure you have included this information in the first part of the essay.
You will also notice that the body paragraphs consist of a breakdown of the main features in order of age group to show and compare the difference in amounts of each food category consumed as people grew older, placing the final age group into its own body paragraph. This is because the data showed that there was a fairly significant upward trend in one food type (pulses) that the writer wanted to highlight. And finally, as previously mentioned, the conclusion part of this essay includes the overview, which should consist of a sentence or two about general trends.
Some notes on structure
Notice how the sentence is structured. How many complex sentences can you identify? When preparing for your IELTS academic writing task, you will want to show some sophisticated writing. When you sit for your IELTS writing test, you might feel pressured for time and it may be a bit difficult to think of complex sentence structures while considering the main features. Take note on the following important tips on structure:
- Make sure you have mentioned all the categories in your answer – in this example, there are four categories.
- Make sure you have also included the correct values when you summarise the data, in this case, percentages.
- It is often tempting to write too much for a task 1 essay but by following the method shown you will stay focused. Concentrate on the most important information.
- Compare the highest and lowest values, for example, rather than all the differences.
- Write what comes naturally at first, even if you write in correct simple sentences.
- Allow yourself some time at the end to go back and adjust some of your structures to complex sentences.
- If you are aiming for a high score on the IELTS test, you should aim for structures that are complex and accurate.
- It is important to be sure of the tense you are using. This example requires the present tense but many bar charts illustrate data from the past. In that case, you need to write the introduction in the present tense (the bar chart illustrates…) and then switch to writing mostly in the past tense (the number of people choosing this option dropped after the first year).
Click here for more free IELTS bar chart sample essays . You can also find sample IELTS task 1 questions here .
Tips on describing a bar graph in IELTS
- Avoid listing every single data point; instead, use your own words to describe the key information from the chart/graph.
- Avoid mixing formats: for example, don’t mix decimals with estimations in the same sentence.
- Check whether there is a date on the bar chart – you may need to use the past tense.
- Make note of general trends, particularly upward or downward trends that can be highlighted in your own words.
- After you have successfully written out your description with all of the information you want to include, go over it and replace some simpler words with more academic vocabulary – this will help you achieve a high score . For example, try replacing “big” with “most significant”.
- Check that your text is error-free. Review carefully to see if all your sentences are grammatically correct.
- Make sure that the data you have described is correct – that you have not made a mistake with a category or labels.
- Review for the correct use of connectors and linking words .
- Practise with different bar graphs/pie charts to improve especially with a range of values (percentages, kilos, miles, dollars).
- Review the superlatives – highest, lowest, most expensive, biggest difference – these are essential if you want to effectively describe bar charts.
- The fastest way to improve is to get feedback on your work. You can also check another model bar graph answer for comparison.
- Don’t forget to check your word count. Make sure your piece is another too brief nor too wordy and detailed. Most model answers come in at around 200 words. You’ll use a similar writing model for pie charts and tables so you don’t need to memorise completely different models for each.
Bonus tips to score high on IELTS Bar Graph Questions
- To improve your task 1 bar graph skills try copying out a sample bar graph with pen and paper. You will start to understand how to locate key points and choose the most relevant information. It doesn’t matter what the topic is, remember it could be anything from the gross domestic product of different countries to comparing the highest expenditure on housing. You don’t need to be an expert on gross domestic product or the Japanese rental market, you just describe the data and make comparisons.
- Practice describing a bar chart out loud. It will help you remember vocabulary to describe data under pressure, decide point by point what to include in your answer and make sure you have mentioned every category at least once. Your confidence will improve when it comes to your next IELTS writing task.
- Make sure you practice ‘two type’ questions – you might see an IELTS question with one bar chart or two so it is a good idea to look at a model answer for each type. You might see one bar chart and a table, or other types of graphs such as line graphs. Some questions might have a mix, for example, one or more pie charts and a bar chart. However the data is displayed, it’s important to stay calm and focus on finding the major differences and similarities, compare categories and identify trends. Describing a table or line graph is very similar to describing bar charts and the more you practice the more confident you will feel.
Check out one of our free lessons here by clicking on the following link !
Video: How to describe a bar graph
Click here to subscribe to the Youtube channel.
Frequently Asked Questions (FAQs)
How to describe bar graph in ielts task 1.
Divide the information into two or three groups, focus on trends and exceptions to help you. You don’t need to describe everything. Think of synonyms for key words and most important numbers – for example, 52% is just over half.
How to write task 1 bar graph?
Follow a model, the 4 paragraph diagram model is easiest. That’s rephrasing the question, one main trend, another main trend and an overview. Overall have 10 sentences with specific tasks as we explain in this article.
How do you write a description of a bar graph?
Remember that the important thing is to describe the main features AND make comparisons. Use superlatives and the phrase ‘which means that…’ to help you. For example, Portugal’s spending was between 20 and 27% which means that it had the highest spending of all 4 countries studied.
Audio tutorial: How to describe a bar chart for the IELTS exam
| Download | Stitcher | iTunes | Android | RSS
Podcast: Play in new window
Sample Bar Chart Questions and Model Answers
Take a look at these bar chart model answers to help you prepare
- Bar chart of international student enrolment in British universities 2009-2014
- Bar chart of average monthly revenue from retail telecommunication subscribers
- Bar chart of increase in total consumption
- Bar chart of life expectancy (2006)
- Bar chart of percentage of eligible voters registered for each race by state and year
- Bar chart of average weekly attacks
- Bar chart of pet Owners
- IELTS Task 1 Sample Answer 2 Double Graph Pie Chart and Bar Chart
Podcast: Play in new window | Download
A summary of a line graph

Learn how to describe a line graph.
Do the preparation task first. Then read the text and tips and do the exercises.
Preparation
Matching_MjMxNjU=
The graph below shows how people buy music. Summarise the information by selecting and reporting the main features, and make comparisons where relevant.

Overall, both downloads and physical sales of music have steadily declined. The latter has slumped since 2011, while the downturn for the former began in 2014. However, there has been a sharp rise in people streaming music since 2013.
In 2011, the majority of music sales were of CDs, at 55% of all sales. In contrast, streaming was not common at all at only 5%. Also, although people had started to download music, it only represented 35% of sales. As sales of CDs began to fall, downloads started to rise. They rose steadily and downloads overtook physical sales in mid-2013. During the same period, streaming doubled to 10% but then it started to grow more dramatically.
Downloads peaked in 2014 at about 43% of sales but fell to 30% by 2018. This was slightly higher than physical sales, which shrank to 25%. Streaming, on the other hand, overtook both of them and accounted for just over 40% of sales in 2018.
Please note: This page was designed for writing practice only. Information in the graph may not be accurate.
- Change the words in the question to introduce your answer, e.g. This graph shows = This graph illustrates .
- The second paragraph should give an overview of the main points the graph shows (imagine you're describing the results to someone who can't see the graph).
- The following paragraphs should describe the main patterns or trends in more detail.
- Use precise vocabulary like steadily declined and a sharp increase to describe trends. Use linking expressions like while and in contrast to make comparisons.
- The question asks you only to 'Summarise the information'. Don't give reasons why these trends might have occurred, or your personal preferences on the topic.
TrueOrFalse_MjMxNjY=.xml
ReorderingHorizontal_MjMxNjc=.xml
GapFillDragAndDrop_MjMxNjk=.xml
What are the trends in the way you have been buying and listening to music over the last five to ten years?
Language level
This graphical representation depicts or illustrates the revenue generation status of three major activities which are relevant to music industry namely Streams, Downloads and CD purchases. The graph is plotted with respect to the percentage of above across the range of years from 2011 till 2018. Detailed analysis of the statistics clearly indicate that the financial outcome obtained from CDs was highest during the year 2011 contributing about 50 to 60 percent of the revenue. However, the same has declined gradually over a period of time. On the contrary, the sales pattern of Streams depicts a consistent rise eventually leading to favorable profit margin. Both of these items have experienced significant variations. As compared with above two, the cost returns from Downloads seems to be having potential variations with frequent rise and fall. It has produced a peak of profit margin somewhere in the year 2014. However, it has failed to maintain its stability in span of years. The above study indicates a comparison of concrete statistical data in terms of music as an entertainment sector in the range of years.
- Log in or register to post comments
I would like to take advantage of my age and go deeper back into the past until the eighties when I started to listen to music using cassettes we recorded from the radio! The quality was very bad but we liked it anyway, spending hours listening to songs interrupted by the voice of the radio's announcer or the surrounding noises of our home. In the nineties the CD appeared with its incredible high quality of sound. I spent a lot of money buying CDs because I thought they would last for a lifetime. But 20 years later all changed with the music streaming and I no longer use my almost 500 CDs that are now only a nice memory of my youth.
As far as I remember I have been always fond of music. In any period of my life, I was attracted to a specific style of music based on my mental and emotional condition. Sometimes wordless, epic, happy, dance, meditation, and relaxing music. Listening to music has become one of my personality habits, so to speak. In fact, I think the music listening trend has been a constant line for me and only the styles have changed.
I usually listen to audio files, when I'm coding, taking a walk, meditating, controlling my anger, cleaning my room, in the bathroom, subway, in noisy places, and so on.
Of course, because my sense of hearing is strong and I generally learn many things through listening. besides music, I listen to lots of educational audio files.
But as it turned out, especially in the last five years, I have gotten really interested in wordless, meditation, and relaxing music. This type of music makes my mind orderly and calm and increases its performance.
About buying music, I have always downloaded music for free though if I like one that is paid, I will definitely buy it.
Over the last five to ten years I have been listening and downloading music from various social media sites like spotifly tiktok or youtube.
When I was a teenager, I would love to listen to the radio. During that time, FM radio, which aired trendy songs, were popular. Moreover, I did buy some copied CD from the illegal seller and listened to those English Songs. Unfortunately, I have to admit that I did not have much knowledge about copyrights and much thinking about how much effort that the artists had to put for their art pieces. Nowadays, I mostly stream on Spotify and YouTube for my favourite songs.
The Hallyu Wave of K-Pop obviously, started in 2016. For the past six years, I was listening to korean music, from alt/indie to k-pop and from r&b to ballad. But, if I may take the times to years before that, I was just listening to some mainstream pop and r&b, sang by famous pop stars. On the other hand, for the last 2-3 years, I have been listening to many artists from various genres. I like how quite diverse it turns my playlist to and I will probably keep up this trend for a while.
Through the years, all I do to find out music is watching YouTube. Recently I start watching rhythm gamers, and I found many good songs that I never heard of (started using internet since 2016 so yea), like Fallen Symphony or At the Speed of Light.
I used to listen to music on a casette player, I remeber I would play my favorite song again and again, Nowadays due to the advancement of technology listening to music becomes more convenient and accessible.
Over the last five to seven years I have been listening and downloading music from various social media sites.
The trend in the world I'm seeing that future is all about streaming. I listen music on streaming not download and buying CD. In the future trends of streaming is dramatically rise.
Online courses

Group and one-to-one classes with expert teachers.

Learn English in your own time, at your own pace.

One-to-one sessions focused on a personal plan.

Get the score you need with private and group classes.
- Skip to primary navigation
- Skip to main content
- Skip to primary sidebar
- Skip to footer

IELTS Advantage
IELTS Preparation Courses
IELTS Bar Chart Sample Essay
Static or Dynamic?
Before writing an IELTS task 1 bar chart or line graph answer it is important that we analyse the question correctly. Taking a few minutes to do this will help us write a clear answer that fully responds to the question. Just what the examiner wants us to do.
The first thing we need to do is decide if the bar chart is static or dynamic. Static means that the data comes from one point in time. Dynamic means the data comes from more than one point in time.
Whether a chart is static or dynamic will affect the information we choose to include in our answer and the kind of language (tense, grammar etc.) we use.
If it is dynamic we will have to compare the different times and comment on the general trends over the time period.
If it is static we will have to compare the different variables, in this case countries, car price, GDP and time it takes for one person to buy a car.
Main Features
Every IELTS academic task 1 question asks us to ‘select and report the main features’.
This means that we have to not only pick the most significant information from the graph and include it in our essay, but also decide which information is not important and should therefore not be included in our essay. One of the biggest mistakes you can make in task 1 is including all the information you see.
So which information should you choose?
You should look for:
- highest/lowest values
- biggest differences
- similarities
- significant exceptions
- anything else that really stands out
There are 3 main features in this graph
1) It takes over 26 years for a Vietnamese person to buy a car.
2) Vietnam has the second highest average costs but the second lowest wages.
3) Cost of a car in Singapore is nearly 3 times the next most expensive.
I advise my students to follow a basic four paragraph structure for these kinds of questions.
Paragraph 1
Paraphrase the question using synonyms.
Paragraph 2
Provide an overview of the main features. No need to include any data in this paragraph, just tell the examiner what is happening in general terms. If you had to describe the main features in two sentences, what would you say?
Paragraph 3
This is where we get more specific and use data. Take 2 of the main features (from your overview) and describe them in detail using data from the chart.
Paragraph 4
Simply do the same thing as you did in paragraph 3, but with two other main features (from your overview).
Sample Answer
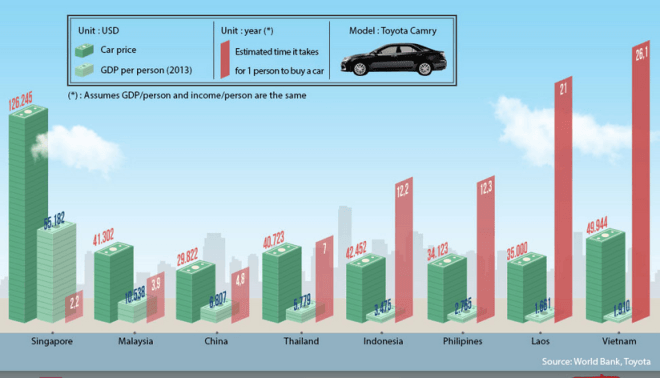
The graph compares the GDP per capita, cost of a Toyota Camry and approximate length of time it takes for 1 citizen to purchase that mode of transport in eight Asian countries.
Despite having the second lowest average yearly income, it costs more to buy this car in Vietnam than in all but one other Asian nation. It also takes significantly longer for a standard person to buy an automobile in Vietnam than in any other state in Asia. On the other end of the scale, Singaporeans have to pay nearly three times more for their cars than the Vietnamese and it takes them the least amount of time to afford a motor vehicle.
It costs $49,944 to buy a Toyota Camry in Vietnam, but this dwarfs the average yearly income per person at just $1,910. It would therefore take a normal man or woman 26.1 years to save up for that particular car.
This is in contrast to Singapore where it costs $126,245 for that model of motorcar, however the average salary is much greater at $55,182. This means that it generally takes just over 2 years for a typical individual from Singapore to acquire this vehicle.
(200 words) Band 9.
It should be noted that this is not a real IELTS task 1 question. This is just a chart that I saw on the internet, but it allowed me to make a very important point- you don’t have to mention everything on the graph. I only talked about 2 out of the 8 countries and I still wrote 200 words and answer the question fully. The key is finding the most significant data and not talking about anything else. Don’t worry, you won’t lose marks for not talking about everything, quite the opposite.
This graph is also good for demonstrating how important it is to vary your vocabulary. There were four words that could have been overused in this essay- car, average, country and people. Instead of repeating them over and over again I used synonyms to show the examiner I have a wide vocabulary and gain extra marks. Here are the synonyms:
Car- Toyota Camry- automobile- vehicle- motor vehicle- motorcar
Average- approximate- normal- typical- standard
Country- countries- nation- state
People- citizen- man or woman- individual
Next time you see a chart or graph in a newspaper, in a textbook or on the internet, think about what the main features are and what common words would you have to vary with synonyms.
I hope you have found these tips useful. If you have any questions, let me know below.
For more band 9 sample essays check out our task 1 sample essay page.
About Christopher Pell
My name is Christopher Pell and I'm the Managing Director of IELTS Advantage.
I started IELTS Advantage as a simple blog to help 16 students in my class. Several years later, I am very humbled that my VIP Course has been able to help thousands of people around the world to score a Band 7+ in their IELTS tests.
If you need my help with your IELTS preparation, you can send me an email using the contact us page.
IELTS Mentor "IELTS Preparation & Sample Answer"
- Skip to content
- Jump to main navigation and login
Nav view search
- IELTS Sample
20 Recent IELTS Graph samples with answers
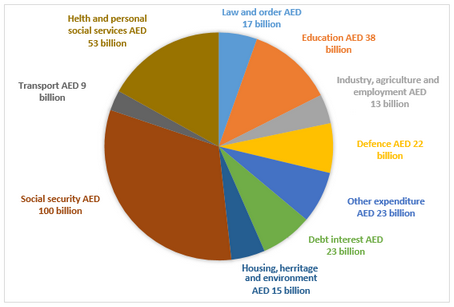
The chart below shows how much money is spent in the budget on different sectors by the uae government in 2000..
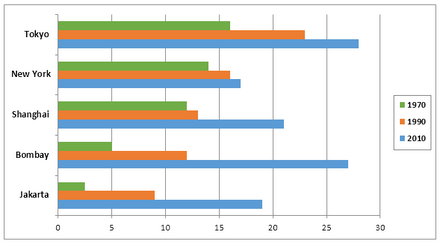
The charts below show the growth in the population in some of the world’s largest cities as well as the population distribution in urban and rural areas.
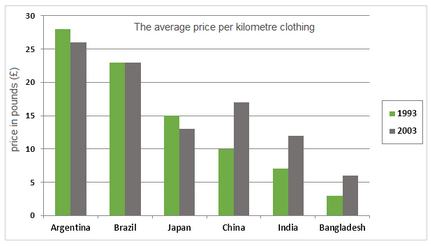
The average prices per kilometre of clothing imported into the European Union from six different countries in 1993 and 2003 are shown in the bar chart below.
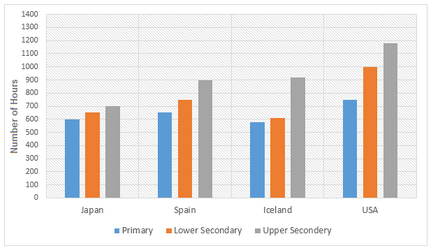
The bar charts below show the number of hours each teacher spent teaching in different schools in four different countries in 2001.
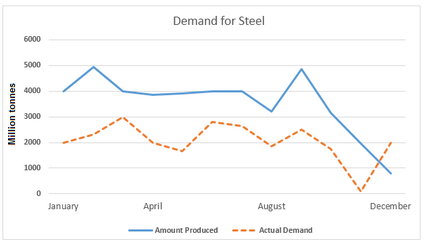
The line graphs below show the production and demand for steel in million tonnes and the number of workers employed in the steel industry in the UK in 2010.
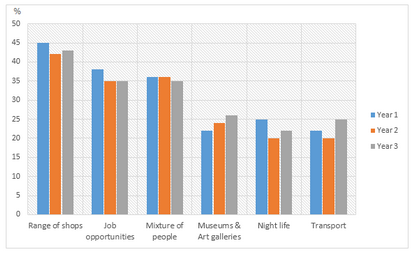
The bar charts and line graph below show the results of a survey conducted over a three-year period to discover what people who live in London think of the city.
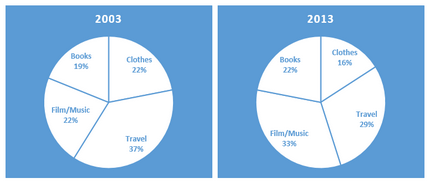
The pie charts below show the online sales for retail sectors in New Zealand in 2003 and 2013.
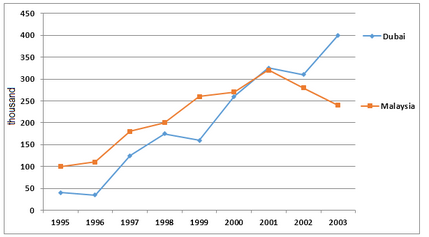
The number of tourists visiting Malaysia and Dubai from 1995 to 2003 is presented below.
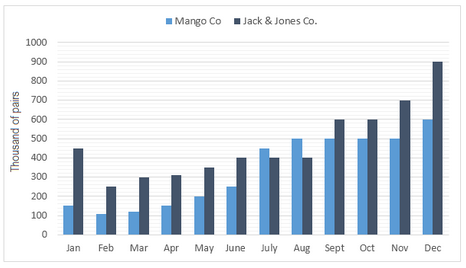
The bar chart below shows the estimated sales of jeans for two companies next year in Turkey. The pie chart shows the projected market share of the two companies in jeans at the end of next year.
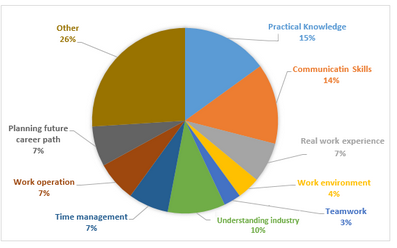
The graph below shows a survey result of 4000 participants who expressed what important aspects they have learned from the internship they have completed.
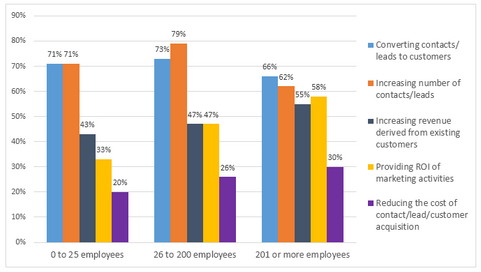
The graph below shows the top priorities by business companies in the USA in 2016.
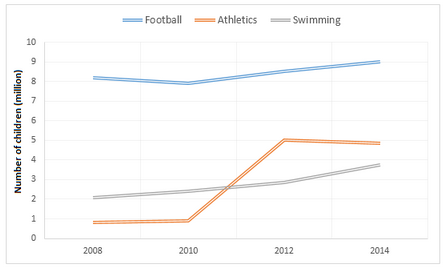
The graphs below show the average monthly expenditure on children’s sports and participation in different sports in the UK from 2008 to 2014.
The pie charts below show the online shopping sales for retail sectors in Australia in 2010 and 2015.

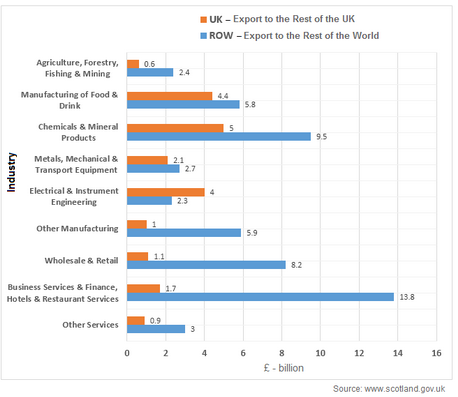
The bar chart below shows Scotland’s exports to the rest of the UK and the rest of the world for the year 2014.
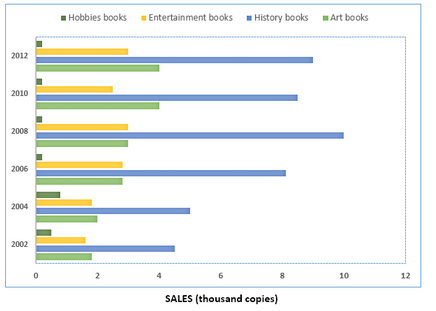
The chart below shows the changes in sales of four different types of books from 2002 to 2012.
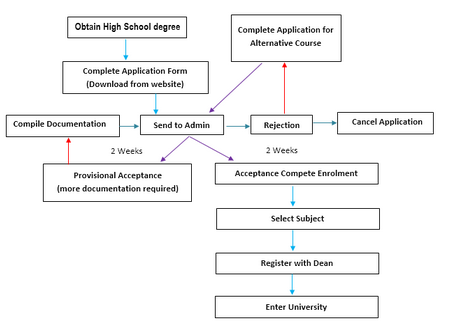
The diagram shows the procedure for university entry for high school graduates.
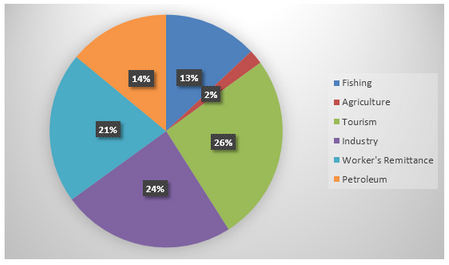
The chart below shows Morocco’s income from different economic sectors in 2003 as well as its income from fishing from 1982 to 2003.
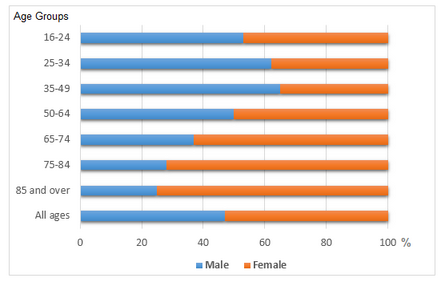
The bar chart below shows the proportions of English men and women of different ages who were living alone in 2011. The pie chart compares the numbers of bedrooms in these one-person households.
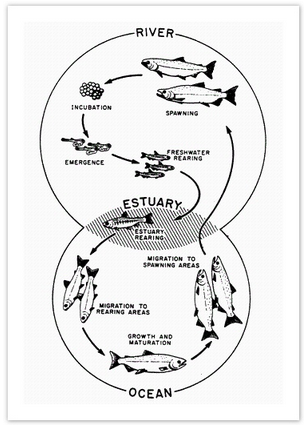
The diagram below shows the life cycle of a salmon, from egg to adult fish.
The table below shows the worldwide market share of the notebook computer market for manufacturers in the years 2006, 2007 and 2014.

- Academic Writing Task 1
IELTS Materials
- IELTS Bar Graph
- IELTS Line Graph
- IELTS Table Chart
- IELTS Flow Chart
- IELTS Pie Chart
- IELTS Letter Writing
- IELTS Essay
- Academic Reading
Useful Links
- IELTS Secrets
- Band Score Calculator
- Exam Specific Tips
- Useful Websites
- IELTS Preparation Tips
- Academic Reading Tips
- Academic Writing Tips
- GT Writing Tips
- Listening Tips
- Speaking Tips
- IELTS Grammar Review
- IELTS Vocabulary
- IELTS Cue Cards
- IELTS Life Skills
- Letter Types

- Privacy Policy
- Cookie Policy
- Copyright Notice
- HTML Sitemap
- Memberships
- Institutional Members
- Teacher Members

by AEUK | Feb 22, 2019 | Speaking | 0 comments
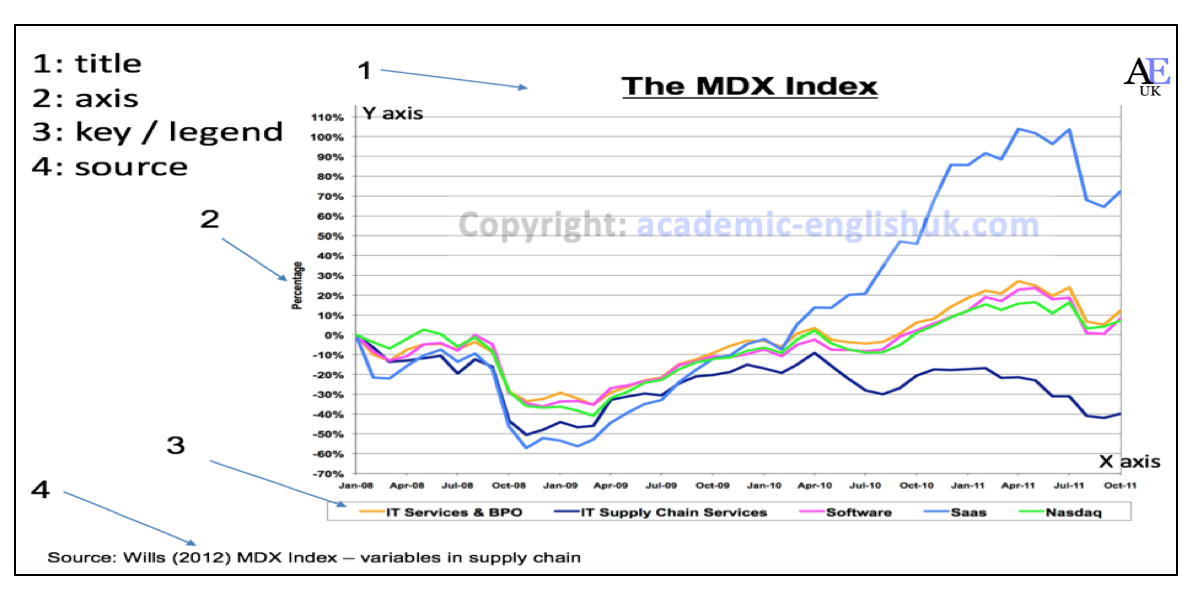
Describing Graphs
This blog offers two great lessons on describing, analysing and evaluating graphs / charts / tables.
The first lesson begins with naming different graph / chart types and describing a range of different lines (peak, plummet, etc..). It finishes with a fun activity where students describe and plot the lines on four graph s.
The second lesson provides the language necessary for describing, analysing and evaluating graphs. It is followed by researching and analysing graphs/charts/tables from the Office of National Statistics (ONS) and giving a short presentation on the findings.
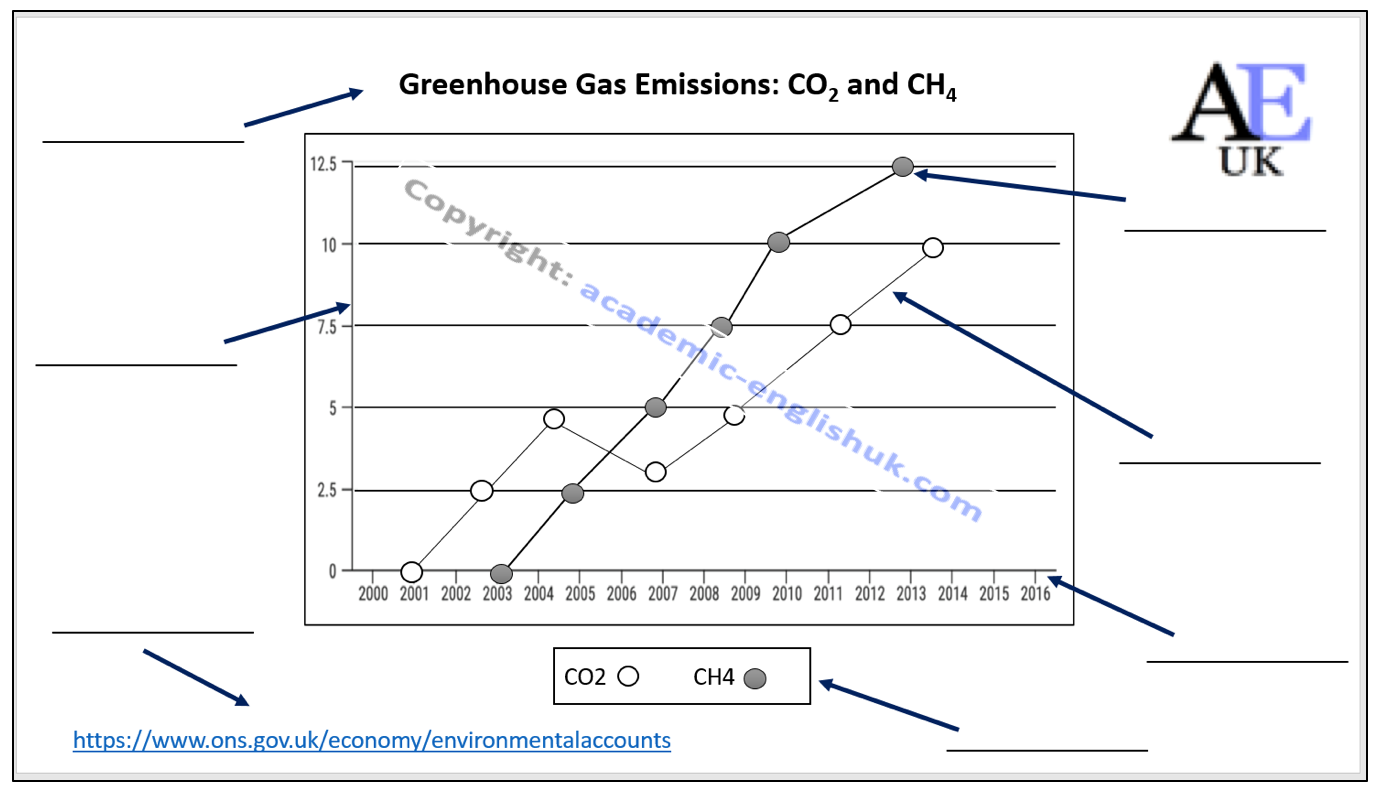
The basic features of a graph
- Label the basic parts on this graph

Describe these graphs / charts (analysis) and then suggest the reasons for these trends (evaluation)
1. Analysis: Peaks in Feb, April, Dec.
2. Evaluation: Product is flowers (Feb=Valentine’s day / April = Easter / Dec = Christmas).
Other answers are possible with justification.
1. Analysis: Peak sales in June, July, August
2. Evaluation: Ice cream sales
Useful graph language: Description
The graph from (source) presents data on (title)…
The graph from (source) shows/ illustrates (title)…
If we look at this graph on (title) from (source) you can see…
The y axis (vertical) is… and the x axis (horizontal) is…
(Graph) These lines represent… (Bar) These Columns are… (Pie) These segments are… (Table)
These rows are…
18 more different graphs / charts / tables with paid version.
Other topics: life satisfaction / divorce / religion / mental health / alcohol / mobile phones / murder / technology / leisure / population growth / life expectancy / etc..
Describing Results (questionnaire data) [new 2023]
This lesson teaches students how to describe the results from a questionnaire. It provides language for describing quantities, group sizes, specific features and reporting verbs. It includes model answers and a range of practice activities. Example Level: ** *** [B1/B2/C1] TEACHER MEMBERSHIP / INSTITUTIONAL MEMBERSHIP
Academic description, analysis & evaluation
This lesson helps to improve students’ awareness and understanding of the difference between description, analysis and evaluation. It includes paragraph analysis, a detailed language review reference sheet and graph and sentence level quotation analysis. Example. Time: 120mins. Level *** ** [ [B2/C1] TEACHER MEMBERSHIP / INSTITUTIONAL MEMBERSHIP
Memberships (Teacher / Institutional)
Full access to everything - £100 / £200 / £550
Join today * x
More Blog posts…
Advertisement
- IELTS Academic Task 1: How to Answer Bar Graph Essay
- IELTS Writing Academics Task 1
IELTS Academic task 1 requires you to write atleast 150 words report about a bar chart.
Describing the bar graph for the IELTS exam is difficult. The language and the answer will vary according to what you see in the graphical representation.
In this article, we will discuss what a Bar graph essay is and how to answer it to get the highest score.
Introduction: Bar Graph Essay
A bar chart uses either horizontal or vertical bars to show the comparisons among two or more categories. One axis of the chart shows the specific categories compared and the other one represents a given value. The bar graph reveals the change in any specific phenomenon over a given time.
This is one example from Google not one from the IELTS question paper. The graph explains the total number of telephone calls in the UK divided into 3 categories, from 1995-2002.
Part 1 - Part one is the introduction of the question and provides the relevant information of the question
Part 2- It summarizes the information by helping you count on the main features and make comparisons where relevant.
Part 3- a graphic representation of the question
Bar-graph for IELTS Writing
As it can be easily deciphered from above, a bar graph is just another way of representing data. In the IELTS Writing Task 1, you can be asked to describe a bar graph. You will need to describe the chart within 150 words. It is recommended to complete the task within 20 minutes.
Structure of Bar Graph Essay
Walking by the right structure of answering the bar graph question improves your chances of scoring well. You should re-read the question and answer in the following manner:
- Introduction
- Body Paragraph 1
- Body Paragraph 2
Another format you can follow for writing a bar graph essay in IELTS Academic Writing task 1 is:
- Introduction Paragraph
- Body Para 1
- Body Para 2
Marking Criteria of the IELTS Writing test
- Task Achievement
- Cohesion and Coherence
- Lexical Resource and Vocabulary
- Grammar range and accuracy
Ways to plan your IELTS Academics Writing Task 1
1. Analyze the type of question Analyze the question type, go through the instructions, figures, facts, and information, and frame your introduction. You can begin your introduction by paraphrasing or writing what your graph shows and from time. Describe the bar graph through a general overview of about 2-4 key features.
2. Identify the main features Every bar graph has some main features. Refrain from writing every single detail mentioned. Pick the important trends in the bar graph and discuss them in the paragraphs.
3. Brainstorm the ideas and the vocabulary Develop your ideas as to how well you can represent the whole thing within the word limit. Understand the type and the context of the question and use the right vocabulary for ensuring a good score in the IELTS writing section.
Detailed Paragraphs For writing your answer and expanding it, you can utilize the second point, which is identifying the main features. You can identify and detail the main features of the bar graph to create a well-oriented answer.
Common Mistakes to Avoid in IELTS Academic Task 1 1. Incomplete analysis of the data When you are presented with a bar graph, you have to analyze the complete data and present your view on it. Skipping certain important detail is one of the primary mistakes you should avoid. 2. Writing explanation for data Don’t cite any hypothetical reasons for the change of the data. Mention what is there in the question and don’t go overboard with hypothetical analysis. 3. Missing out on writing overview The overview accounts for the main part of the essay. Don’t forget to write an overview of the data given to ensure your desired score. 4. Mentioning every detail As said above, before writing the essay it is important to read the topic twice. The IELTS requires you to answer specifically and present your opinion on the essay. Only pick 2-3 important trends in the paragraph else you might go off-topic and exceed the word limit. 5. Exceeding the word limit Exceeding the word limit is something you should avoid in IELTS Academic task 1. The ideal word limit is 160-180 words. This word limit is enough to make your point clear and proofread it. 6. Inappropriate/ illogical structure The structure of the essay is crucial. Therefore, you should plan your writing following the structure as mentioned above. 7. Missing out on planning the writing Planning helps you have a tab over the whole thing. There exist enough time to plan your introduction, body, and conclusion for the essay in the IELTS Academic task 1. So, these are some of the common mistakes to avoid while preparing your bar graph essay for the IELTS academic task 1.
If you want to progress in the bar graph essay writing in the IELTS Academic task 1, you need to practice, strategize, and explain your points in a concise and impactful manner.
You can subscribe to Unlock IELTS with Richa to learn more about the tips and strategies to crack IELTS Academic Task 1 and improve your prospects.
Get Free Ebook
Enroll for Free Last Day Strategies
Related Posts

Last Day Strategies : IELTS Writing (Academics)

How to answer table chart essay in IELTS writing task 1 Academics

IELTS writing task 1 Academics: Understanding coherence and cohesion marking criteria

How to Answer Pie Chart Essay in IELTS Writing Task 1 Academics

Understanding Task Achievement Marking criteria in IELTS writing task 1 Academics

How to answer line graph essay in IELTS writing task 1 Academics
Recent posts.

UnlockIelts- Designed for Your Success

Unlock your inner potential – How ‘Unlockielts’ makes it happen for you.

'Crushing The Curve': A Study Plan For Spectacular Results In Unlickielts Courses

'UnlockIELTS' Partner Program - Helping Others Meet Their English Language Goals!

Top 10 Myths About Preparing for the ILETS Exam Debunked

'Unlock' Your Score Today - Access Latest Tools and Techniques for Aceing IELTS Exam!
of , how would you rate this course overall, write a public review.
- Richa Raj
IELTS Writing Task 1 – Bar Chart Essay Example 1
In this post, we will look at a Writing Task 1 Academic bar chart essay example from the IELTS writing task 1 Academic Test. Students often ask if the questions are repeated year after year and the answer is no, but the type of chart or graph can be.
There are so many questions written each year, you may find you practice answering various questions on different topics. It is best practice to learn how to answer each one of the various types of writing task 1 questions , from bar charts, line graphs, maps, process etc.
If you would like to learn how to structure a charts and graphs essay please click the button below >
Take a look at the IELTS Writing Task 1 Academic essay example below >>
*This chart question and answer were provided by a student. IELTS Achieve did not design this bar chart question*
The bar chart describes comparative statistics on the number of products exported by Someland in 2005 and 2015 and its projected exports for 2025. The units were measured in USD billion.
Overall, the most profitable export Someland had from 2005 and 2015 was from international tourism, while the lowest can be seen in meat produce. It can also be seen in the data that by 2025 they are still expecting that international travels will dominate the Someland export industry whereas meat produce will still bring in the least amount of revenue.
On the one hand, the graph shows that International tourism was consistently high, with nearly 6.5 billion USD earned in 2005 and almost 7 billion USD in 2015. Similarly, this can be said in dairy products where roughly 5 million USD and approximately 8 million USD was grossed in 2005 and 2015 respectively. Meat products started at 4 million USD dollars in 2005 but decreased after 10 years (3.5 million USD, 2015).
On the other hand, a projected study was also included in the data, where they are expecting an increase by 2025 in International tourism which could receive 8 million USD, while decreases in both dairy products (7.5 billion USD) and meat products (3 billion USD) are also expected.
Word count – 211 / Band Score 8

- Task Achievement – The answer provides a paraphrased question, to begin with, followed by an overview that gives the reader key information.
- Coherence and Cohesion – The answer has been divided into clear logical paragraphs.
- Lexical Resource – There is evidence of paraphrasing, synonyms and some less common words.
- Grammatical Range and Accuracy – The answer has no grammatical errors. The sentences are mainly made up of multiple clauses and have a variety of structures.
We hope you found this post useful in helping you to study for the IELTS Test . If you have any questions please let us know in the comments below or on the Facebook page.
The best way to keep up to date with posts like this is to like us on Facebook , then follow us on Instagram and Pinterest . If you need help preparing for the IELTS Test, join the IELTS Achieve Academy and see how we can assist you to achieve your desired band score. We offer an essay correction service, mock exams and online courses.
Related Posts

How To Understand Any Type Of Writing Task 2 Question?
Learn how to understand and analyse any IELTS Writing Task 2 question.

IELTS Problem/Solution Essay Sample 1 – Environment
IELTS Writing Task 2 problem/solution essay example that is a band score 8. The question…
Leave a Comment Cancel Reply
Your email address will not be published. Required fields are marked *
Save my name, email, and website in this browser for the next time I comment.
- Link to facebook
- Link to linkedin
- Link to twitter
- Link to youtube
- Writing Tips
How to Write a Perfect Analytical Paragraph

- 8-minute read
- 30th January 2023
If you are looking up how to write an analytical paragraph, you are most likely writing an argumentative or analytical essay. Analytical essays are similar to other essays, such as descriptive essays, in that you have a central idea, organize supporting ideas into body paragraphs, and make conclusions.
However, analytical essays differ from other essays because the writer must go further. They require the writer to interpret and analyze a given text or information using evidence to support their central idea or thesis statement. This analysis takes place in analytical paragraphs, or body paragraphs, if you are writing an analytical essay .
In this article, you’ll learn the components of a perfect analytical paragraph: the topic sentence, evidence, analysis, and conclusion. Keep reading to learn more.
What Is an Analytical Paragraph?
An analytical paragraph is a paragraph that breaks down a piece of literature, an idea, or a concept into smaller parts and analyzes each part to understand the whole. Being able to write an effective and successful analytical paragraph reflects a writer’s critical thinking and organizational writing skills. All in all, like any other type of writing, writing an analytical paragraph requires skill and practice.
Write the Topic Sentence
A topic sentence is usually the first, or sometimes second, sentence at the beginning of anybody paragraph. Your topic sentence should contain one main idea related to the thesis statement . If it is not related to your thesis statement, then you are likely off topic.
Pro Tip: If your topic sentence is the second sentence of your paragraph, then your first sentence should be a transitional sentence .
Let’s look at a thesis statement and some topic sentences to get a better idea.
Topic: Examine and analyze the marriages in George Eliot’s Middlemarch .
Thesis Statement: Eliot uses three different marriages to give depth to everyday people and show the reader the struggles of marriage within the nineteenth century’s societal standards of submissive roles, class range, and financial status.
Topic Sentence 1: Lydgate and Rosamond had a terrible marriage in Middlemarch , like all other marriages during this time.
This topic sentence is not effective because it is not specific enough and does not directly relate to the thesis statement. It does not mention how their “terrible” marriage is related to submissive roles, class range, or financial status. Additionally, the overly generalized language of “all” marriages being terrible marriages during this time is a weak argument.
Topic Sentence 2: Financial matters play a huge role in the Lydgate and Rosamond marriage, as Lydgate has no money and Rosamond is a big spender.
This topic sentence is effective because it directly supports the thesis statement. It is focused on the financial status of this marriage.
Provide Evidence
The type of evidence you use to support your topic sentence will largely depend on the topic of your analytical essay. For example, if you are writing an essay related to a work of literature, you will need to provide direct quotes, paraphrasing, specific details, or a summary from the work to support your main idea. If your topic is related to analyzing data, then you may use figures, statistics, or charts and graph evidence to support your topic sentence.
Regardless of what type of evidence you provide, it must be appropriate and directly relate to and support your topic sentence.
For example, if we take the above thesis and topic sentence, we might select direct quotes, paraphrases, or summaries from the novel Middlemarch that depict the marriage’s financial stress.
Pro Tip: When using direct quotes, make sure you always provide an in-text citation and use correct punctuation to ensure your essay is neat and clean.
Find this useful?
Subscribe to our newsletter and get writing tips from our editors straight to your inbox.
Once you have provided evidence, you should analyze it to illustrate its significance and how it relates to the topic sentence. In your analysis, you can discuss how an author uses certain literary devices to emphasize character traits, themes, patterns, and connections in a literary work.
Be sure that your analysis always connects to the topic sentence/main idea of the paragraph. Avoid introducing new ideas in this section. Save those for later paragraphs or consider creating a new one to explore and analyze the new point.
Conclude Your Paragraph
When closing an analytical paragraph, you can consider doing two things:
● Briefly emphasize the main point your reader should take away after having read the paragraph.
● Begin a transition if the analysis continues into the next paragraph. (This strategy may be more suitable for longer, more in-depth analytical essays).
Using the above example topic sentence, we might conclude the paragraph as follows:
Notice how this concluding statement not only emphasizes the main points from the paragraph but also ties back into the thesis statement.
Writing Tips For Analytical Paragraphs
Leave out first person language.
Avoid using language such as “in my opinion,” “from my perspective,” or “I think.” While the analysis is your interpretation of a text or information, you should rely on and focus on using evidence to support your ideas. Overall, you should aim to maintain an objective tone .
Instead of saying “I think Rosamond is manipulative,” you should use evidence from the text to show that she was manipulative. For example, “Rosamond shows a pattern of manipulation throughout Middlemarch , specifically toward her husband. For instance, she says, ‘…’”
Do Writing Exercises
When writing, especially in the early drafts of an essay, it is typical to find the main idea of a paragraph at the end. This is a natural course for our thinking process. However, the main idea should be presented as your topic sentence at the beginning of this paragraph. Additionally, most students leave this main idea at the end because they do not identify it as the main idea.
To overcome this dilemma, try a looping prewriting exercise . In this exercise, you write continuously for a designated time (maybe 10 minutes, your choice). At the end of that time, read over what you’ve written and circle the main idea of the text (this is usually at the end). In the next cycle, you start with this main idea at the beginning and further examine and analyze it.
This is a wonderful exercise to help you pick out main ideas and delve deeper into your analysis.
Get Feedback
If you are a student, there are several options to get feedback for free. Ask a friend to read your essay. Go to your writing center to get feedback and help with your writing. Go to your professor’s office hours with your writing or questions to get detailed advice. More often than not, they are happy to see you take advantage of their expertise.
As a working professional, writer, or author, you can look to fellow authors or bookish friends to read your work. You can find free beta readers online from sites such as Goodreads to get feedback from your target audience. You can also find writing groups on social media platforms.
Proofread Your Work
It can be easy to finish writing an essay and think “Finally, I’m done!” Unfortunately, that is only half the process. Be sure to always read and reread your writing before hitting submit. Check for stray commas, spelling errors, or awkward sentences to make your main ideas and hard work shine. Learn about 6 Quick and Easy Tips for Proofreading you can do at home.
Writing an analytical paragraph doesn’t have to be stressful. Be sure to include a topic sentence at the beginning of your paragraph that connects to the thesis statement. Provide a variety of evidence to support your main idea, analyze the text by highlighting literary devices used, themes, and patterns, and end with a brief concluding statement.
If you need more help with writing analysis, descriptive essays, or any other type of essay, then Proofed is here to help. Try our free trial today!
What Is a Topic Sentence?
A topic sentence goes at the beginning of a body paragraph and clearly states the main idea of the paragraph.
How Do I Organize an Analytical Paragraph?
An analytical paragraph has four components: topic sentence, evidence, analysis, and conclusion. The topic sentence is the most important part of any body paragraph because it establishes the main idea of the paragraph and relates to the thesis statement.
What Makes a Good Analytical Paragraph?
A good analytical paragraph has a clear topic sentence, strong evidence, and a thorough analysis that reflects the writer’s critical thinking and writing skills. It should conclude by emphasizing the main idea of the paragraph and how it supports the essay overall.
Share this article:
Post A New Comment
Got content that needs a quick turnaround? Let us polish your work. Explore our editorial business services.
3-minute read
What Is a Content Editor?
Are you interested in learning more about the role of a content editor and the...
4-minute read
The Benefits of Using an Online Proofreading Service
Proofreading is important to ensure your writing is clear and concise for your readers. Whether...
2-minute read
6 Online AI Presentation Maker Tools
Creating presentations can be time-consuming and frustrating. Trying to construct a visually appealing and informative...
What Is Market Research?
No matter your industry, conducting market research helps you keep up to date with shifting...
8 Press Release Distribution Services for Your Business
In a world where you need to stand out, press releases are key to being...
How to Get a Patent
In the United States, the US Patent and Trademarks Office issues patents. In the United...

Make sure your writing is the best it can be with our expert English proofreading and editing.
Have a language expert improve your writing
Run a free plagiarism check in 10 minutes, generate accurate citations for free.
- Knowledge Base
- How to write a literary analysis essay | A step-by-step guide
How to Write a Literary Analysis Essay | A Step-by-Step Guide
Published on January 30, 2020 by Jack Caulfield . Revised on August 14, 2023.
Literary analysis means closely studying a text, interpreting its meanings, and exploring why the author made certain choices. It can be applied to novels, short stories, plays, poems, or any other form of literary writing.
A literary analysis essay is not a rhetorical analysis , nor is it just a summary of the plot or a book review. Instead, it is a type of argumentative essay where you need to analyze elements such as the language, perspective, and structure of the text, and explain how the author uses literary devices to create effects and convey ideas.
Before beginning a literary analysis essay, it’s essential to carefully read the text and c ome up with a thesis statement to keep your essay focused. As you write, follow the standard structure of an academic essay :
- An introduction that tells the reader what your essay will focus on.
- A main body, divided into paragraphs , that builds an argument using evidence from the text.
- A conclusion that clearly states the main point that you have shown with your analysis.
Instantly correct all language mistakes in your text
Upload your document to correct all your mistakes in minutes

Table of contents
Step 1: reading the text and identifying literary devices, step 2: coming up with a thesis, step 3: writing a title and introduction, step 4: writing the body of the essay, step 5: writing a conclusion, other interesting articles.
The first step is to carefully read the text(s) and take initial notes. As you read, pay attention to the things that are most intriguing, surprising, or even confusing in the writing—these are things you can dig into in your analysis.
Your goal in literary analysis is not simply to explain the events described in the text, but to analyze the writing itself and discuss how the text works on a deeper level. Primarily, you’re looking out for literary devices —textual elements that writers use to convey meaning and create effects. If you’re comparing and contrasting multiple texts, you can also look for connections between different texts.
To get started with your analysis, there are several key areas that you can focus on. As you analyze each aspect of the text, try to think about how they all relate to each other. You can use highlights or notes to keep track of important passages and quotes.
Language choices
Consider what style of language the author uses. Are the sentences short and simple or more complex and poetic?
What word choices stand out as interesting or unusual? Are words used figuratively to mean something other than their literal definition? Figurative language includes things like metaphor (e.g. “her eyes were oceans”) and simile (e.g. “her eyes were like oceans”).
Also keep an eye out for imagery in the text—recurring images that create a certain atmosphere or symbolize something important. Remember that language is used in literary texts to say more than it means on the surface.
Narrative voice
Ask yourself:
- Who is telling the story?
- How are they telling it?
Is it a first-person narrator (“I”) who is personally involved in the story, or a third-person narrator who tells us about the characters from a distance?
Consider the narrator’s perspective . Is the narrator omniscient (where they know everything about all the characters and events), or do they only have partial knowledge? Are they an unreliable narrator who we are not supposed to take at face value? Authors often hint that their narrator might be giving us a distorted or dishonest version of events.
The tone of the text is also worth considering. Is the story intended to be comic, tragic, or something else? Are usually serious topics treated as funny, or vice versa ? Is the story realistic or fantastical (or somewhere in between)?
Consider how the text is structured, and how the structure relates to the story being told.
- Novels are often divided into chapters and parts.
- Poems are divided into lines, stanzas, and sometime cantos.
- Plays are divided into scenes and acts.
Think about why the author chose to divide the different parts of the text in the way they did.
There are also less formal structural elements to take into account. Does the story unfold in chronological order, or does it jump back and forth in time? Does it begin in medias res —in the middle of the action? Does the plot advance towards a clearly defined climax?
With poetry, consider how the rhyme and meter shape your understanding of the text and your impression of the tone. Try reading the poem aloud to get a sense of this.
In a play, you might consider how relationships between characters are built up through different scenes, and how the setting relates to the action. Watch out for dramatic irony , where the audience knows some detail that the characters don’t, creating a double meaning in their words, thoughts, or actions.
Here's why students love Scribbr's proofreading services
Discover proofreading & editing
Your thesis in a literary analysis essay is the point you want to make about the text. It’s the core argument that gives your essay direction and prevents it from just being a collection of random observations about a text.
If you’re given a prompt for your essay, your thesis must answer or relate to the prompt. For example:
Essay question example
Is Franz Kafka’s “Before the Law” a religious parable?
Your thesis statement should be an answer to this question—not a simple yes or no, but a statement of why this is or isn’t the case:
Thesis statement example
Franz Kafka’s “Before the Law” is not a religious parable, but a story about bureaucratic alienation.
Sometimes you’ll be given freedom to choose your own topic; in this case, you’ll have to come up with an original thesis. Consider what stood out to you in the text; ask yourself questions about the elements that interested you, and consider how you might answer them.
Your thesis should be something arguable—that is, something that you think is true about the text, but which is not a simple matter of fact. It must be complex enough to develop through evidence and arguments across the course of your essay.
Say you’re analyzing the novel Frankenstein . You could start by asking yourself:
Your initial answer might be a surface-level description:
The character Frankenstein is portrayed negatively in Mary Shelley’s Frankenstein .
However, this statement is too simple to be an interesting thesis. After reading the text and analyzing its narrative voice and structure, you can develop the answer into a more nuanced and arguable thesis statement:
Mary Shelley uses shifting narrative perspectives to portray Frankenstein in an increasingly negative light as the novel goes on. While he initially appears to be a naive but sympathetic idealist, after the creature’s narrative Frankenstein begins to resemble—even in his own telling—the thoughtlessly cruel figure the creature represents him as.
Remember that you can revise your thesis statement throughout the writing process , so it doesn’t need to be perfectly formulated at this stage. The aim is to keep you focused as you analyze the text.
Finding textual evidence
To support your thesis statement, your essay will build an argument using textual evidence —specific parts of the text that demonstrate your point. This evidence is quoted and analyzed throughout your essay to explain your argument to the reader.
It can be useful to comb through the text in search of relevant quotations before you start writing. You might not end up using everything you find, and you may have to return to the text for more evidence as you write, but collecting textual evidence from the beginning will help you to structure your arguments and assess whether they’re convincing.
To start your literary analysis paper, you’ll need two things: a good title, and an introduction.
Your title should clearly indicate what your analysis will focus on. It usually contains the name of the author and text(s) you’re analyzing. Keep it as concise and engaging as possible.
A common approach to the title is to use a relevant quote from the text, followed by a colon and then the rest of your title.
If you struggle to come up with a good title at first, don’t worry—this will be easier once you’ve begun writing the essay and have a better sense of your arguments.
“Fearful symmetry” : The violence of creation in William Blake’s “The Tyger”
The introduction
The essay introduction provides a quick overview of where your argument is going. It should include your thesis statement and a summary of the essay’s structure.
A typical structure for an introduction is to begin with a general statement about the text and author, using this to lead into your thesis statement. You might refer to a commonly held idea about the text and show how your thesis will contradict it, or zoom in on a particular device you intend to focus on.
Then you can end with a brief indication of what’s coming up in the main body of the essay. This is called signposting. It will be more elaborate in longer essays, but in a short five-paragraph essay structure, it shouldn’t be more than one sentence.
Mary Shelley’s Frankenstein is often read as a crude cautionary tale about the dangers of scientific advancement unrestrained by ethical considerations. In this reading, protagonist Victor Frankenstein is a stable representation of the callous ambition of modern science throughout the novel. This essay, however, argues that far from providing a stable image of the character, Shelley uses shifting narrative perspectives to portray Frankenstein in an increasingly negative light as the novel goes on. While he initially appears to be a naive but sympathetic idealist, after the creature’s narrative Frankenstein begins to resemble—even in his own telling—the thoughtlessly cruel figure the creature represents him as. This essay begins by exploring the positive portrayal of Frankenstein in the first volume, then moves on to the creature’s perception of him, and finally discusses the third volume’s narrative shift toward viewing Frankenstein as the creature views him.
Some students prefer to write the introduction later in the process, and it’s not a bad idea. After all, you’ll have a clearer idea of the overall shape of your arguments once you’ve begun writing them!
If you do write the introduction first, you should still return to it later to make sure it lines up with what you ended up writing, and edit as necessary.
The body of your essay is everything between the introduction and conclusion. It contains your arguments and the textual evidence that supports them.
Paragraph structure
A typical structure for a high school literary analysis essay consists of five paragraphs : the three paragraphs of the body, plus the introduction and conclusion.
Each paragraph in the main body should focus on one topic. In the five-paragraph model, try to divide your argument into three main areas of analysis, all linked to your thesis. Don’t try to include everything you can think of to say about the text—only analysis that drives your argument.
In longer essays, the same principle applies on a broader scale. For example, you might have two or three sections in your main body, each with multiple paragraphs. Within these sections, you still want to begin new paragraphs at logical moments—a turn in the argument or the introduction of a new idea.
Robert’s first encounter with Gil-Martin suggests something of his sinister power. Robert feels “a sort of invisible power that drew me towards him.” He identifies the moment of their meeting as “the beginning of a series of adventures which has puzzled myself, and will puzzle the world when I am no more in it” (p. 89). Gil-Martin’s “invisible power” seems to be at work even at this distance from the moment described; before continuing the story, Robert feels compelled to anticipate at length what readers will make of his narrative after his approaching death. With this interjection, Hogg emphasizes the fatal influence Gil-Martin exercises from his first appearance.
Topic sentences
To keep your points focused, it’s important to use a topic sentence at the beginning of each paragraph.
A good topic sentence allows a reader to see at a glance what the paragraph is about. It can introduce a new line of argument and connect or contrast it with the previous paragraph. Transition words like “however” or “moreover” are useful for creating smooth transitions:
… The story’s focus, therefore, is not upon the divine revelation that may be waiting beyond the door, but upon the mundane process of aging undergone by the man as he waits.
Nevertheless, the “radiance” that appears to stream from the door is typically treated as religious symbolism.
This topic sentence signals that the paragraph will address the question of religious symbolism, while the linking word “nevertheless” points out a contrast with the previous paragraph’s conclusion.
Using textual evidence
A key part of literary analysis is backing up your arguments with relevant evidence from the text. This involves introducing quotes from the text and explaining their significance to your point.
It’s important to contextualize quotes and explain why you’re using them; they should be properly introduced and analyzed, not treated as self-explanatory:
It isn’t always necessary to use a quote. Quoting is useful when you’re discussing the author’s language, but sometimes you’ll have to refer to plot points or structural elements that can’t be captured in a short quote.
In these cases, it’s more appropriate to paraphrase or summarize parts of the text—that is, to describe the relevant part in your own words:
Prevent plagiarism. Run a free check.
The conclusion of your analysis shouldn’t introduce any new quotations or arguments. Instead, it’s about wrapping up the essay. Here, you summarize your key points and try to emphasize their significance to the reader.
A good way to approach this is to briefly summarize your key arguments, and then stress the conclusion they’ve led you to, highlighting the new perspective your thesis provides on the text as a whole:
If you want to know more about AI tools , college essays , or fallacies make sure to check out some of our other articles with explanations and examples or go directly to our tools!
- Ad hominem fallacy
- Post hoc fallacy
- Appeal to authority fallacy
- False cause fallacy
- Sunk cost fallacy
College essays
- Choosing Essay Topic
- Write a College Essay
- Write a Diversity Essay
- College Essay Format & Structure
- Comparing and Contrasting in an Essay
(AI) Tools
- Grammar Checker
- Paraphrasing Tool
- Text Summarizer
- AI Detector
- Plagiarism Checker
- Citation Generator
By tracing the depiction of Frankenstein through the novel’s three volumes, I have demonstrated how the narrative structure shifts our perception of the character. While the Frankenstein of the first volume is depicted as having innocent intentions, the second and third volumes—first in the creature’s accusatory voice, and then in his own voice—increasingly undermine him, causing him to appear alternately ridiculous and vindictive. Far from the one-dimensional villain he is often taken to be, the character of Frankenstein is compelling because of the dynamic narrative frame in which he is placed. In this frame, Frankenstein’s narrative self-presentation responds to the images of him we see from others’ perspectives. This conclusion sheds new light on the novel, foregrounding Shelley’s unique layering of narrative perspectives and its importance for the depiction of character.
Cite this Scribbr article
If you want to cite this source, you can copy and paste the citation or click the “Cite this Scribbr article” button to automatically add the citation to our free Citation Generator.
Caulfield, J. (2023, August 14). How to Write a Literary Analysis Essay | A Step-by-Step Guide. Scribbr. Retrieved April 12, 2024, from https://www.scribbr.com/academic-essay/literary-analysis/
Is this article helpful?

Jack Caulfield
Other students also liked, how to write a thesis statement | 4 steps & examples, academic paragraph structure | step-by-step guide & examples, how to write a narrative essay | example & tips, unlimited academic ai-proofreading.
✔ Document error-free in 5minutes ✔ Unlimited document corrections ✔ Specialized in correcting academic texts
Sample details
- Mathematics
- Cartesian coordinate system
- Views: 1,183
Related Topics
- Systems Theory
- Correlation
- Standard Deviation
- Archaeology
- Ethnography
- Research methods
- Distribution
- Galileo Galilei
- Isaac Newton
- Probability
- Materials science
- Social Science
Bar Graph Analysis
Bar graphs best illustrate results that are gathered at one given time and are independent of each other. Results of surveys, then, are best captured in bar graphs. The bar graph below was used by Soraya J. NetoAlvarez to summarize the chances of projects of different sizes – as expressed in terms of total project costs – to be successful.
As shown in the bar graph, the x- axis or the abscissa presents the percentages of success achieved by projects while the y-axis or the ordinate presents the different scales or sizes of projects. The bar graph’s x-axis is divided into equal intervals of 10 percent, from 0 percent at the meeting point of x- and y-axes to 60 percent going to the right. Its y-axis, meanwhile, scales the sizes of the project from the same zero-point of x-axis to less than $750k as the smallest size in terms of project cost to the designated biggest size, over $10 million, as the highest point.
ready to help you now
Without paying upfront
The highest points of both x- and y-axes are set based on the given data to be plotted in the bar graph. In the case of the subject data, the highest percentage of success attained is 55 percent. As to the project sizes, the group that conducted this particular survey formed the scale of sizes and since all the companies that participated in the survey have total project costs that did not go beyond $10 million, then the highest point in the y-axis has been set at over $10 million.
With the x- and y-axes accordingly labeled, the percentages of success of each of the identified project sizes are next plotted as horizontal bars spanning the space from the point that represents 0 percent to the point that represents the exact percentages in the x-axis. Once all the data have formed part of the bar graph, the result is an illustration that gives at one glance the general picture of the details gathered in the course of the survey.
Thus, the bar graph effectively conveys that based on the survey conducted, the small-sized projects turned out to be more successful, while the big-sized projects were the ones with lower chances of success. These same information bits are included in the written lines, but it cannot be argued that the inclusion of the bar graph in the final output serves to provide a good grasp of the data.
- NetoAlvarez, S. (2003). Project Management Failure: Main Causes. Retrieved January 24, 2009 from http://faculty.ed.umuc.edu/~meinkej/inss690/netoalvarez.pdf.
Cite this page
https://graduateway.com/bar-graph-analysis/
You can get a custom paper by one of our expert writers
- Nicolaus Copernicus
- Computer Science
- Plate tectonics
- Equilibrium
Check more samples on your topics
Nora’s secession in a doll’s house: the transformation graph.
Summary This paper studies Henrik Ibsen’s three-act play “A Doll’s House” – a commentary of sorts on the position of women in the late 19th century. The paper focuses on the female protagonist, Nora Helmer, dissects Nora’s relationship to her husband, and proceeds to understand when and why the final moment of truth dawned on the
The Work Relates to Graph Embedding Methods
FoodKG is a unique software in its type and purpose. There are no other systems or tools that have the same features. Our main work falls under graph embedding techniques. Embedded vectors learn the distributional semantics of words and can be used in different applications such as Named Entity Recognition (NER), question answering, document classification,
Analysis of place and promotion-the Hershey’s Candy Bar
Part one we’ve learned and talked about so much as it pertains to product placement. Its simple definition is, the appearance of products in television programs or movies paid for by the manufacturer or a company. In other words to place a product in a market setting, you must undertake a series of processes e.g.
Analysis on Colour Bar Poem
The poem ‘Colour Bar’, by Oodgeroo Noonuccal, explores her downright disgust towards racial prejudice. As a former Aboriginal rights activist, she evidently displays her hatred and dislike towards racism and prejudice through her descriptive poem. The use of poetic techniques assists in conveying her message. Visual imagery and metaphorical language conveys Oodegeroo’s judgment that racial
The Energy Bar Industry Analysis
1. Conduct a thorough analysis of this category’s customer, competitors, market, and environment from the perspective of PowerBar. What are the key strategic questions? What additional information would you like to obtain? How would you obtain it? What are the threats and opportunities? In particular address the following issues: a. How is the market segmented?
Launching a Karaoke Bar in Bangladesh Analysis
INTRODUCTION KARAOKE AVENUE is set to be the inaugural karaoke bar in Bangladesh. This establishment provides a space for individuals to mingle with friends while indulging in the karaoke experience and delectable cuisine. To foster and delight young singers, we will host regular live performances. Our aim is to inaugurate the bar in Dhanmondi, a renowned
Edouard Manets Bar at the Folies Bergere Analysis
Impressionism
Edouard Manets Bar at the Folies Bergere was completed in 1882. This was to be the last major work Manet would complete before his death. The painting was intended for the Salon, and because of his recently awarded Legion of Honor, Manet could be sure this piece would be accepted. This painting would be considered
Bar council of India
Sessions Court appointed Shri S. V. Ardhapurkar, Advocate as amicus curiae to defend the complainant Session Court after trial found the complainants guilty of the offence charged with and awarded them death penalty by an order dated 30th August, 1991. The same date the appellant contacted the complainants in Yervada Central Prison where they were
The Effects of Sin Tax Law to the Bar Owners
Pros and Cons of Sin Tax Sin tax is a tax that is applied to a product that has been deemed undesirable in the general society. An example is a tax that is applied to beer or cigarettes. These tax can be placed to raise money for a certain public amenity like a stadium, when

Hi, my name is Amy 👋
In case you can't find a relevant example, our professional writers are ready to help you write a unique paper. Just talk to our smart assistant Amy and she'll connect you with the best match.
- FanNation FanNation FanNation
- SI.COM SI.COM SI.COM
- SI Swimsuit SI Swimsuit SI Swimsuit
- SI Sportsbook SI Sportsbook SI Sportsbook
- SI Tickets SI Tickets SI Tickets
- SI Showcase SI Showcase SI Showcase
- SI Resorts SI Resorts SI Resorts
- NEWSLETTER NEWSLETTER NEWSLETTER

© Matt Pendleton-USA TODAY Sports
The LSU Football Depth Chart: Rotations Emerging During Final Week of Spring Camp
The Tigers have their rotations cemented as Saturday's Spring Game nears, wide receiver room flaunts an embarrassment of riches.
- Author: Zack Nagy
In this story:
Brian Kelly and Co. will hold a walkthrough on Thursday morning as they put the final preparations in for Saturday's Spring Game in Tiger Stadium at 1 p.m. CT.
The Bayou Bengals have worked through weeks of camp with rotations emerging in a big way over the last few practices.
Offensively, it'll be a new-look scheme with redshirt junior Garrett Nussmeier lining up under center. After the departure of Heisman-winning signal-caller Jayden Daniels and a pair of projected first round wide receivers in Malik Nabers and Brian Thomas Jr, there will be significant intrigue into how this unit looks this fall.
On Saturday, Tiger fans will get a glimpse into the future of the group.
"The big thing coming into this offseason was developing our identity as an offense and really trying to start that from inside out," offensive coordinator Joe Sloan said. "Everything's going to start from inside out from the offensive line out to the perimeter. We want to be known as a physical football team that’s explosive on the perimeter."
When it comes to the other side of the ball, Kelly assembled an all-star staff headlined by cornerbacks coach Corey Raymond and defensive line coach Bo Davis. The overseer of all will be defensive coordinator Blake Baker as he also makes his return to Baton Rouge.
Now, it's full steam ahead to Saturday's Spring Game with starters and backup rotations coming to light over the last few weeks of camp.
LSU will spend the rest of the offseason fine-tuning the little things, but here is a projected depth chart before Saturday:
The Quarterbacks
Starter: Garrett Nussmeier (R-Jr.)
Backups: AJ Swann (Jr.) or Rickie Collins (R-Fr.)
It's Nussmeier's time to shine in Baton Rouge with backups Swann and Collins battling it out this offseason for QB2 duties. Along with the trio of signal-callers, we'll see early-enrollee Colin Hurley take a few snaps on Saturday.
The Running Backs
Starter: Josh Williams (Gr.)
Backup: Kaleb Jackson (Soph.)
Josh Williams has handled first team duties for the LSU offense with sophomore back Kaleb Jackson sliding in and earning starting reps as well. LSU will add four-star, Top 10 back Caden Durham this summer as well as hope to get Trey Holly back in the mix as he handles off-the-field issues.
The Wide Receivers
Starters: Kyren Lack (Sr.), Chris Hilton Jr. (R-Jr.) and Aaron Anderson (R-Soph.)
Backups/Rotation: CJ Daniels (Gr.), Zavion Thomas (Jr.), Kyle Parker (R-Fr.) and Shelton Sampson (R-Fr.)
Kyren Lacy has taken over as LSU's WR1 this offseason with Chris Hilton also asserting himself as a starter during camp. The pair of electrifying wideouts appear to have cemented starting duties, but the third receiver slot is up for grabs with Anderson, Daniels, Thomas and Parker all battling it out. Regardless, LSU will utilize a five or six man rotation this season with significant weapons outside. Saturday will give a look into the embarrassment of riches wide receivers coach Cortez Hankton has in his arsenal.
The Tight Ends
Starter : Mason Taylor (Jr.)
Backups: Mac Markway (Soph.) and Ka’Morreun Pimpton (Soph.)
Taylor will be involved more this season with Joe Sloan taking over as the playcaller for the Tigers. He's spoken highly of his prized tight end, calling him one of the program's best players, and will utilize his skill set in a variety of ways.
As for Markway and Pimpton, the pair of sophomores have taken strides in the right direction and look to take on a bigger role this season. Markway has looked exceptionally sharp during spring camp and appears to have locked up that TE2 role.
The Offensive Line
Starters: Will Campbell (Jr.), Garrett Dellinger (Sr.), DJ Chester (R-Fr.), Miles Frazier (Sr.), Emery Jones (Jr.)
Backups: Tyree Adams (R-Fr.), Paul Mubenga (R-Fr.), Coen Echols (Fr.), Christian Stamps (R-Fr.), Bo Bordelon (R-Soph.)
LSU returns four starters from a season ago up front with DJ Chester being the lone new face in the mix. Campbell and Jones will look to become the top tackle duo in college football while Chester looks to prove he can hang with the top guns. Through camp, it's been rave reviews for Chester while he "handles himself like a pro both on and off of the field."
Defensive Tackle
Starters: Jacobian Guillory (R-Sr.), Jalen Lee (R-Sr.) or Kimo Makane'ole (R-Jr.)
Backups: Kimo Makane'ole (R-Jr.) and Shone Washington (R-Soph.)
The depth at defensive tackle is razor thin with a quartet of Tigers battling it out this offseason. A piece to monitor will be Makane'ole, who switched from offense to defense this offseason, but nonetheless, reinforcements will be on this way this offseason via the Transfer Portal and five-star DL Dominick McKinley.
Defensive End
Starters: Sai'vion Jones (Sr.) and Bradyn Swinson (Sr.)
Backups: Paris Shand (Sr.), Da’Shawn Womack (Soph.)
LSU will execute a new scheme under defensive coordinator Blake Baker with both Swinson and Jones benefitting from a two defensive end look. Along with the pair of upperclassmen, expect sophomore Dashawn Womack to be used significantly this season. The former five-star recruit has taken strides in the right direction with those within the program impressed with what he provides.
The Linebackers
Starters: Greg Penn III (Sr.), Harold Perkins (Jr.)
Backups: Whit Weeks (Soph.), West Weeks (Sr.)
Harold Perkins and Greg Penn III have looked the part with defensive coordinator Blake Baker working alongside them routinely. It's also important to mention the Weeks Bros. handling business on the practice field this spring. It'll be exciting to watch the second-level this season, especially with Perkins back in the inside linebacker spot. Saturday will give a better look into how Perkins will be utilized this fall.
Starter: Major Burns (Sr.)
Backups : Kylin Jackson (R-Fr.) and Ryan Yaites (Soph.)
Burns will now play a hybrid safety/linebacker role in defensive coordinator Blake Bakers scheme and has shined during Spring Camp. Those within the program feel this will be his sweet spot and it's brought intrigue into the fall. Behind him will be youngsters Kylin Jackson and Ryan Yaites.
The Cornerbacks
Starters: Ashton Stamps (Soph.), PJ Woodland (Fr.)
Backups: Javien Toviano (Soph.), JK Johnson (R-Jr.)
PJ Woodland has asserted himself a starter as spring camp comes to a close. He's spent the last two weeks running with the first team on the opposite side of Ashton Stamps and has the entire program buzzing about what could be this fall. The backups will be Javien Toviano and JK Johnson, but they'll be given an equal opportunity to work with the first team on Saturday.
The Safeties
Starters: Jardin Gilbert (R-Jr.), Sage Ryan (R-Jr.)
Backups: Dashawn McBryde (Fr.), Jordan Allen (R-Soph.)
The rise of Sage Ryan has been a major takeaway during Spring Camp as he continues making his presence felt during both 7v7 drills and 11v11. Just two and a half weeks ago, Ryan had a three-interception day and he hasn't slowed down. Now, it's about seeing him in an in-game situation in Tiger Stadium.
Another bright spot this offseason has been true freshman Dashawn McBryde. The youngster will be hard to keep off of the field this season with those within the program raving about what he provides the purple and gold.
Special Teams
Kicker: Damian Ramos (R-Jr.)
Punter: Peyton Todd (R-Jr.)
Long Snapper: Slade Roy (Sr.)
Return Specialists: Zavion Thomas (Jr.) and Kyle Parker (R-Fr.)
Follow Zack Nagy on Twitter: @znagy20 and LSU Country: @LSUCountry_FN for all coverage surrounding the LSU program.
Latest Tigers News

LSU QB Garrett Nussmeier Opens Up On 2024 Goals, New-Look Program

LSU Football's 2025 SEC Opponents Revealed

LSU Football: WR Kyle Parker Turning Heads During Spring Practices

LSU Set to Host Five-Star Florida State Commit for Visit to Baton Rouge

LSU Spring Football: The Practice Report From Wednesday
- Ebooks & Courses
- Practice Tests
How To Write an IELTS Pie Chart Essay
Using this 5 steps process to plan and write IELTS pie chart essays will help you to achieve high marks in Task 1:
1) Analyse the question
2) Identify the main features
3) Write an introduction
4) Write an overview
5) Write the details paragraphs
In this lesson, we’re going to work thorough each step as we answer a practice question and I want to start by highlighting the importance of steps 1 and 2. It is essential that you learn how to do this planning stage properly if you hope to write a high-scoring essay.
Before we begin, here’s a model essay structure that you can use as a guideline for all IELTS Academic Task 1 questions.
Ideally, your essay should have 4 paragraphs:
Paragraph 1 – Introduction
Paragraph 2 – Overview
Paragraph 3 – 1 st main feature
Paragraph 4 – 2 nd main feature
We now have everything we need to begin planning and writing our IELTS pie chart essay.
Here’s our practice question:
The chart below shows the reasons why people travel to work by bicycle or by car.
Summarise the information by selecting and reporting the main features, and make comparisons where relevant.
Write at least 150 words.
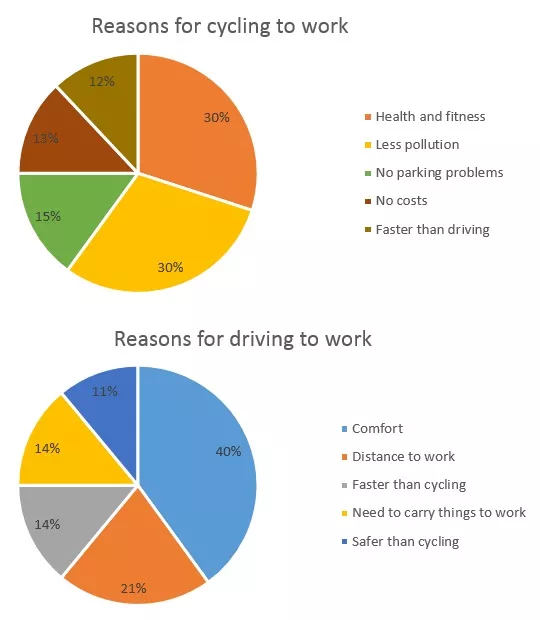
Source: Official website IELTS Essentials
Step 1 – Analyse the question
The format of every Academic Task 1 question is the same. Here is our practice question again with the words that will be included in all questions highlighted .
The chart below shows the reasons why people travel to work by bicycle or by car.
Every question consists of:
- Sentence 1 – A brief description of the graphic
- Sentence 2 – The instructions
- The graphic – chart, graph, table, etc.
Sentence 2 tells you what you have to do.
You must do 3 things:
1. Select the main features.
2. Write about the main features.
3. Compare the main features.
All three tasks refer to the ‘ main features ’ of the graphic. You do not have to write about everything. Just pick out 2 or 3 key features and you’ll have plenty to write about.
Step 2 – Identify the Main Features
The graphic in IELTS pie chart questions should not be difficult to interpret. Each question has been created to test your language skills, not your mathematics ability.
Pie charts always show percentages or proportions. Apart from that, they are essentially the same as bar charts and line graphs in that they are a way of presenting data visually.
All you are looking for are the main features. These will usually be the easiest things to spot. There will be lots of information in the graphic to help you identify them.
Here are some useful questions to ask?
- What are the units of measurements?
- What are the time periods?
- What can you learn from the title and any labels?
- What is the most obvious trend?
- Are there any notable similarities?
(I give more detail on how to use these questions, plus downloadable checklists for identifying the main features of all 7 different types of IELTS Academic Writing Task 1 questions, in the lesson on How To Understand & Analyse Task 1 Questions .)
Pie charts generally have titles and labels or sometimes a key instead of segment labels as in our practice question. The key explains what each segment of the pie chart represents.
So, what information is contained in the two pie charts?
Here's our IELTS pie chart again.

They show two different methods of travelling to work and illustrate the reason why people choose these types of transport.
What main features stand out?
There are 2 main features in these IELTS pie charts:
Main feature 1: The largest proportion of people who cycle do so for health and environmental reasons.
Main feature 2: The highest percentage of people who drive do so because it’s comfortable.
Another notable feature is that the only reason included in both pie charts – that the method is faster – shares almost the same proportion for both modes of transport.
We may not have space to cover this final feature but we’ll note it just in case we need it to make up the words.
The key features you select will be the starting point for your essay. You will then go on to add more detail. However, with just 20 minutes allowed for Task 1, and a requirement of only 150 words, you won't be able to include many details.
We’re now ready to begin writing our essay. Here’s a reminder of the 4 part structure we’re going to use.
Step 3 – Write an Introduction
In the introduction, you should simply paraphrase the question, that is, say the same thing in a different way. You can do this by using synonyms and changing the sentence structure. For example:
Introduction (Paragraph 1):
The two pie charts display the key reasons why people choose to either cycle or drive to work by percentage.
This is all you need to do for the introduction.
Step 4 – Write an Overview (Paragraph 2)
In the second paragraph, you should report the main features you can see in the pie charts, giving only general information. The detail comes later in the essay. You should also make any clear comparisons you spot.
Here are the ones we picked out above. I’ve added the additional feature as it will fit well in the overview.
Main feature 3: For an almost equal proportion of people, their chosen method is the fastest.
Now form these ideas into two or three sentences with a total of around 40 words. State the information simply, using synonyms where possible. No elaborate vocabulary or grammar structures are required, just the appropriate words and correct verb tenses.
For example:
Overview (Paragraph 2):
The largest proportion of people who cycle, have made this choice for health and environmental reasons whilst the prime advantage of driving to work is considered to be the comfort of travelling by car. Notably, for an almost equal proportion of people, their chosen method is the fastest.
Step 5 – Write the 1st Detail Paragraph
Paragraphs 3 and 4 of your IELTS pie chart essay are where you include more detailed information about the data in the graphic. In paragraph 3, you should give evidence to support your first key feature. Don’t forget to make comparisons where relevant.
Here is our first main feature again:
Main feature 1: The largest proportion of people who cycle do so for health and environmental reasons.
And this is an example of what you could write:
Paragraph 3 :
T aken together, health and fitness and less pollution are reasons given by over half of all people who prefer travelling by bike. Each represents a 30% portion which is double the next most popular reason which is a lack of parking issues at 15%.
Step 6 – Write the 2nd Detail Paragraph
For the fourth and final paragraph, you do the same thing for your second key feature.
I’ve added the third main feature again as it will round off the essay well. In an exam situation, I would include it if I had time.
Here’s an example of what you could write:
Paragraph 4 :
A different set of concerns has affected the decision of those who choose to commute by car. Comfort is by far the most significant factor at 40% of people, but distance to work is a more important concern for just over a fifth of drivers. For 14% of people, a faster journey time is the key factor compared to a figure of 12% of cyclists who find their means of transport quicker.
I just want to say a quick word about verb tense in this sample essay. Since there is no time frame given in the question, you could use either the present simple tense or the past simple tense. I've used the present simple tense. Whichever tense you choose, remember to be consistent throughout your whole essay.
Here are the four paragraphs brought together to create our finished essay.
Finished IELTS Pie Chart Essay
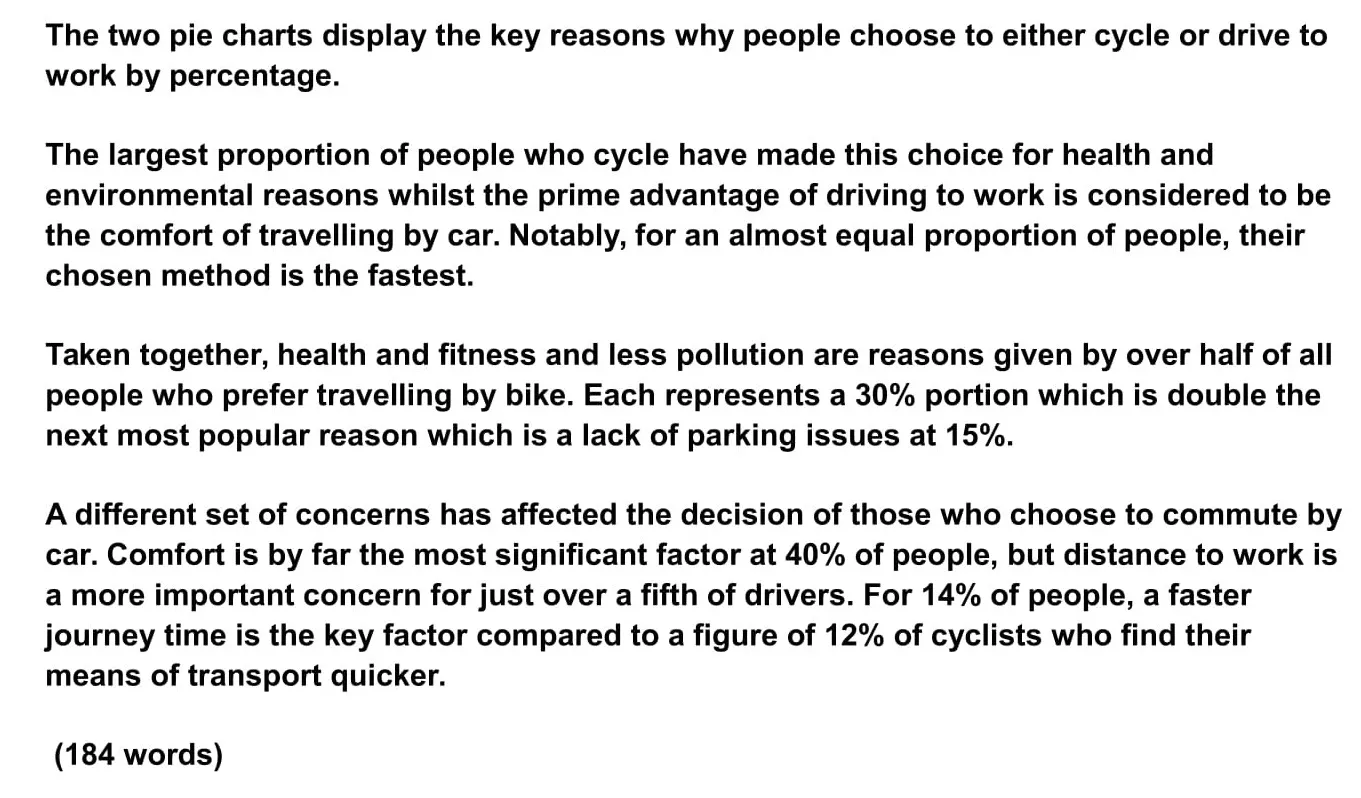
This sample IELTS pie chart essay is over the minimum word limit so you can see that you don’t have space to include very much detail at all. That’s why it is essential to select just a couple of main features to write about.
Now use what you’ve learnt in this lesson to practice answering other IELTS pie chart questions. Start slowly at first and keep practicing until you can plan and write a complete essay in around 20 minutes.
Want to watch and listen to this lesson on how to write an IELTS Pie Chart essay?
Click on this video.
Would you prefer to share this page with others by linking to it?
- Click on the HTML link code below.
- Copy and paste it, adding a note of your own, into your blog, a Web page, forums, a blog comment, your Facebook account, or anywhere that someone would find this page valuable.
Like this page?
Ielts academic writing task 1 – all lessons.
IELTS Academic Writing – A summary of the test including important facts, test format & assessment.
Academic Writing Task 1 – The format, the 7 question types & sample questions, assessment & marking criteria. All the key information you need to know.
Understanding Task 1 Questions – How to quickly and easily analyse and understand IELTS Writing Task 2 questions.
How To Plan a Task 1 Essay – Discover 3 reasons why you must plan, the 4 simple steps of essay planning and learn a simple 4 part essay structure.
Vocabulary for Task 1 Essays – Learn key vocabulary for a high-scoring essay. Word lists & a downloadable PDF.
Grammar for Task 1 Essays – Essential grammar for Task 1 Academic essays including, verb tenses, key sentence structures, articles & prepositions.
The 7 Question Types:
Click the links below for a step-by-step lesson on each type of Task 1 question.
- Table Chart
- Process Diagram
- Multiple Graphs
- IELTS Writing
- IELTS Pie Chart
- Back To Top
* New * Grammar For IELTS Ebooks
$9.99 each Full Set Just $ 23.97
Find Out More >>
IELTS Courses

Full details...

IELTS Writing Ebook
Discount Offer
$7 each Full Set Just $ 21

Find out more >>
Testimonials
“I am very excited to have found such fabulous and detailed content. I commend your good work.” Jose M.
“Thanks for the amazing videos. These are ‘to the point’, short videos, beautifully explained with practical examples." Adari J.
"Hi Jacky, I bought a listening book from you this morning. You know what? I’m 100% satisfied. It’s super helpful. If I’d had the chance to read this book 7 years ago, my job would be very different now." Loi H.
"Hi Jacky, I recently got my IELTS results and I was pleased to discover that I got an 8.5 score. I'm firmly convinced your website and your videos played a strategic role in my preparation. I was able to improve my writing skills thanks to the effective method you provide. I also only relied on your tips regarding the reading section and I was able to get a 9! Thank you very much." Giano
“After listening to your videos, I knew I had to ditch every other IELTS tutor I'd been listening to. Your explanations are clear and easy to understand. Anyways, I took the test a few weeks ago and my result came back: Speaking 7, listening 9, Reading 8.5 and Writing 7 with an average band score of 8. Thanks, IELTS Jacky." Laide Z.
Contact
About Me
Site Map
Privacy Policy
Disclaimer
IELTS changes lives.
Let's work together so it changes yours too.
Copyright © 2024 IELT Jacky
All Right Reserved
IELTS is a registered trademark of the University of Cambridge, the British Council, and IDP Education Australia. This site and its owners are not affiliated, approved or endorsed by the University of Cambridge ESOL, the British Council, and IDP Education Australia.
More From Forbes
A disappointing trump media stock (djt) analysis.
- Share to Facebook
- Share to Twitter
- Share to Linkedin
A reminder that risk accompanies return
The March and April SEC filings provide the information needed to analyze the Trump Media merger. Unfortunately for the new shareholders coming from Digital Acquisition, the result is disappointing.
What happened? Four negative developments
First , after an enthusiastic 2021-22 market environment, conditions turned negative in 2023. The delay decreased interest, so the merger actions slowed, and the Digital Acquisition stock stagnated.
Digital Acquisition stock chart through Trump Media merger
Second , Digital Acquisition expenses remained high, made worse by a misleading SEC filing that ended up costing an $18M settlement. That amount, along with the expenses, ate into the money that would transfer over to Trump Media in the case of a merger.
Third , Trump Media was running negative earnings, with moderate revenues and large expenses. As a result, they turned to private loans to keep the firm afloat, meaning the company's shareholder (equity) balance was getting more negative.
Fourth , there began a questionable strategy used by both Digital Acquisition and Trump Media management as they sought money. The idea was to raise cash by offering a conversion into new, bargain-priced shares of stock when/if the merger was completed. The result was the lenders received stock for repayment, not cash. Trump Media used convertible promissory notes, and Digital Acquisition used other convertible items.
Best High-Yield Savings Accounts Of 2024
Best 5% interest savings accounts of 2024, what is wrong with that.
That strategy undermines the value of all shareholders that bought the Digital Acquisition shares at full market value. Look at it this way:
Digital Acquisition was shrinking the per share assets behind the IPO shares. Management has a duty to protect shareholders, not to take advantage of them.
Trump Media took the strategy a step further. The merger was not complete, so they were offering conversion into something they did not own.
So, how big a deal are those convertible borrowings?
Very. It is visible in the March 25 8-K filing, on page C-7, under "Note 5 — Loss Per Share." Their table shows all the new shares coming together because of the merger:
All the sources of Trump Media shares
Now to the book value
Shareholders undoubtedly remember the Digital Acquisition IPO at $10 per share. And we know that money was in trust, earning interest. Perhaps forgotten is that there was a "founder" position that equaled a quarter of the offering at a near-zero cost. Therefore, spreading that $10 over all shares drops the per share book value to $8.
However, as discussed above, there have been sizable Digital Acquisition expenses, so the book value in the merger was $7.60.
Now to the bad news. Coming into the merger, Trump Media had negative book value. Worse, the number of original Trump Media shares was three times the number that came from Digital Acquisition. That pushed the per share book value down to $1.88. Include the other shares in the tables above, and the book value drops further.
The bottom line: Do not expect magic from the cash infusion
Trump Media has been struggling with low revenues compared to expenses. Moreover, the common stock is approaching the 200M shares shown in the tables above (up from the pre-merger 87M). Therefore, without a significant improvement in growth and revenues, it will be a challenge to maintain its high price.
- Editorial Standards
- Reprints & Permissions
Trump’s first — and maybe only — trial is still viewed with skepticism

Next week, a former president of the United States is for the first time scheduled to go on trial for criminal charges. Donald Trump has been charged with 34 counts of falsifying business records by a Manhattan grand jury — a case that is complicated and (probably relatedly) viewed with skepticism by a lot of Americans.
It also may end up being the only indictment Trump faces that goes to trial.
Sign up for the How to Read This Chart newsletter
It’s been the case for some time that, of those four indictments, the one in Manhattan is viewed by Americans broadly as the most dubious. Polling from the Associated Press, conducted by NORC, found that perceptions Trump had violated the law in the Manhattan case had declined throughout 2023, driven by increased Democratic skepticism.
That continues to be the case. In polling released this week by Ipsos (on behalf of Reuters), Americans were least likely to say that the Manhattan charges — unlike the federal charges in D.C. and Florida or the charges in Georgia — were very or somewhat serious. Only a little over a third of respondents indicated that they thought the Manhattan charges were very serious.
One likely reason for this is inadvertently revealed in the poll’s question: The Manhattan case, unlike, say, trying to overturn the 2020 election, is complicated .
Trump is accused of creating falsified business documents, for having payments to his then-attorney Michael Cohen recorded as a legal retainer. In reality, the money was meant to reimburse Cohen for having paid $130,000 to adult film actress Stormy Daniels, whose real name is Stephanie Clifford, which prosecutors say was to keep her from publicly revealing a sexual encounter she said she had with Trump years earlier. Cohen admitted to the payment and to making it to aid Trump’s campaign, a violation of campaign-finance laws. And since the alleged falsified records were in service of covering up another crime, the Manhattan charges are a felony.
There was another payment in the same period to Playboy model Karen McDougal. That one was covered by the parent company of the National Enquirer, on Trump’s behalf. But it is not part of the Manhattan charges, despite the Ipsos question’s wording.
The other obvious factor here is partisanship. Republicans are overwhelmingly less likely to describe the charges Trump faces as serious, regardless of which charge is at issue. Only a quarter of Republicans say the charges centered on trying to overturn the 2020 election are very serious.
What’s more, Republicans consistently told Ipsos that descriptions of the underlying crimes (at times inaccurate descriptions) were not particularly believable. Only a third of Republicans, for example, said it was very or somewhat believable that Trump illegally removed classified documents from the White House and took them to his Mar-a-Lago estate. Interestingly, the hush money payoffs — only one of which was ultimately paid by Trump — were most consistently described as believable.
Instead, Republicans were far more likely to view the entire effort to charge Trump as politically motivated.
How complicated are the Manhattan charges? On Wednesday, Trump attempted to portray them as somehow subverted by a statement Daniels released in early 2018 denying having a relationship with Trump — a statement that was the direct fruit of the coverup for which he paid the $130,000! It was the hush that earned the money, but many of his supporters took for granted that this statement was somehow important. (Daniels later retracted it. )
Part of this may stem from something revealed earlier this year in polling conducted by YouGov : Many Republicans simply aren’t familiar with the details of the indictments and settlements centered on Trump. (That poll included intentionally false claims about Trump’s actions to gauge how often people were simply responding based on their views of Trump.)
This is undoubtedly related to the disparagement of the indictments within the right-wing media bubble and to a disinterest in learning about the charges among Trump supporters.
That said, though, there’s also another factor worth considering: A healthy chunk of Trump’s base believes he has committed serious federal crimes — and supports him for president anyway.
Most Republicans simply think that all of this is political, a point of view that Trump has promoted ceaselessly since even before he took office. They think Trump’s opponents are trying to block his path to the presidency or, that they want to punish him. Many appear to believe that Trump’s actions are unexceptional, a belief that special counsel Jack Smith, originator of two of the Trump indictments, explicitly rejected in a filing this week.
Subscribe to The Trump Trials, our email newsletter on Donald Trump's four criminal cases
That the first criminal case in which Trump will participate is the one that is viewed as less than very serious by most Americans may not disabuse them of that perception. Or, perhaps, something else will happen: Americans will better understand what Trump did and why, and their views of his actions will shift.
If they learn about the trial at all, that is.


IMAGES
VIDEO
COMMENTS
Introduce the Graph. You need to begin with one or two sentences that state what the IELTS writing task 1 shows. To do this, paraphrase the title of the graph, making sure you put in a time frame if there is one. Here is an example for the above line graph: The line graph compares the fast food consumption of teenagers in Australia between 1975 ...
IELTS Line Graph Essay. Here is the 5 steps process I recommend for planning and writing IELTS line graph essays: 1) Analyse the question. 2) Identify the main features. 3) Write an introduction. 4) Write an overview. 5) Write the details paragraphs. I'm going to take you through the whole process step-by-step as we work on a practice ...
How are graphs described in IELTS? Let's walk through the best vocabulary for the task, step by step. 1. Start With Introduction Phrases. Often ESL students start their essay with 'The graph shows…'. While this is fine, the verb 'shows' could be replaced by a more exciting and high-level vocabulary word.Here are four different prompts to start your essay:
A line graph contains both an x-axis (the horizontal base) and a y-axis (the vertical spine). The x-axis is generally used to mark the passage of time - in the example above, the four quarters of ...
The process for planning and writing IELTS multiple graph essays is the same as for any other Academic Task 1 essay. Here is the 5 steps process I recommend that you use: 1) Analyse the question. 2) Identify the main features. 3) Write an introduction. 4) Write an overview. 5) Write the details paragraphs.
IELTS Writing Task 1 - Bar Chart Essay Example 1. IELTS Writing Task 1 Academic bar chart essay example that is a band score 8. The question is: The chart below gives information about Someland's main exports in 2005, 2015, and future projections for 2025. Take a look at the sample answer. View high band score examples of IELTS writing task ...
Static Graph Introduction / Summary. The introduction paragraph in Task 1 only needs to be 1 or 2 sentences. Like all IELTS Writing Task 1 essays, your introduction should present the main purpose of the graph to the reader in your own words. This means paraphrasing the official IELTS diagram description if you can.
Graph description is related to the section of findings, where researchers often present their data in graphs, or tables, or charts and provide a description to highlight the major trends. Graph description is a basic and important skill in academic writing. Steps in writing a graph description Structure of graph description.
To make the best use of your time it's important to write with a clear structure, focus on the most important trend or trends, choose appropriate vocabulary and avoid common mistakes. In this tutorial, we have a band range 6.5 / 7 academic task 1 IELTS line graph example essay graded by an ex-IELTS examiner (on our team of essay correctors).
Ready for a high-level bar chart task 1 answer? Let's begin with the analysis of this bar chart, and pick out the information that is relevant to our structure. See the model answer of a bar chart below. Sample Answer Bar Graph Essay. The bar chart shows the caloric intake of UK males in three distinct age groups of 0-24, 25-49, and over 50 ...
There are 5 steps to writing a good IELTS bar chart essay: 1) Analyse the question. 2) Identify the main features. 3) Write an introduction. 4) Write an overview. 5) Write the details paragraphs. Use this simple planning process as you practice writing IELTS bar chart essays and you'll have no problem remembering it in the exam.
The graph below shows how people buy music. Summarise the information by selecting and reporting the main features, and make comparisons where relevant. The graph illustrates trends in music buying habits between 2011 and 2018. It presents three different methods: streaming, downloading and buying CDs. Overall, both downloads and physical sales ...
significant exceptions. anything else that really stands out. There are 3 main features in this graph. 1) It takes over 26 years for a Vietnamese person to buy a car. 2) Vietnam has the second highest average costs but the second lowest wages. 3) Cost of a car in Singapore is nearly 3 times the next most expensive.
Recent IELTS Graph 20: The table below shows the worldwide market share of the notebook computer market for manufacturers in the years 2006, 2007 and 2014. Summarise the information by selecting and reporting the main features and make comparisons where relevant. Answer: The table gives information about the percentages of international market shares of different notebook computer brands in ...
Describing Graphs. This blog offers two great lessons on describing, analysing and evaluating graphs / charts / tables. The first lesson begins with naming different graph / chart types and describing a range of different lines (peak, plummet, etc..). It finishes with a fun activity where students describe and plot the lines on four graphs.
In the IELTS Writing Task 1, you can be asked to describe a bar graph. You will need to describe the chart within 150 words. It is recommended to complete the task within 20 minutes. Structure of Bar Graph Essay. Walking by the right structure of answering the bar graph question improves your chances of scoring well.
Take a look at the IELTS Writing Task 1 Academic essay example below >>. *This chart question and answer were provided by a student. IELTS Achieve did not design this bar chart question*. The bar chart describes comparative statistics on the number of products exported by Someland in 2005 and 2015 and its projected exports for 2025.
However, analytical essays differ from other essays because the writer must go further. They require the writer to interpret and analyze a given text or information using evidence to support their central idea or thesis statement. This analysis takes place in analytical paragraphs, or body paragraphs, if you are writing an analytical essay.
A rhetorical analysis is a type of essay that looks at a text in terms of rhetoric. This means it is less concerned with what the author is saying than with how they say it: their goals, techniques, and appeals to the audience. A rhetorical analysis is structured similarly to other essays: an introduction presenting the thesis, a body analyzing ...
Table of contents. Step 1: Reading the text and identifying literary devices. Step 2: Coming up with a thesis. Step 3: Writing a title and introduction. Step 4: Writing the body of the essay. Step 5: Writing a conclusion. Other interesting articles.
Bar Graph Analysis. Bar graphs best illustrate results that are gathered at one given time and are independent of each other. Results of surveys, then, are best captured in bar graphs. The bar graph below was used by Soraya J. NetoAlvarez to summarize the chances of projects of different sizes - as expressed in terms of total project costs ...
EUR/USD analysis: the ECB is moving closer to cutting rates while the Fed's timeline lengthens. This is bearish for the EUR/USD forecast. Today, the UoM surveys will come out and we have a few Fed speakers too. EUR/USD technical analysis points lower, possibly a drop to 1.05 handle.
There's a line from Fox News host Maria Bartiromo's show on Sunday that has stuck with me. Referring to an opinion piece in the Wall Street Journal, she asked one of the new co-chairs of the ...
Subscribe to How to Read This Chart, a weekly dive into the data behind the news.Each Saturday, national columnist Philip Bump makes and breaks down charts explaining the latest in economics, pop ...
Brian Kelly and Co. will hold a walkthrough on Thursday morning as they put the final preparations in for Saturday's Spring Game in Tiger Stadium at 1 p.m. CT. The Bayou Bengals have worked ...
IELTS Pie Chart Essay. Using this 5 steps process to plan and write IELTS pie chart essays will help you to achieve high marks in Task 1: 1) Analyse the question. 2) Identify the main features. 3) Write an introduction. 4) Write an overview. 5) Write the details paragraphs.
An analysis of that data offers a picture — albeit an incomplete one — of the influx and outflow of state residents by party. There are two caveats that are worth keeping in mind.
What happened? Four negative developments. First, after an enthusiastic 2021-22 market environment, conditions turned negative in 2023.The delay decreased interest, so the merger actions slowed ...
COMING SOON. TUESDAY, APRIL 16, 9:00 AM ET: Press Conference The chapter will be available for download on this page on April 16. Live Event: Pierre-Olivier Gourinchas, Chief Economist, and Director, IMF Research Department; Petya Koeva-Brooks, Deputy Director, IMF Research Department; Daniel Leigh, Division Chief, IMF Research Department; Moderator: Jose De Haro, Communications Officer, IMF
Next week, a former president of the United States is for the first time scheduled to go on trial for criminal charges. Donald Trump has been charged with 34 counts of falsifying business records ...