- IELTS Scores
- Life Skills Test
- Find a Test Centre
- Alternatives to IELTS
- Find Student Housing
- General Training
- Academic Word List
- Topic Vocabulary
- Collocation
- Phrasal Verbs
- Writing eBooks
- Reading eBook
- All eBooks & Courses
- Sample Graphs

IELTS Writing Task 1 Samples
Here you will find IELTS Writing Task 1 Samples for a variety of common tasks that appear in the writing exam.
The model answers all have tips and strategies for how you may approach the question and comments on the sample answer.
It's a great way to help you to prepare for the test.
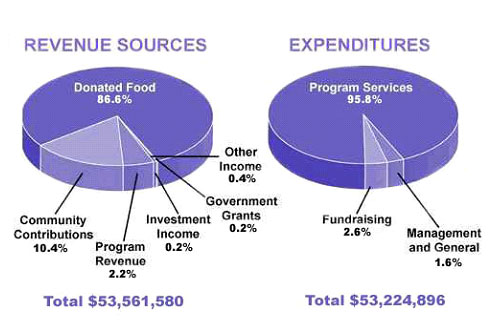
The amount of money that a children's charity located in the USA spent and received in one year, 2016.
Model Answer >>>
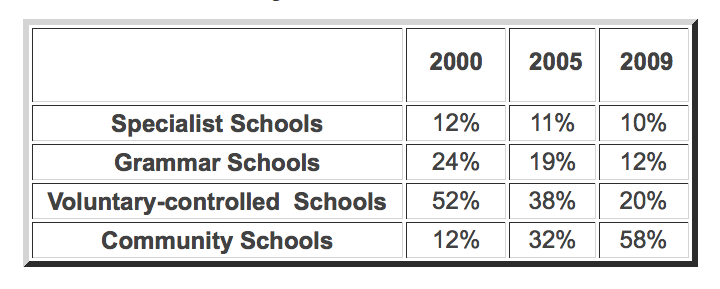
The Proportions of Pupils Attending Four Secondary School Types Between Between 2000 and 2009.
The city of Brandfield. City planners have decided to build a new shopping mall for the area, and two sites, S1 and S2 have been proposed.
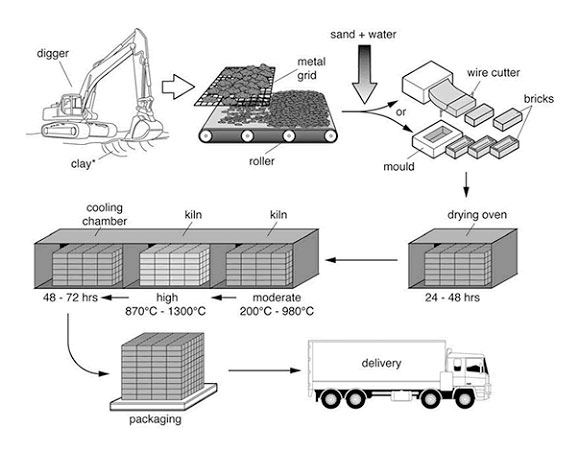
Process Diagram
The process that is used to manufacture bricks for the building industry.
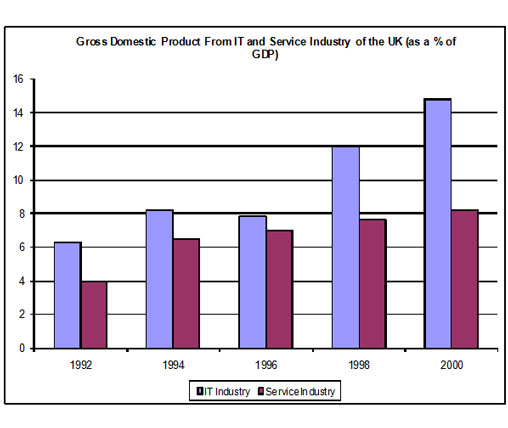
The components of GDP in the UK from 1992 to 2000.
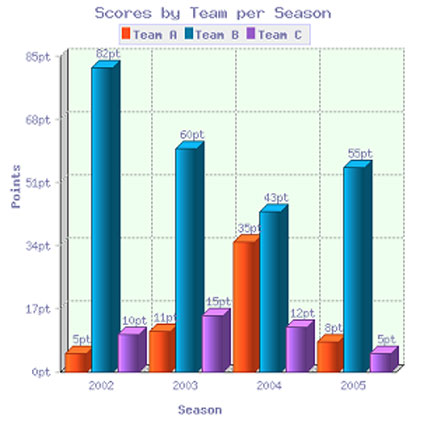
The scores of teams A, B and C over four different seasons.
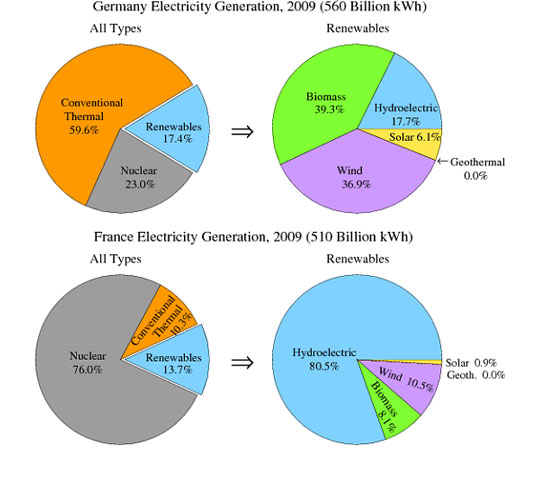
The electricity generated in Germany and France from all sources and renewables in the year 2009.
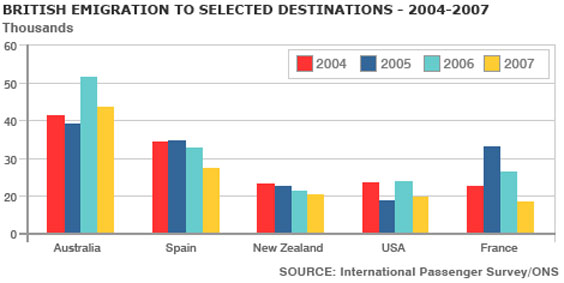
British Emigration to selected destinations between 2004 and 2007.
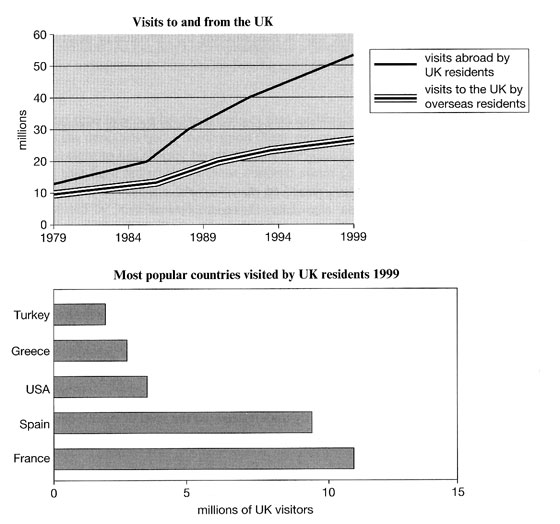
Line and Bar Chart
Visits to and from the UK from 1979 to 1999, and the most popular countries visited by UK residents in 1999.
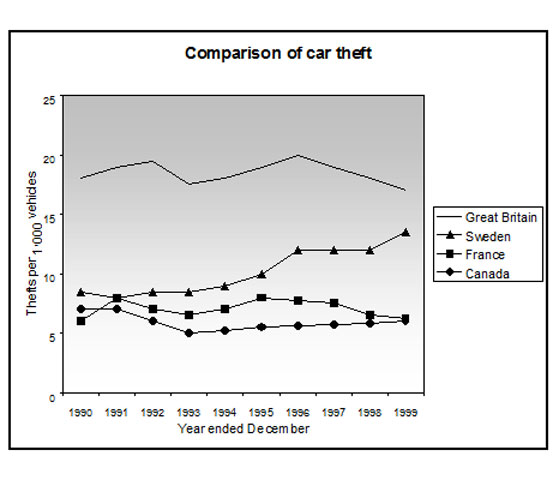
Thefts per thousand vehicles in four countries between 1990 and 1999.
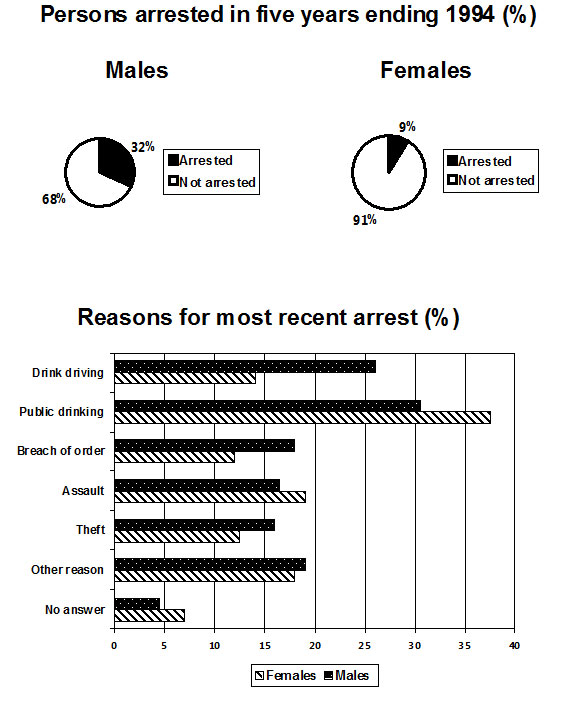
Pie and Bar Chart
The percentage of persons arrested in the five years ending 1994 and the most recent reasons for arrest.
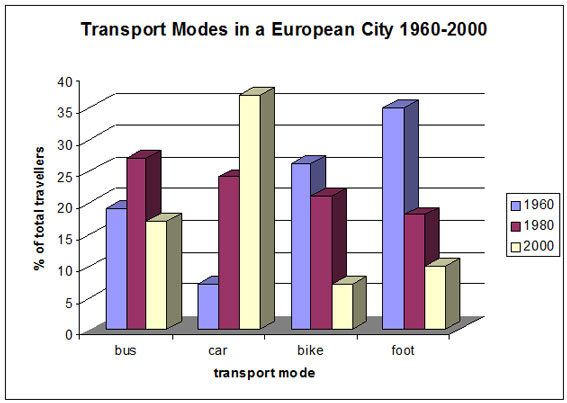
The different modes of transport used to travel to and from work in one European city in 1960, 1980 and 2000.
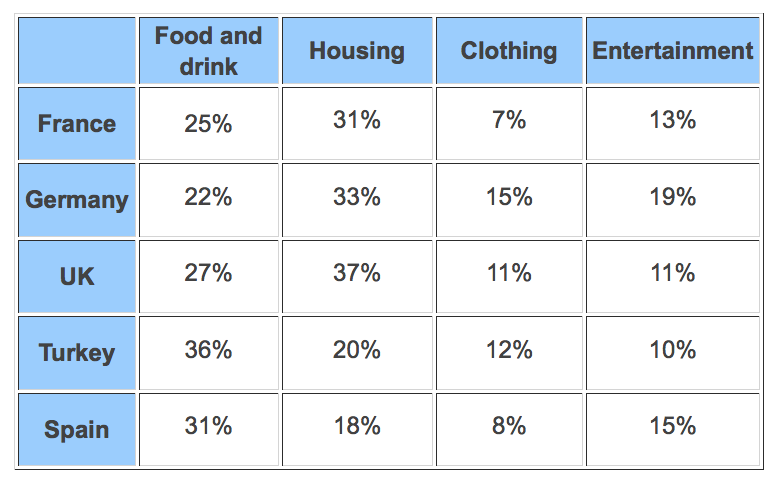
The proportion of monthly household income five European countries spend on food and drink, housing, clothing and entertainment.
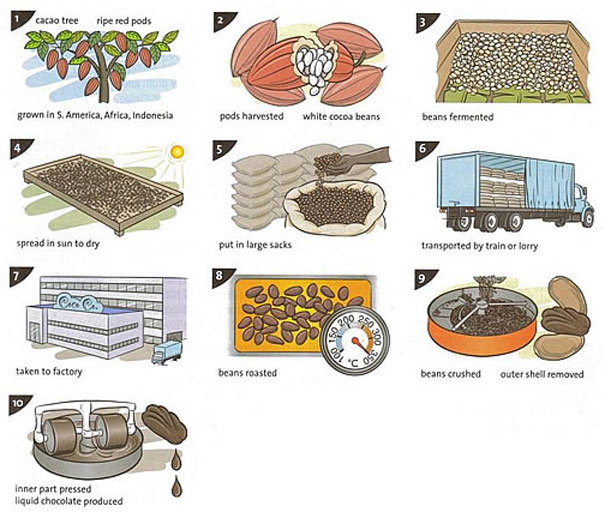
How chocolate is produced.
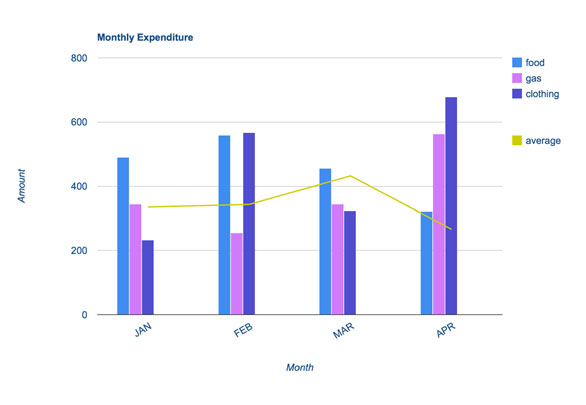
The monthly spending in dollars of a family in the USA on three items in 2010.
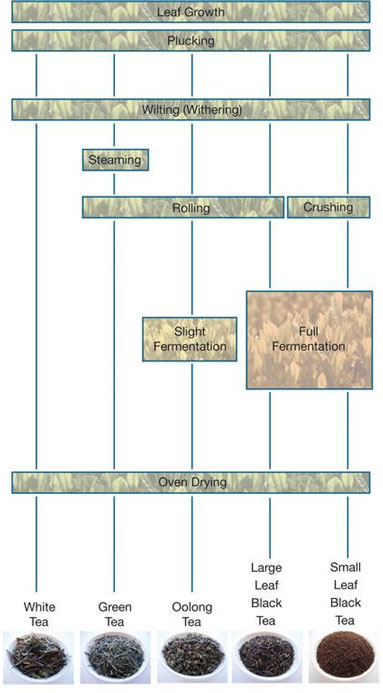
How tea leaves are processed into five tea types.
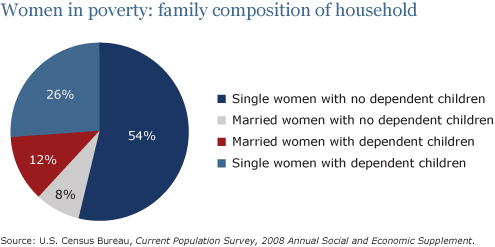
Pie and Bar Chart
The percentage of women in poverty and the poverty rates by sex and age in the United States in 2008.
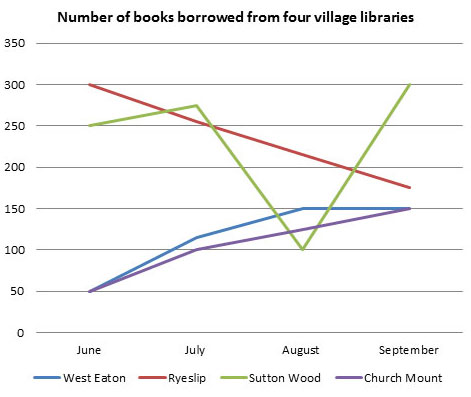
Line and Pie Chart
The number of books that were borrowed in four different months in 2014 from four village libraries, and the pie chart shows the percentage of books, by type, that were borrowed over this time.
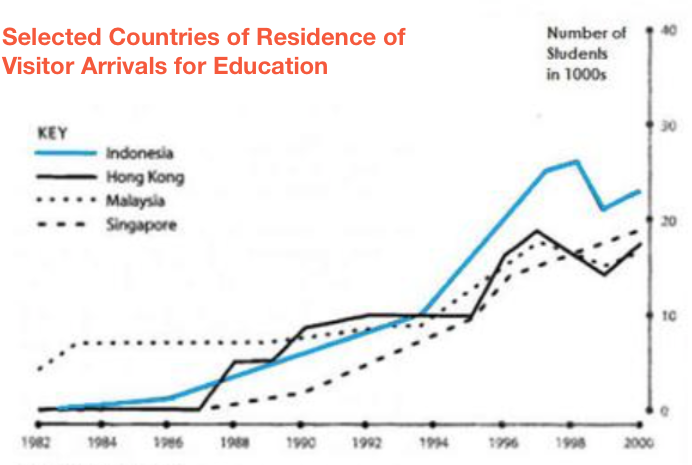
Four countries of residence of overseas students in Australia
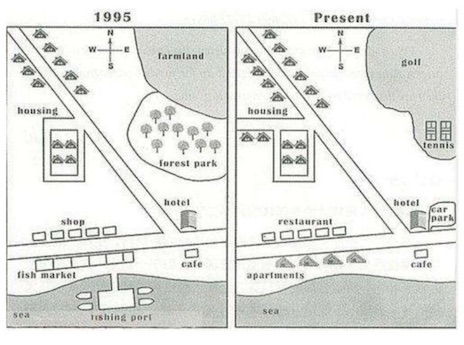
Development of the village of Ryemouth between 1995 and present.
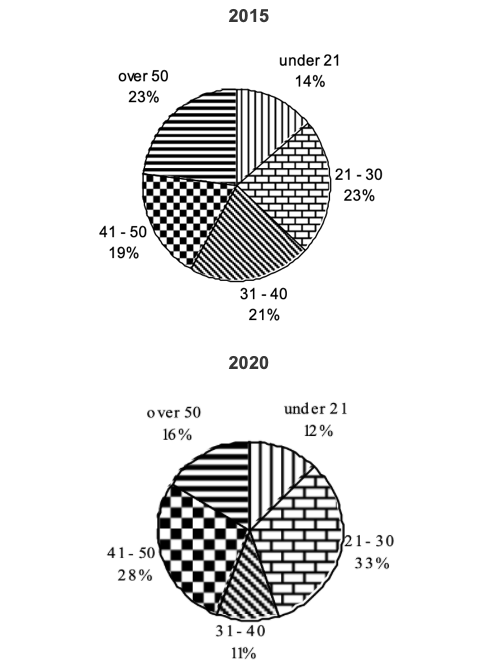
Public Sector Employment in 2015 and 2020.
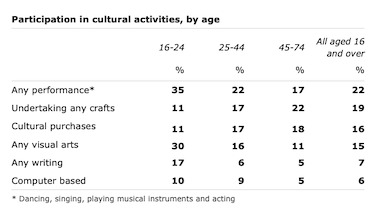
Cultural Activities of Differing Age Groups
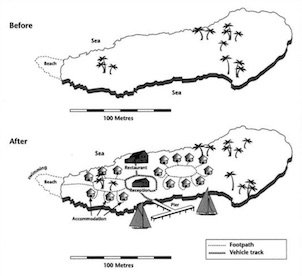
Construction of Tourist Facilities on an island.
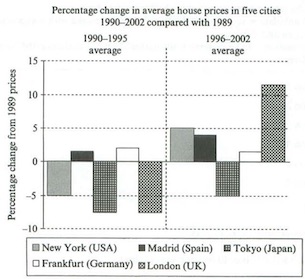
Average House Price Comparison.
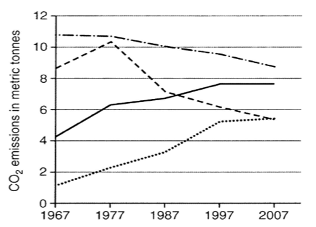
Average carbon dioxide (Co2) emissions per person
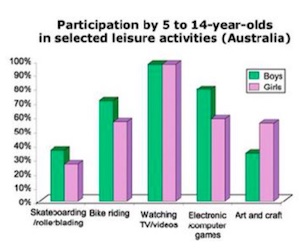
Leisure Activities amongst Australian children.
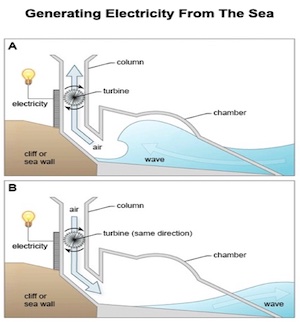
Structure used to generate electricity from wave power.
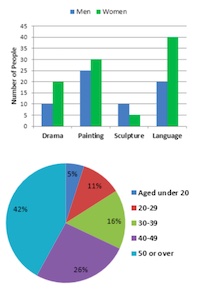
Bar & Pie Chart
Men and women attending various evening courses
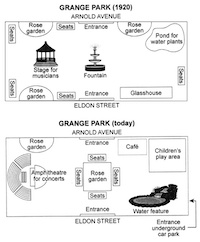
Changes to Grange Park.
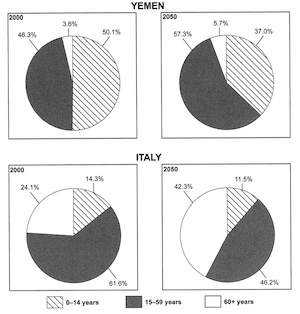
Populations in Yemen and Italy.
Student Sample Graphs
You can also view graphs that have been written by students in the forums:
- Student Graphs
Any comments or questions about this page or about IELTS? Post them here. Your email will not be published or shared.
Before you go...
Check out the ielts buddy band 7+ ebooks & courses.
Would you prefer to share this page with others by linking to it?
- Click on the HTML link code below.
- Copy and paste it, adding a note of your own, into your blog, a Web page, forums, a blog comment, your Facebook account, or anywhere that someone would find this page valuable.
Band 7+ eBooks
"I think these eBooks are FANTASTIC!!! I know that's not academic language, but it's the truth!"
Linda, from Italy, Scored Band 7.5

IELTS Modules:
Other resources:.
- All Lessons
- Band Score Calculator
- Writing Feedback
- Speaking Feedback
- Teacher Resources
- Free Downloads
- Recent Essay Exam Questions
- Books for IELTS Prep
- Student Housing
- Useful Links

Recent Articles
Alternatives to the IELTS Exam
Mar 22, 24 12:32 PM
Common Questions about the IELTS Speaking Test
Mar 09, 24 05:28 AM
IELTS Computer Delivered Practice Tests Plus Band Score
Mar 01, 24 02:38 AM

Important pages
IELTS Writing IELTS Speaking IELTS Listening IELTS Reading All Lessons Vocabulary Academic Task 1 Academic Task 2 Practice Tests
Connect with us
Copyright © 2022- IELTSbuddy All Rights Reserved
IELTS is a registered trademark of University of Cambridge, the British Council, and IDP Education Australia. This site and its owners are not affiliated, approved or endorsed by the University of Cambridge ESOL, the British Council, and IDP Education Australia.
IELTS Mentor "IELTS Preparation & Sample Answer"
- Skip to content
- Jump to main navigation and login
Nav view search
- IELTS Sample
Academic Writing Task 1 Sample
Ielts academic - graph writing:.
More Resources:
Useful Vocabularies and Phrases Preparation Tips IELTS Bar Graph | IELTS Line Graph | IELTS Table Chart | IELTS Flow Chart | IELTS Pie Chart |
20 Recent IELTS Graphs with answers
40 Difficult IELTS Graphs with answers
Page 1 of 17
IELTS Materials
- IELTS Bar Graph
- IELTS Line Graph
- IELTS Table Chart
- IELTS Flow Chart
- IELTS Pie Chart
- IELTS Letter Writing
- IELTS Essay
- Academic Reading
Useful Links
- IELTS Secrets
- Band Score Calculator
- Exam Specific Tips
- Useful Websites
- IELTS Preparation Tips
- Academic Reading Tips
- Academic Writing Tips
- GT Writing Tips
- Listening Tips
- Speaking Tips
- IELTS Grammar Review
- IELTS Vocabulary
- IELTS Cue Cards
- IELTS Life Skills
- Letter Types

- Privacy Policy
- Cookie Policy
- Copyright Notice
- HTML Sitemap
Welcome Guest!
- IELTS Listening
- IELTS Reading
- IELTS Writing
IELTS Writing Task 1
- IELTS Writing Task 2
- IELTS Speaking
- IELTS Speaking Part 1
- IELTS Speaking Part 2
- IELTS Speaking Part 3
- IELTS Practice Tests
- IELTS Listening Practice Tests
- IELTS Reading Practice Tests
- IELTS Writing Practice Tests
- IELTS Speaking Practice Tests
- All Courses
- IELTS Online Classes
- OET Online Classes
- PTE Online Classes
- CELPIP Online Classes
- Free Live Classes
- Australia PR
- Germany Job Seeker Visa
- Austria Job Seeker Visa
- Sweden Job Seeker Visa
- Study Abroad
- Student Testimonials
- Our Trainers
- IELTS Webinar
- Immigration Webinar
Share on Whatsapp
Share on Email
Share on Linkedin

Limited-Time Offer : Access a FREE 10-Day IELTS Study Plan!
“Master IELTS Writing Task 1 with this in-depth guide covering structure, question types, expert tips, practice resources with responses, and scoring criteria. “
If you're prepping for IELTS, you've probably realized that Writing Task 1 can be tricky to master. We mean, who enjoys describing graphs and charts, right? However, interpreting visual data and summarizing information accurately is a vital skill for higher education and global communication.
So how do you go about cracking IELTS Writing Task 1? Just follow this detailed guide. We'll explore the structure, different question types, killer tips, band descriptors, and more. We'll also walk you through sample responses so you can start practicing right away. Let's do this!
What is IELTS Writing Task 1?
The IELTS Writing Test has two tasks.
Firstly, IELTS Writing Task 1 Academic specifically checks your ability to analyze visuals like charts, tables, graphs, maps, process diagrams, and so on.
You'll get different types of visual prompts for Academic vs General Training:
IELTS Writing Task 1 Academic deals with visual data representation. The types of IELTS Writing Task 1 questions are:
- Line graphs
Process diagrams
Combination (mixed) charts.
IELTS General Writing Task 1 focuses on everyday functional writing. Question types include:
- Formal Letters
- Semi-Formal Letters
- Informal Letters
In both modules, you get 20 minutes to complete Task 1 in about 150 words. The key assessment criteria are accurate interpretation, clear description, overview of key features, and appropriate style and tone.
How do you structure your response?
We’ll look at both segments of Writing Task 1: Academic & General to answer this question.
IELTS Writing Task 1 Academic
IELTS Writing Task 1 Academic has a 3-step process. Here's a basic scaffolding for approaching any Task 1 question.
IELTS Writing Task 1 structure:
- Paraphrase the chart title, source, and date.
- Describe the main trend(s) in the data in 2-3 body paragraphs ordered logically.
- Close with an overview of the key relationships or patterns.
Let's see how this works with this IELTS Writing Task 1 question - sample bar chart response:
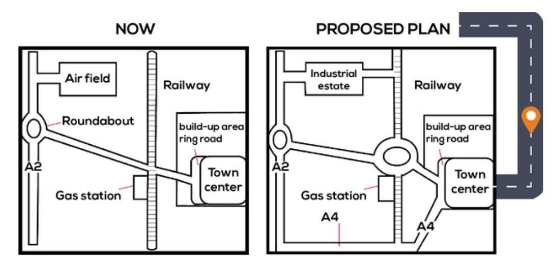
Sample Answer
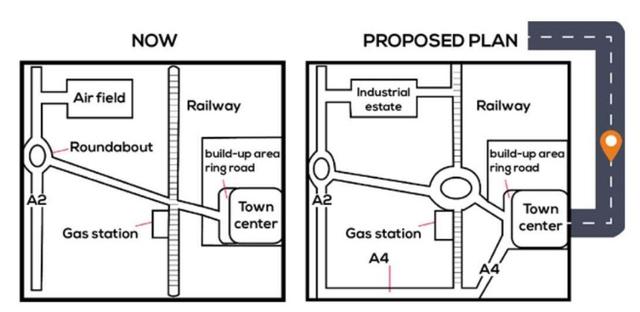
The map shows the layout of a town currently and a proposed future plan. Overall, the town appears to be becoming more industrialized and connected through additional roads, although much of the existing structures remain unchanged.
In the present-day map, there is an airfield in the northwest that connects to a long north-south road (A2). This road has a roundabout, with another road extending eastwards across a railway line to a gas station. The future plan moves the roundabout southwards slightly and replaces the airfield with an industrial estate, with a new eastward road to the railway line. The railway itself will also be interrupted by a new roundabout near the same gas station.
In the far east of town, there is currently a town center and built-up area around Ring Road, both of which stay the same in the future plan. The proposals add a new road (A4) from the town center along the south edge of town, connecting to A2 in the west. There will also be one more street from the town center allowing passage to the east and north of town.
IELTS Writing Task 1 General
Let’s do the same for IELTS Writing Task 1 General and write a formal letter with proper format and structure. Check the example given below:
Dear Sir/Madam,
I am writing to inform you that I missed my international flight on February 18th due to an issue at the airport. When I arrived to check in, there was an extremely long line at the ticket counter that stretched all the way outside the terminal doors. By the time I reached the counter, it was too late to check in for my flight.
Missing this flight has been very inconvenient, as I had important business meetings scheduled in the destination country. I had to scramble to rebook my travel arrangements and notify my colleagues of the change in plans. This caused unnecessary stress and disrupted my work schedule.
As this was due to circumstances beyond my control, I request that the airline refund the ticket cost or provide a voucher for a future flight. I would greatly appreciate your assistance with this matter. Please let me know if any documentation or additional information is needed from me.
Thank you for your consideration.
[Your name]
What are some key strategies for scoring higher in IELTS Writing Task 1?
We all want to get good grades but do we know - how to get it? Not really. To really ace Task 1, make sure you:
- Use synonyms - Don't just copy words from the prompt. Paraphrase with your own vocabulary.
- Include units of measurement - From the visual like millions, percentage, tons, dollars. This shows attention to detail.
- Highlight obvious contrasts or similarities - Between data trends to make logical comparisons.
- Use linking words - Like "while", "in addition", "on the other hand" to connect your ideas and show cohesion.
- Stick to plain English - Don't try to sound overly complex. Keep your language clear and concise.
Read: IELTS Band Score Calculation
Where can you find awesome practice resources for IELTS Writing Task 1?
You don’t need to go anywhere, we’ve got everything you need:
Below you’ll find some IELTS Writing Task 1 Academic topics followed by IELTS Writing Task 1 General topics. Use the resources as per your requirements.
IELTS Writing Task 1 Maps visually represent geographical data such as locations, distributions, or routes. They provide spatial context and allow for the analysis of patterns and trends across regions.
- Village of Stokeford in 1930 and 2010- Map
- Paradise Island Map – IELTS Academic Writing Task 1 Answers
- IELTS Academic Writing Task 1 Example 4 : Development of the village of Rye mouth – Map
- IELTS Academic Writing Task 1 Topic: The development of cutting tools in the stone age – Diagram
- IELTS Academic Writing Task 1 Example 3: Civic Centre – Map
Table Chart
Tables organize data into rows and columns, making it easy to display exact values.
They are useful for presenting numerical information in a structured format.
Below mentioned are a few examples of Table Chart Task 1. Solve them to get a better idea of Table Chart Task 1:
- Changes in Modes of Travel in England Between 1985 and 2000- IELTS Writing Task 1 (Table)
- IELTS Academic Writing Task 1: Main Reasons why Agricultural Land Becomes Less Productive
- Cinema Viewing Figures for Films by Country, in Millions- Table
- Number of Medals Won by the Top Ten Countries in the London 2012 Olympic Games- Table
- IELTS Academic Writing Task 1 Topic 12: Internet use in six categories by age group – Table
Bar Graph Task 1 displays data using rectangular bars with lengths proportional to the values represented. They are useful for comparing different categories or items side by side.
Below mentioned are a few examples of Bar Graph Task 1. Solve them to get a better idea of task 1 bar chart:
- IELTS Academic Writing Task 1 Topic : Annual pay for doctors and other workers – Bar chart
- Division of Household Tasks by Gender in Great Britain- Bar Graph
- IELTS Academic Writing Task 1 Topic 11: Different methods of waste disposal in four cities – Bar Chart
- Amount of Leisure Time Enjoyed by Men and Women of Different Employment Statuses- Bar Chart
- Number of Computer and Internet users in Different Arab Countries- Bar Graph
Line Graphs
Line Graph Task 1 depicts trends over time using data points connected by straight-line segments. They effectively show continuous data and allow the visualization of rises and falls.
Below mentioned are a few examples of Line Graph Task 1. Solve them to get a better idea of Line Graph Task 1:
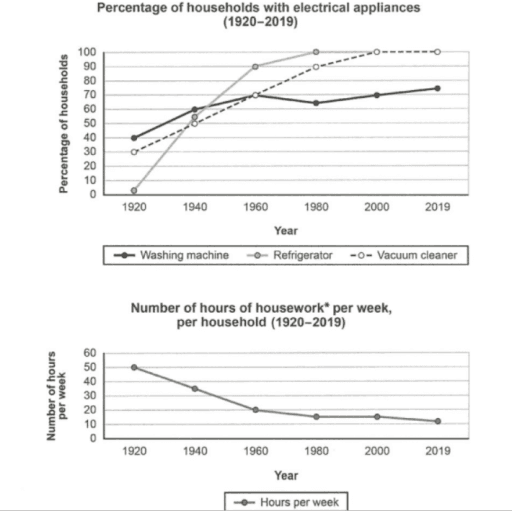
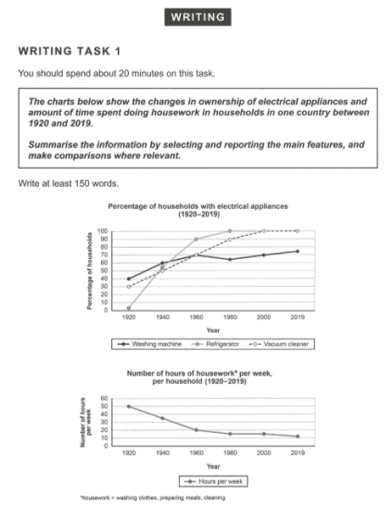
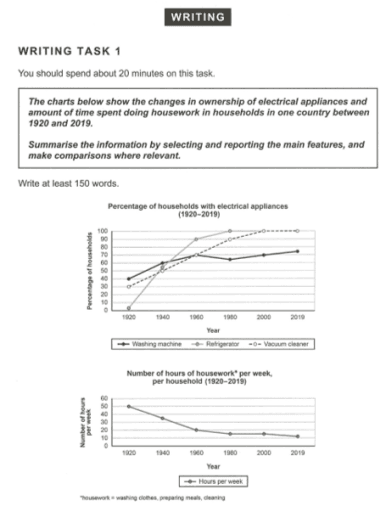
- The Changes In Ownership Of Electrical Appliances And Amount Of Time Spent Doing Housework In Households – IELTS Writing Task 1
- IELTS Academic Writing Task 1 Topic : The Percentage of Female Members of Parliament in 5 European Countries
- IELTS Writing Task 1 – The graph below shows different sources of air pollutants in the UK Sample Answers
- IELTS Academic Writing Task 1 Topic: Price changes for fresh fruits and vegetables – Line Graph
- Demand for Electricity in England- Line Graph and Pie Chart
Pie charts are circular charts divided into slices, with each slice representing a category. They illustrate the proportional size of categories in relation to a whole.
Below mentioned are a few examples of Pie Chart Task 1. Solve them to get a better idea of Pie Chart task 1:
- Average Household Expenditures in a Country in 1950 and 2010- Pie Chart
- Methods of Transportation for People Traveling to a University – Pie Chart
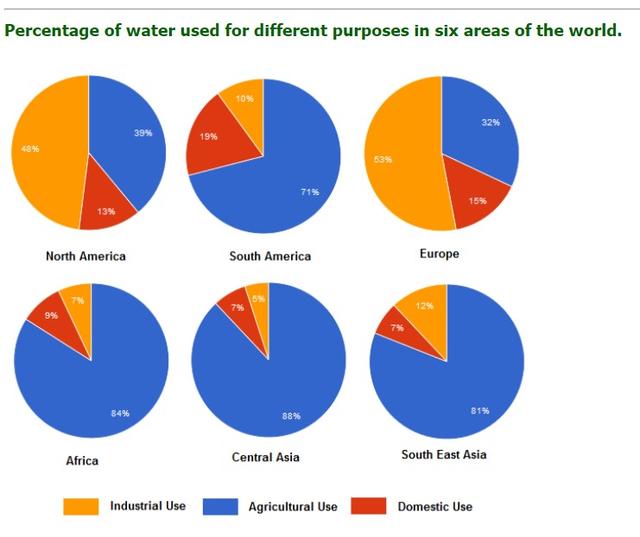
- Percentage of Water Used for Different Purposes in Six Areas of the World- Pie Chart
- Online shopping sales for retail sectors in Canada – IELTS Writing Task 1 Pie chart
Process diagrams use a sequence of steps or stages to illustrate a procedure or workflow. They clarify the order and relationships between different components of a process.
- IELTS Academic Writing Task 1 Topic 09 : Consequence of deforestation – Flow Chart
- Academic IELTS Writing Task 1 Recycling process of wasted glass bottles Sample Answers
- Water Cycle Diagram – IELTS Academic Writing Task 1 Answers
- IELTS Writing Task 1 Process Chart 2024 – Process Diagram with Sample Answers
Combined charts integrate two or more chart types, such as bars and lines, into a single visualization. They enable the comparison of different but related data sets within the same chart space .
- Percentage of Food Budget the Average Family Spent on Restaurant Meals- Pie Chart + Line Graph
- Amount of Money Per Week Spent on Fast Food in Britain- Bar Graph + Line Graph
- Water use Worldwide and Water Consumption- Line Graph and Table
Formal Letter
- Formal Letter to Change Hostel Room- IELTS Writing Task 1
- IELTS General Writing Task 1 – Sample Formal Letters
- You Have Seen an Advertisement for a Community College- Formal letter
- Last Week You Were on a Flight to London- Formal Letter
- One of Your Friends Wants to Apply for a Job- Formal letter
Semi Formal Letter
Informal letter, what are the ielts band score standards.
IELTS Writing Task 1 has a scoring standard on the basis of which an answer is evaluated and checked by the board. These are standardized measures that a student needs to follow throughout their answer. Check the tables given below:
IELTS Writing Task 1: Task Achievement and Task Response ( Task 1 & Task 2)
Ielts writing task 1: coherence and cohesion, ielts writing task 1: lexical resource.
Want to ace your IELTS writing?
Book a free trial & talk to our Experts!
IELTS Writing Task 1: Grammar Range and Accuracy
Ielts writing task 1 video to watch.
We have listed down videos that are a must-watch for all the aspirants. This way you can pick up your learning pace with distinct visuals. Check the videos below:
- Understanding IELTS Writing Task 1 ACADEMIC in 20 Minutes
- IELTS Academic Writing Task 1 | BAND 9 MAP Vocabulary 2024
- IELTS Academic Writing Task 1 - TABLE Description | BAND 9 TIPS
- IELTS Academic Writing Task 1 - BAND 9 LINE GRAPH VOCABULARY
- IELTS PIE CHART Writing Task 1 Academic | Band 9 Vocabulary Questions
- IELTS 2024 General Writing Task 1 (COMPLETE) with BAND 8+ SAMPLE LETTERS
Phew, we've covered a lot of ground here. Just remember to analyze the chart carefully, describe the key trends in structured paragraphs, and summarize the main points. Apply the tips and resources suggested above to amplify your Task 1 practice. This will help develop the techniques and vocabulary you need to describe data accurately within the time limit.
Now you've got this - go show the IELTS Writing Task 1 who's boss!
Feeling anxious about your IELTS writing task 1 exam? Book a free webinar with our IELTS writing expert to identify your strengths and weaknesses. Take the first step towards success - book your free seat today !
Frequently Asked Questions
Should I write in full sentences or bullet points?
How do I describe increases and decreases in data?
What if I finish early, can I move to Task 2?
Can I give my opinion or interpretations of the data?
How do I manage my time for Task 1?
Is it OK to just describe and not compare data sets?
Can I use "I" or "we" in my response?
Is it fine if I go way under or over the 150 word target?
Do spelling mistakes affect my score?
How do I avoid going off topic or getting sidetracked?
Practice IELTS Writing Task 1 based on report types
Recent articles.
Nehasri Ravishenbagam

Raajdeep Saha
Our Offices
Gurgaon city scape, gurgaon bptp.
Step 1 of 3
Great going .
Get a free session from trainer
Have you taken test before?
Please select any option
Get free eBook to excel in test
Please enter Email ID
Get support from an Band 9 trainer
Please enter phone number
Already Registered?
Select a date
Please select a date
Select a time (IST Time Zone)
Please select a time
Mark Your Calendar: Free Session with Expert on
Which exam are you preparing?
Great Going!
- Preparing for IELTS
- Practice tests
- Free online IELTS Writing practice tests
- Free online IELTS Academic Writing practice tests - paper
IELTS practice Academic Writing test - Task 1
How to approach academic writing task 1.
In the IELTS Academic Writing test, you will have one hour to complete both of the two set writing tasks. Keep an eye on the time it takes you to complete practice Tasks 1 and 2 to make sure you don’t go too far over, and to use as a benchmark for how long you can expect each task to take you.
In the actual test, you will move from the first to the second task without a break. However, while practising, you may wish to reflect on the outcomes of practice Task 1 using the model answer provided before moving on to practice Task 2. Or you may wish to complete them both before looking at the model answers to give you a more accurate sense of timing.
An easy reminder…
Q: How long should I spend on IELTS Writing Task 1?
A: We suggest 20 minutes – saving 40 minutes for Task 2.
Q: How many words for IELTS Writing Task 1?
A: 150 words is about the right length, but don’t be afraid to go a little over.
Q: Should I be formal or conversational in style?
A: You should write in a formal style, suited to an academic environment.
Q: What are the do’s and don’ts in IELTS Writing task 1?
A: Do pay attention to time - task 1 is worth one third of the total marks (while task 2 is worth two thirds), Don’t let nervousness stop you from trying your best.
Get more tips to help you prepare for the writing tasks
Task 1 – Take a look at the chart below and perform the task as outlined:
This graph shows the proportion of four different materials that were recycled from 1982 to 2010 in a particular country.
Summarise the information by selecting and reporting the main features, making comparisons where relevant.

What should I do next?
Once you’ve finished, you can download the model answer for Writing Task 1 and see how your work compares.
This sample offers a useful guide for how to structure your answer for IELTS writing task 1, as well as the style of writing expected. A good way to improve is to reflect on how your answer compares to the model answer – and, of course, keep practicing.
If you want to see an example of an actual answer sheet for the IELTS Academic Writing test (‘on paper’ version), you can download a sample copy below.
- IELTS practice Academic Writing test - Task 2
IELTS Academic Writing Task 1 Samples
Prepare for the IELTS Academic Test by using this collection of IELTS Academic Writing Task 1 practice samples. This collection is a great way to gain insight and practice for the exam.
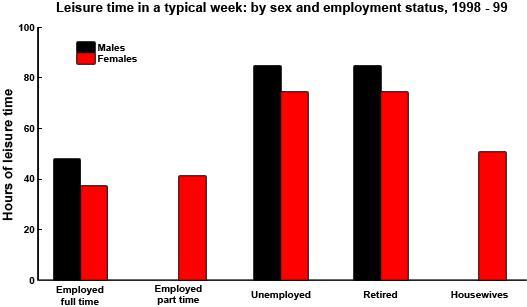
the bar chart demonstrates how many sex that people had in given period
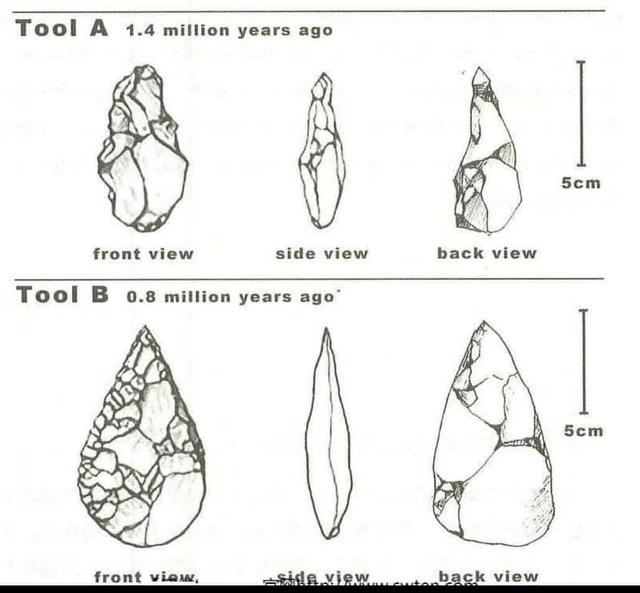
The diagram below shows the development of cutting tools in the Stone Age. Summarise the information by selecting and reporting the main features and make comparisons where relevant.
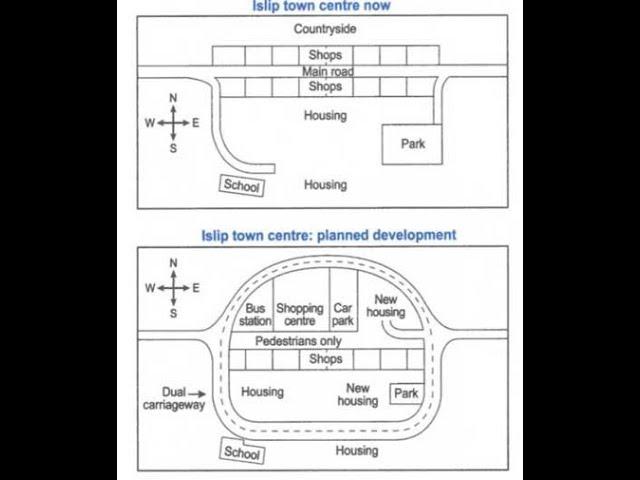
the graph show the map of islip center. describe it
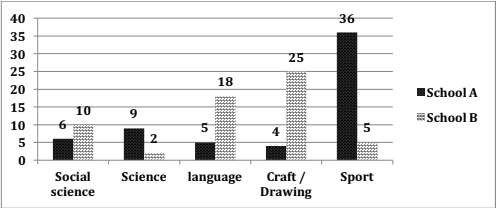
The bar chart shows information about the favorite subjects of students from two middle schools, school A and school B.
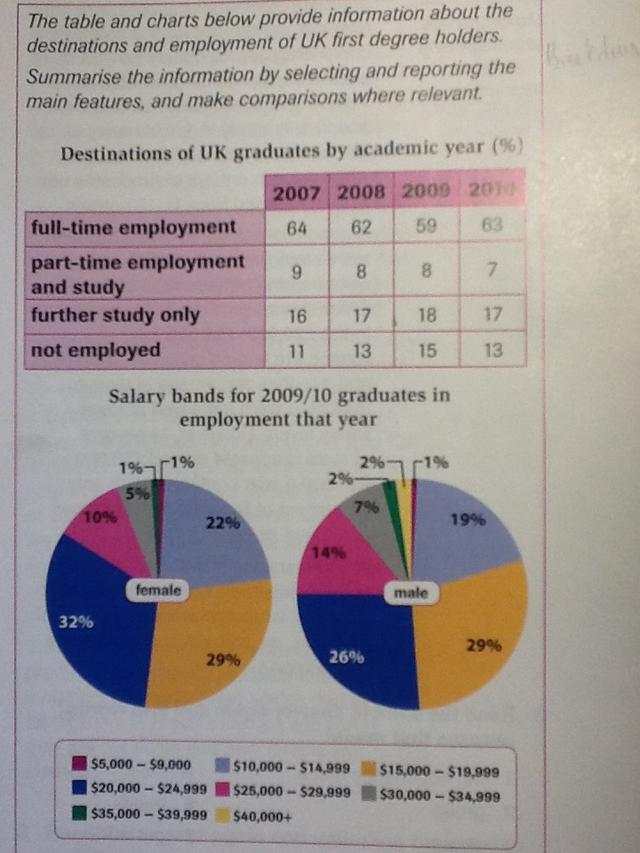
The table and charts below provide information about the destinations and employment of UK first degree holders
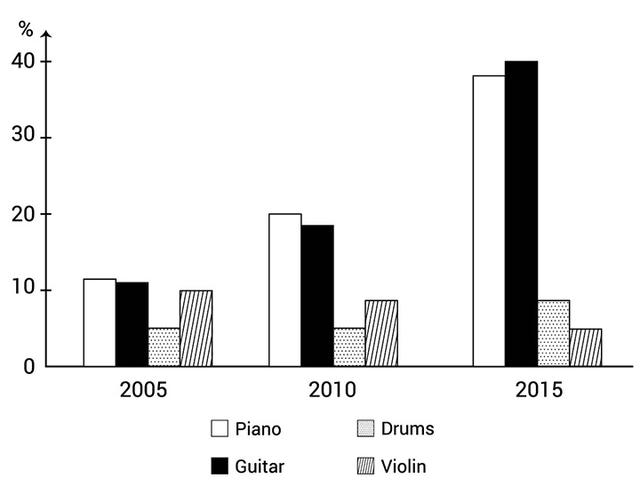
The bar chart shows the percentage of school children learning to play different musical instrument in 2005, 2010 and 2015. (the piano was over 10% in 2005, over 20% in 2010, about 35% in 2015; the guitar was over 10% in 2005, about 18% in 2010, 40% in 2015; the drums was about 5% in 1005, about 4% in 2010, about 10% in 2015; the violin was 10% in 2005, 9% in 2010, 5% in 2015)
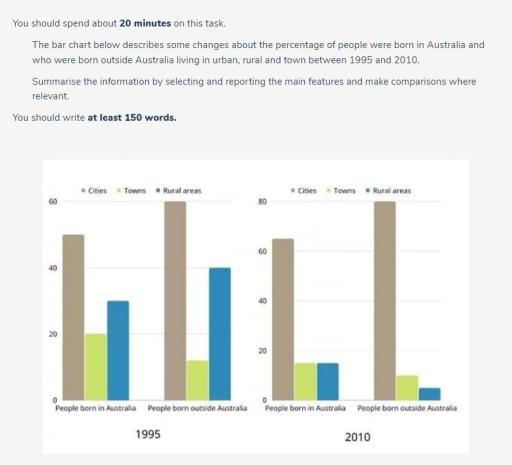
The bar chart below describes some changes about the percentage of people were born in Australia and who were born outside Australia living in urban, rural and town between 1995 and 2010. Summarise the information by selecting and reporting the main features and make comparisons where relevant. You should write at least 150 words.
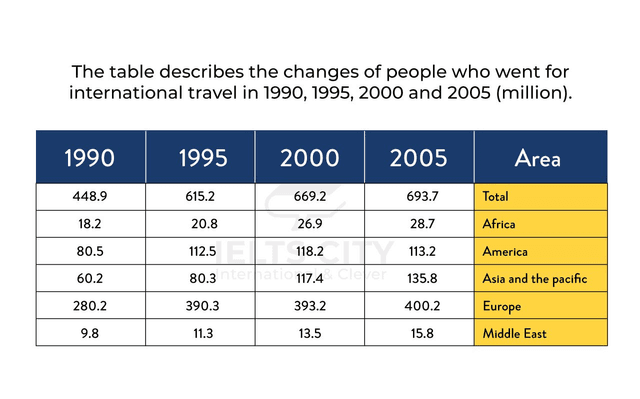
The table describes the changes of people who went for international travel in 1990, 1995, 2000 and 2005.
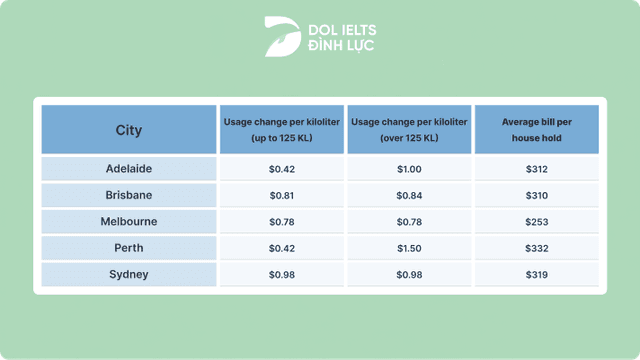
The table shows the cost of water in 5 cities in Australia. Summarise the information by selecting and reporting the main features.
The chart below shows how frequently people in the USA ate in fast food restaurants between 2003 and 2013. Summarise the information by selecting and reporting the main features, and make comparisons where relevant.
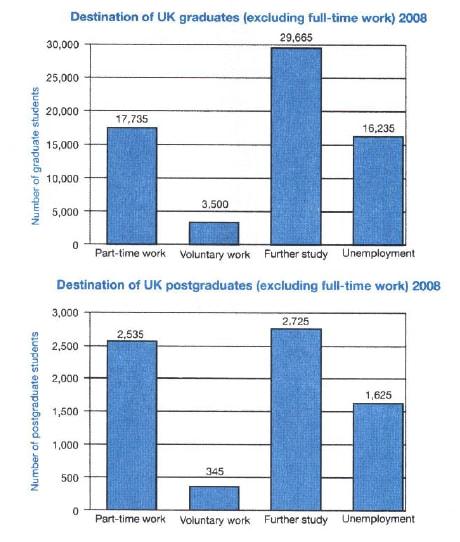
The charts below show what uk graduate and postgraduate students who did not go into full-time work did after leaving college in 2018. summarize the information by selecting and reporting the main features, and make comparisons where relevant..
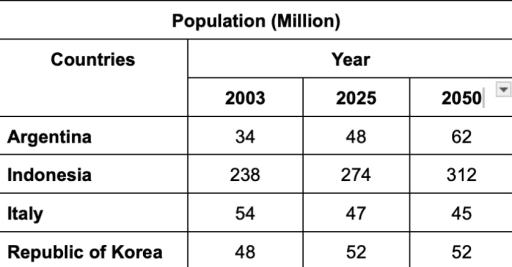
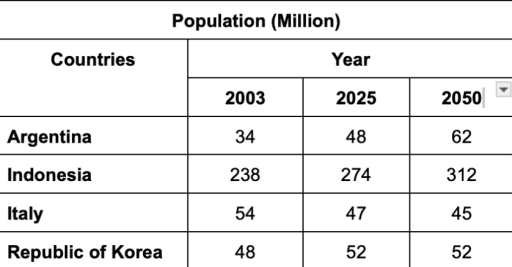
The table below shows population figures for four countries for 2003 and projected figures for 2025 and 2050. (in millions) Summarize the information by selecting and Reporting the main features then make comparisons where relevant
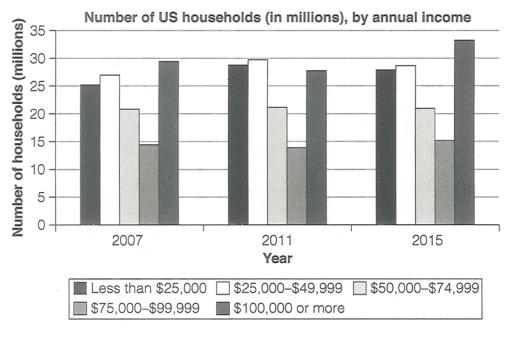
The chart below shows the number of households in the US by their annual income in 2007, 2011, and 2015. Summarize the information by selecting and reporting the main features, and make comparisons where relevant.
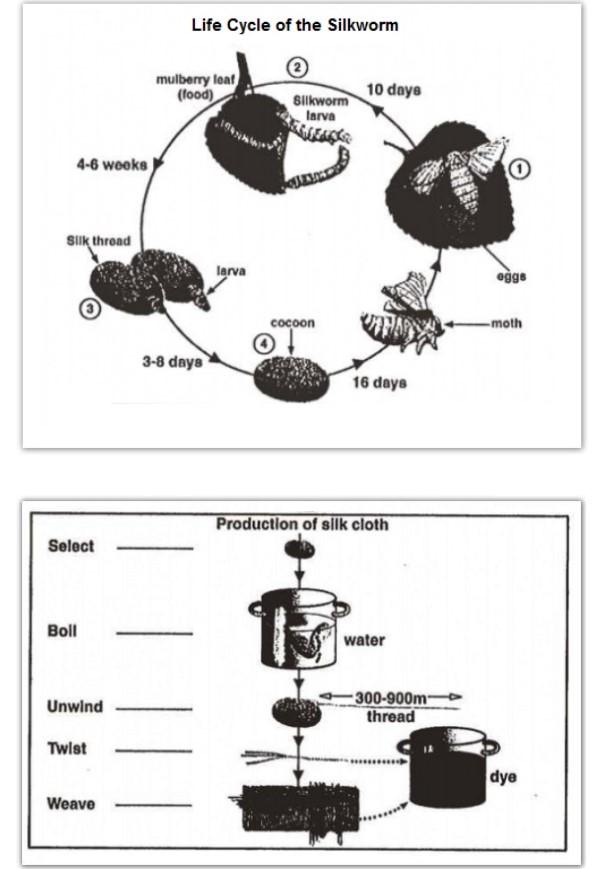
The diagrams below show the life cycle of the silkworm and the stages in the production of silk cloth. Summarise the information by selecting and reporting the main features, and make comparisons where relevant.
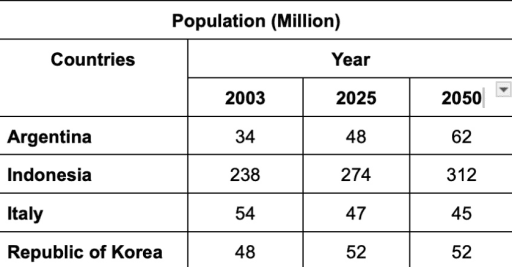
The table below shows population figures for four countries for 2003 and projected figures for 2025 and 2050. (millions) Summarize the information by selecting and Reporting the main features then make comparisons where relevant
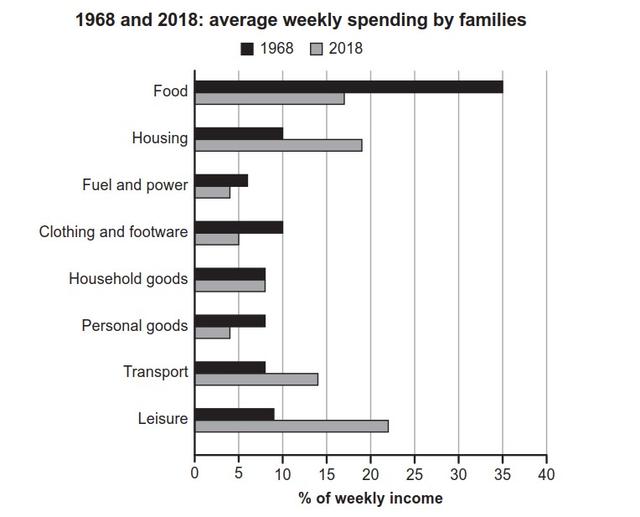
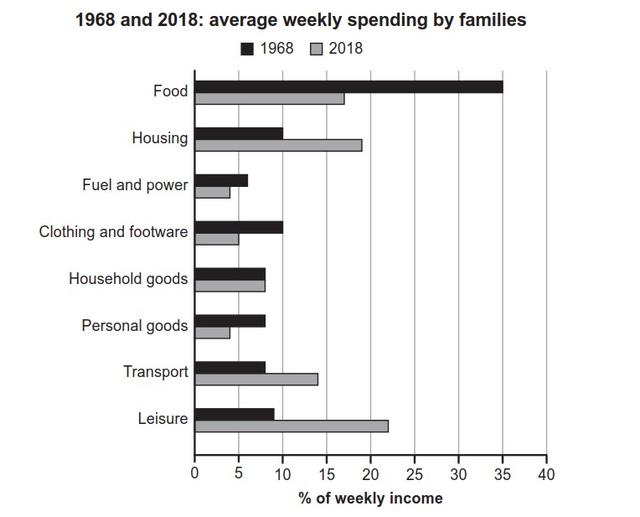
WRITING TASK 1 You should spend about 20 minutes on this task. The chart below gives information about how families in one country spent their weekly income in 1968 and in 2018. Summarise the information by selecting and reporting the main features, and make comparisons where relevant. Write at least 150 words.
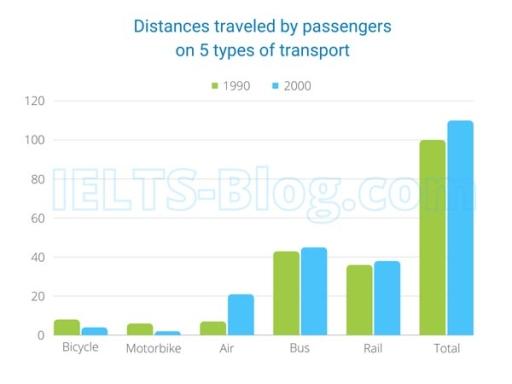
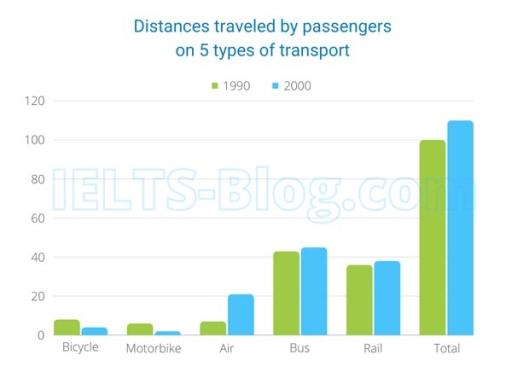
The chart shows the total distance traveled by passengers on five types of transport in the UK between 1990 and 2000.
The table below shows population figures for four countries for 2003 and projected figures for 2025 and 2050. (millions) Summarize the information by selecting and Reporting the main features then make comparisons where relevant.
The chart shows the total distance travelled passengers on five types of transport in the UK between 1990 and 2000.
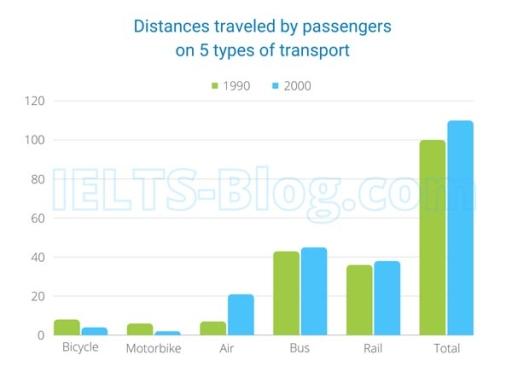
The chart shows the total distance travelled passengers on five types of transport in the UK between 1990 and 2000
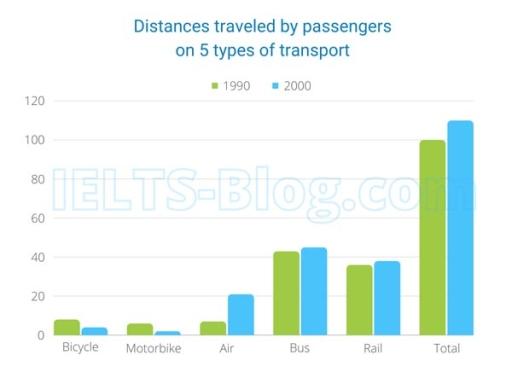
The chart shows the total distance travelled passengers on five types of transport in the UK between 1990 and 200
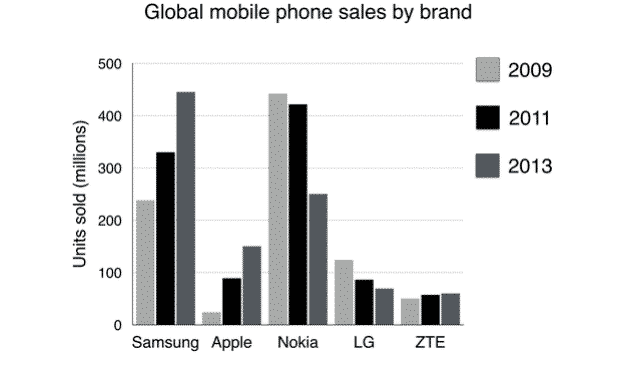
The chart below shows global sales of the top five mobile phone brands between 2009 and 2013. Write a report for a university, lecturer describing the information shown below.
The graph below shows the contribution of three sectors-agriculture, manufacturing and businessand financial service-to the uk economy in the twentieth century
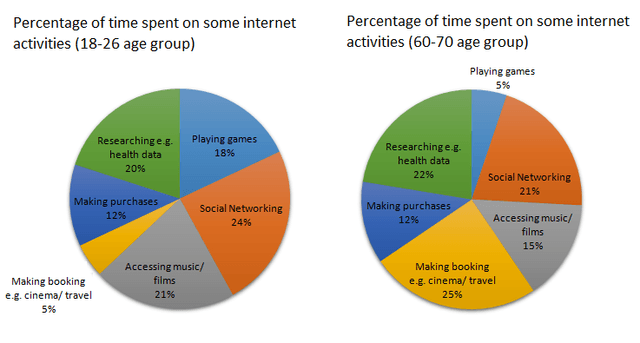
The graph below shows the percentage of urban/suburban and rural households in a european country that had acces between 1999 and 2004., the charts below show the percentage of time younger and older people spend on various internet activities in their free time (excluding email). summarise the information by selecting and reporting the main features, and make comparisons where relevant..
The table and pie chart illustrate populations in Australia according to different nationalities and areas. Summarize the information by selecting and reporting the main features and make comparisons where relevant
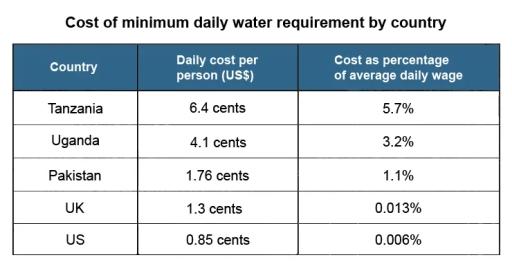
The table below gives information about the daily cost of water per person in five different countries. (figures are based on the minimum daily requirement per peron of 11.5 litres.) summarise the information by selecting and reporting the main features, and make comparisons where relevant..
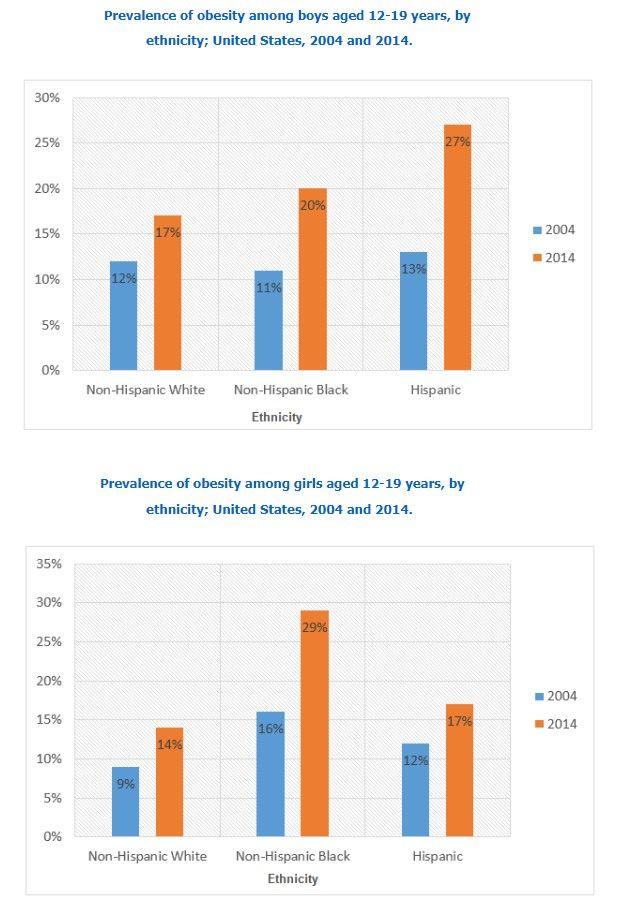
The bar charts below show the prevalence of obesity among boys and girls aged12 to 19 years by ethnicity, in the United States for the years 2004 and 2014. Summariseinformation by selecting and reporting the main features, andamake comparisons where relevant.
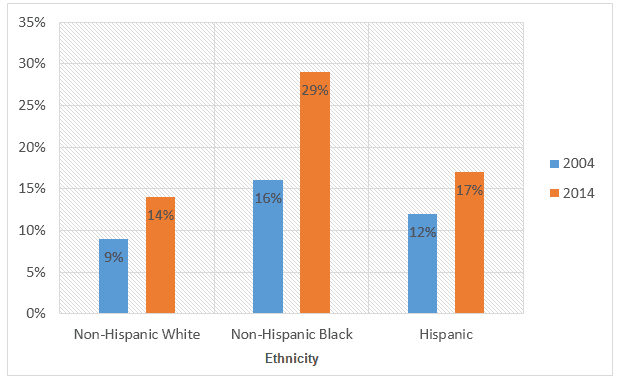
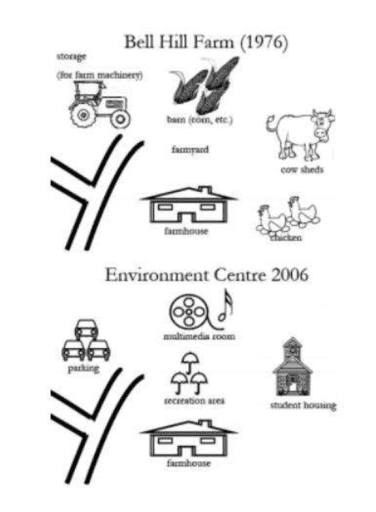
The maps show the changes of Bell Hill Farm in 1976 and 2006. (Bell Hill Farm in 1976-->Bill Hill Environmental Centre 2006) Summarise the information by selecting and reporting the main features and make comparisons where relevant.
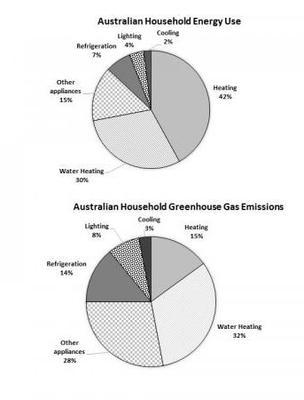
The first pie chart illustrates the amount of energy utilized in an average Australian household. The second one demonstrates consequence of using energy leading to the greenhouse gas emissions. By and large, it can be seen that Australia people tend to utilize a great deal of heating energy.
The bar chart illustrates how seven European nations spend on relaxing activities as a proportion of total household, while the pie chart demonstrates the tendency of the average yearly expenditure on entertaining activities per household in the U.K.
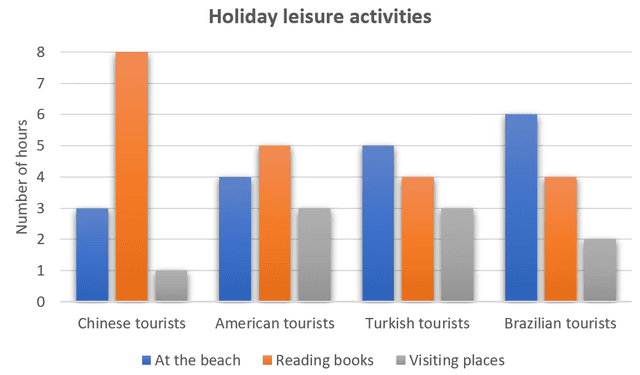
The chart below show the changes of electrical appliance and amount of time spent doing housework in households in one country between 1920 and 2019 .
The map below shows the development of the village of Ryemouth between 1995 and present. Summarise the information by selecting and reporting the main features and make comparisons where relevant. Write at least 150 words.
The charts bellow show the percentage of water used for different purposes in six areas of the world..
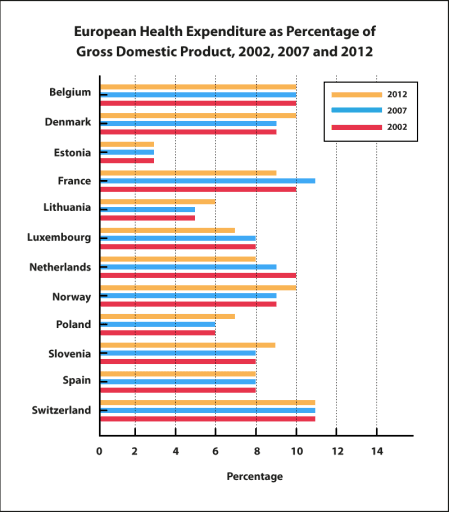
The bar chart below shows current health expenditure totals as percentages of GDP* for various European countries for the years 2002, 2007 and 2012.
The charts below show the changes in ownership of electrical appliances and amount of time spent doing housework in households in one country between 1920 and 2019. summarise the information by selecting and reporting the main features, and make comparisons where relevant..
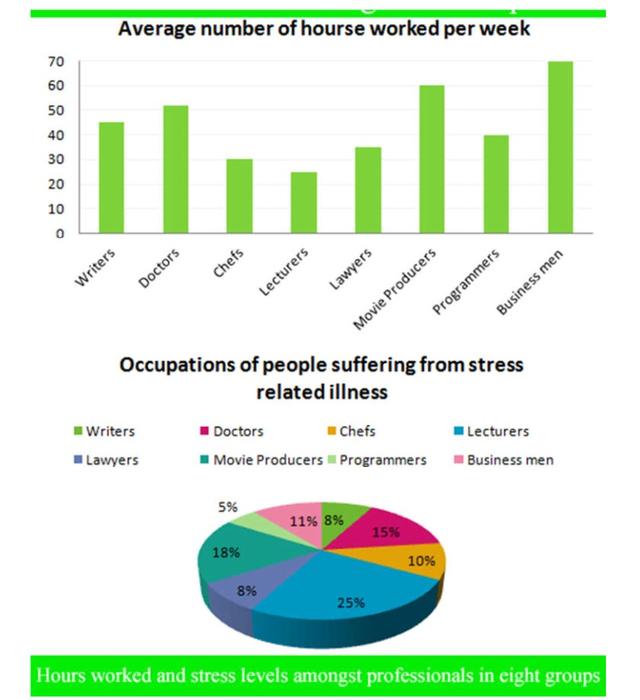
The graphs show figures relating to hours worked and stress levels amongst professionals in eight groups. Describe the information shown to a university or collage lecturer.
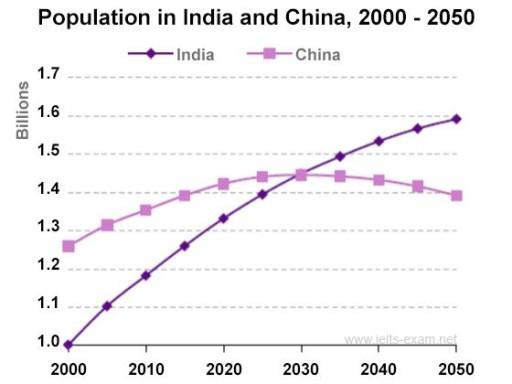
The graph below shows the population of India and China from the year 2000 to the present day with projections for growth to the year 2050.
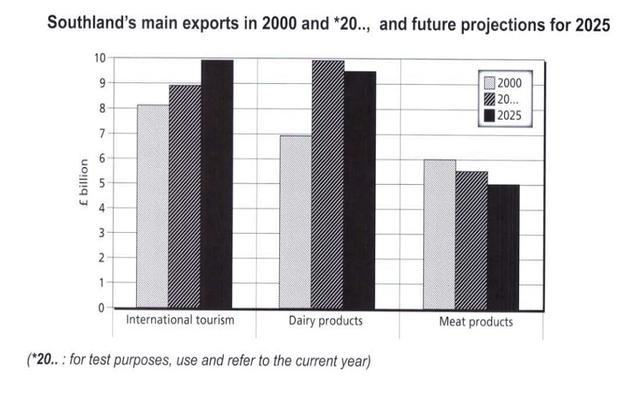
The chart below gives information about Southland’s main exports in 2000, *20…, and future projections for 2025.
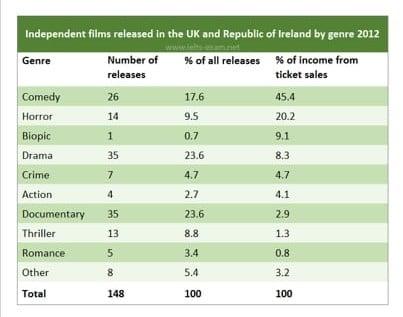
The given table illustrates the data about the independent films released in the UK and the republic of Ireland based on the category of movies in the year 2012.
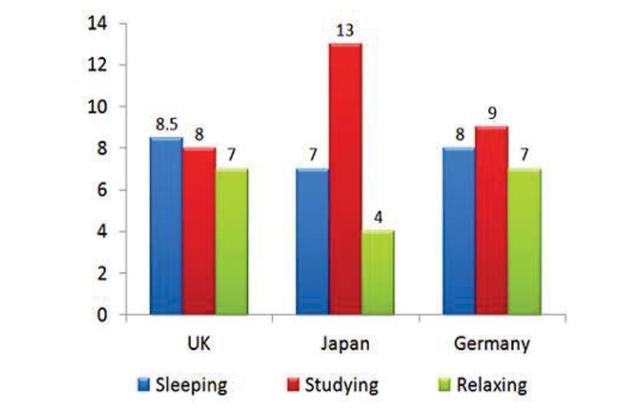
The bar chart shows the typical weekday for students in three different countriesSummarise the information by selecting and reporting the main features, and make comparisons where relevant.
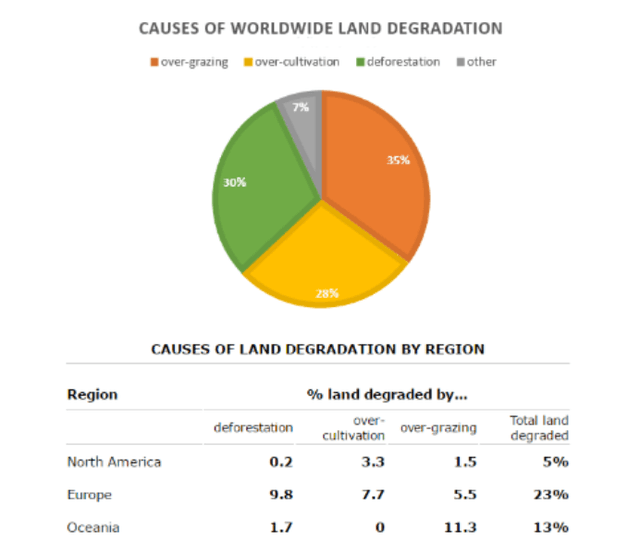
The charts shows information about the reasons of degradation in soil in 3 differen parts in the world in 1990s. Summarise the information by selecting and reporting the main features, and make comparisons where relevant.
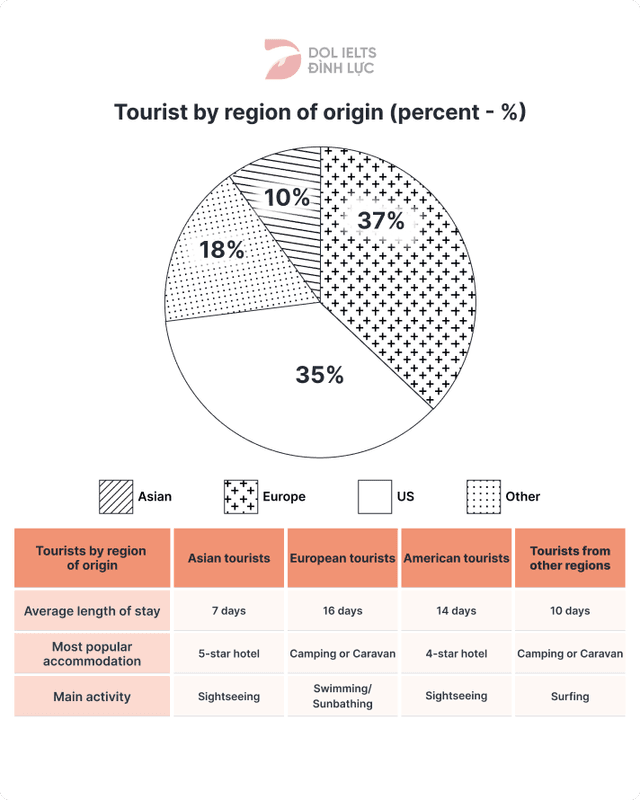
The chart and table below give information about tourists at a particular holiday resort in Australia.
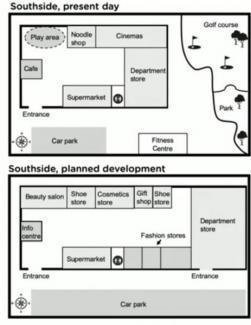
The maps show South side, a shopping mall, as it is now, and plans for its development.
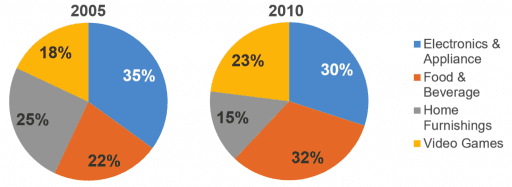
The two pie charts below show the online shopping sales for retail sectors in Canada in 2005 and 2010. Summarise the information by selecting and reporting the main features, and make comparisons where relevant. Write at least 150 words.
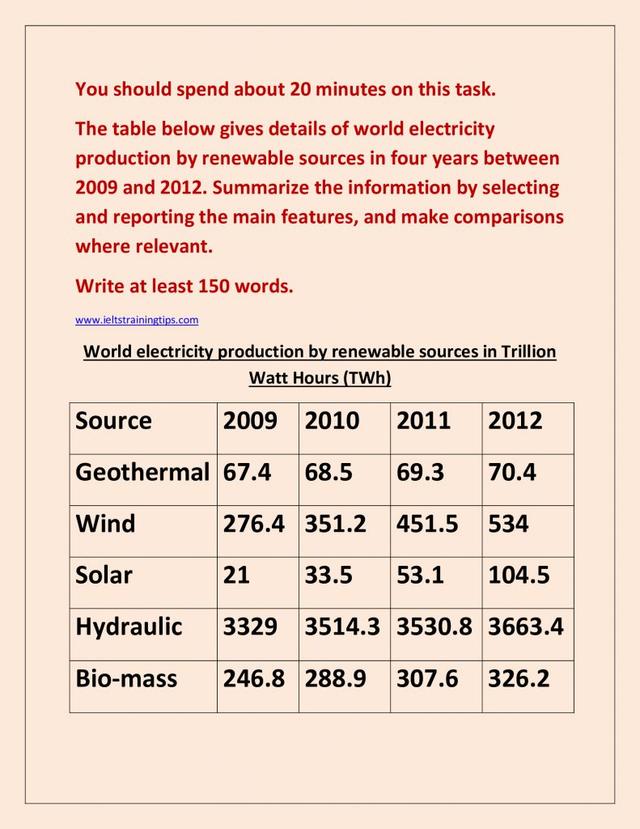
The table below gives details of world electricity production by renewable sources in the four years between 2009 and 2012. Summarize the information by selecting and reporting the main features and making comparisons where relevant. Write at least 150 words.
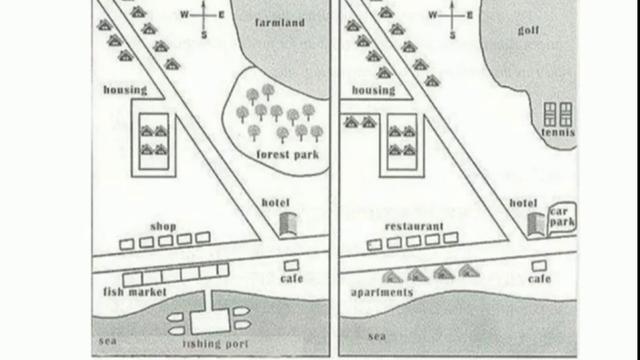
The map below shows the development of the village of Ryemouth between 1995 and present.
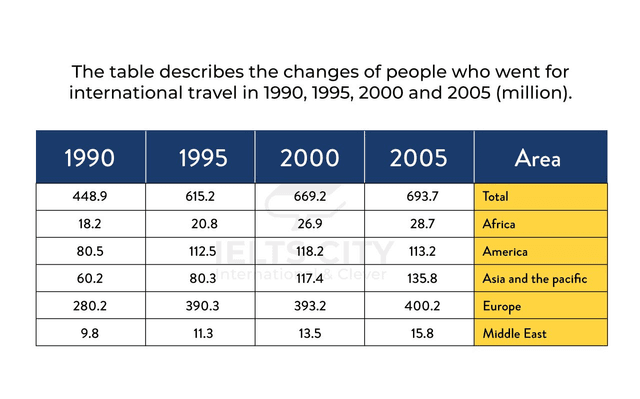
The table describes the changes of people who went for international travel in 1990, 1995, 2000 and 2005. (million).
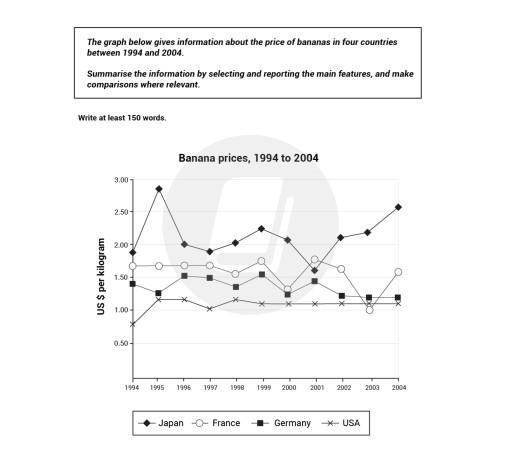
The graph below gives information about the price of bananas in four countries between 1994 and 2004
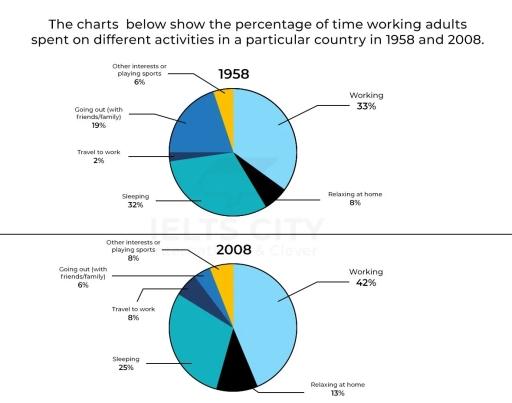
The pie charts below show the percentage of time working adults spent on different activities in a particular country in 1958 and 2008. Summarise the information by selecting and reporting the main features and make comparisons where relevant
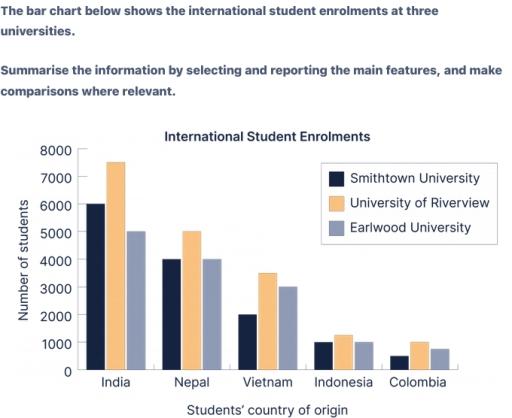
The bar chart below shows the international student enrolments at three universities. Summarise the information by selecting and reporting the main features, and make a comparison where relevant.
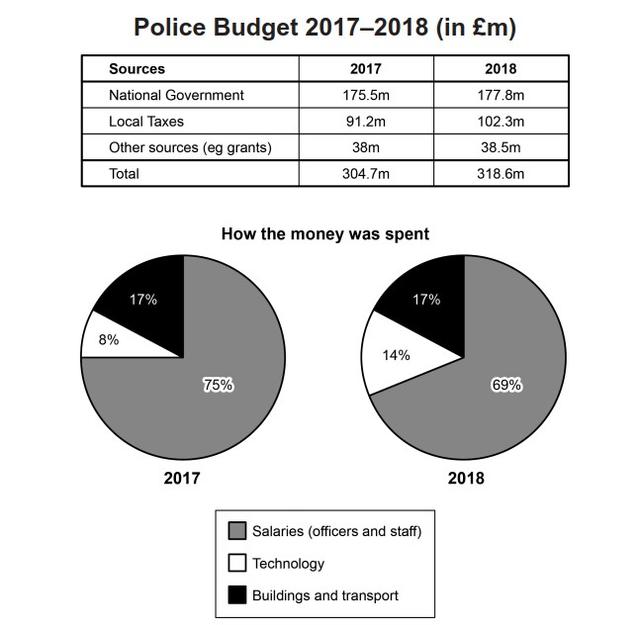
The table and charts below give information on the police budget for 2017 and 2018 in one area of Britain. The table shows where the money came from and the charts show how it was distributed. Summarise the information by selecting and reporting the main features, and make comparisons where relevant.
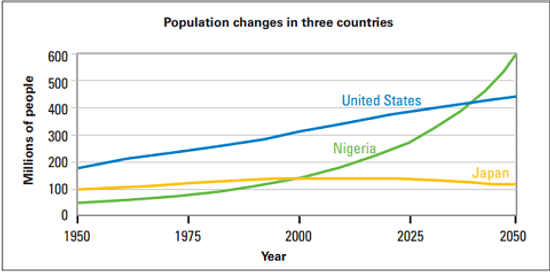
The graph below gives historical information and projections about changes in population in the United States, Nigeria and Japan.
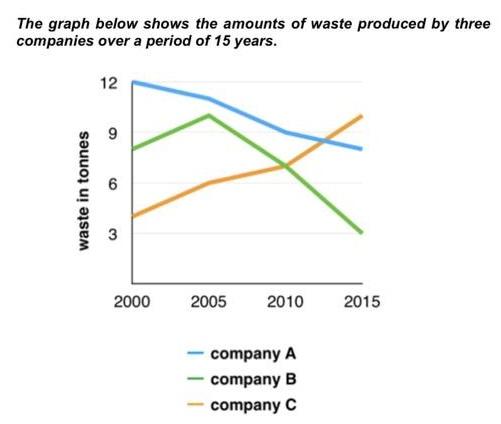
the graph below shows the amounts of waste produced by three companies over a period of 15 years. Summarize the main features and make comparison where relevant.
The chart below shows the results of a survey about people’s coffee and tea buying and drinking habits in five Australian cities. Summaries the information by selecting and reporting the main features, and make comparisons where relevant. Write at least 150 words.
The bar chart below shows the percentage of people living alone in five different age groups in the usa between 1850 and 2000..

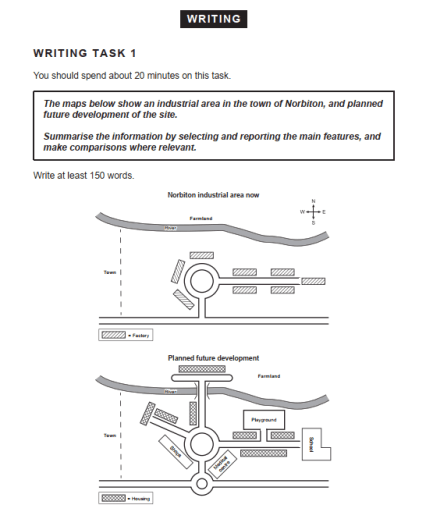
the map below show an industrial area in the town of Norbition and planned future development of the site.
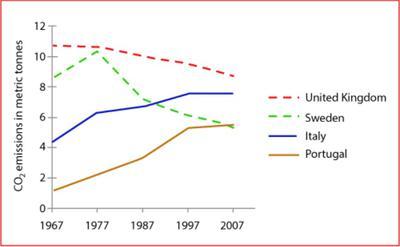
The chart illustrates average co2 emissions
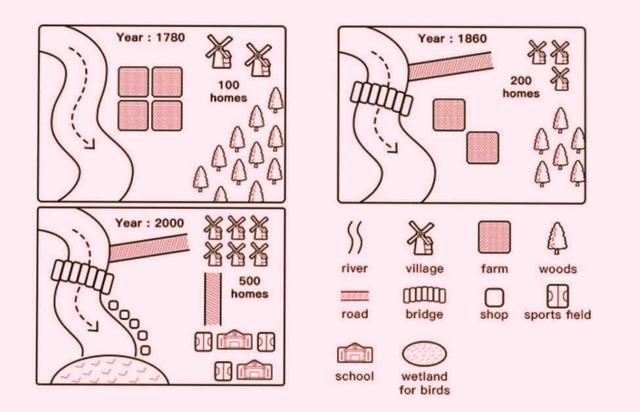
The map bellow show the chances that occurred to a town named Willington in 1780,1860 and 2000.
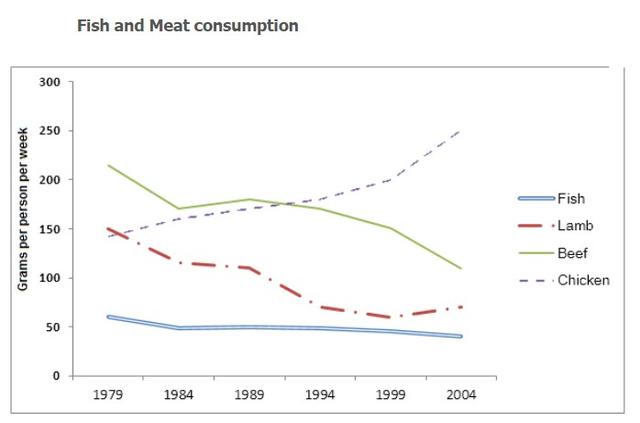
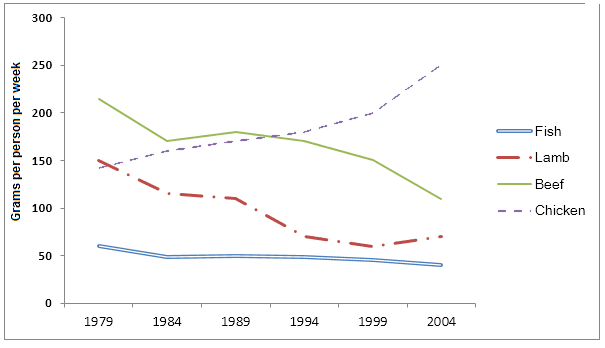
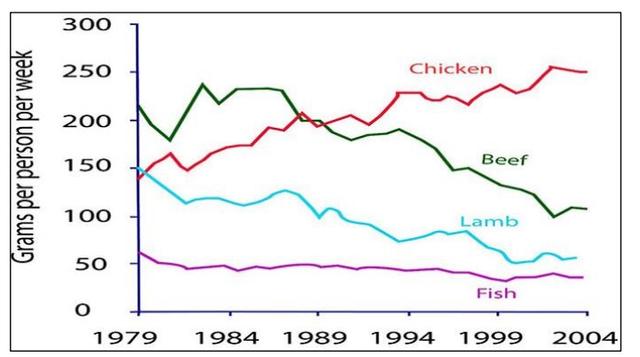
The graph below shows the consumption of fish and some different kinds of meat in a European country between 1979 and 2004. Summarise the information by selecting and reporting the main features, and make comparisons where relevant
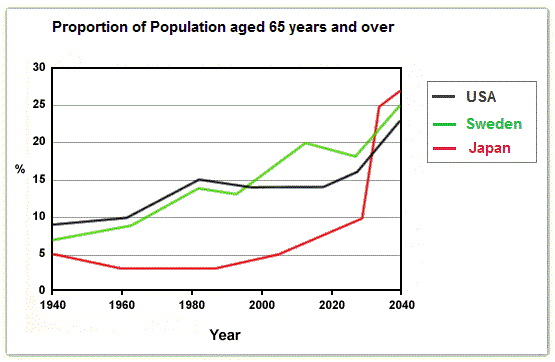
The graph below shows the proportion of the population aged 65 and over between 1940 and 2040 in three differnt countries. Summarise the information by selecting and reporting the main features.
The graph below shows the number of shops that closed and the number of new shops that opened in one country between 2011 and 2018.
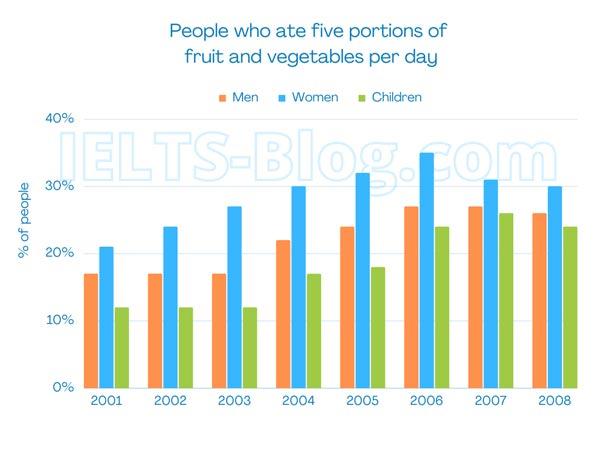
The chart below shows the percentage of people who ate five portions of fruit and vegetables per day in the uk from 2001 to 2008..
The graph below shows the consumption of meat in Spain between 2001 and 2011. Summarise the information by selecting and reporting the main features, and make comparison where relevant.
The table illustrates the proportion of monthly household income five European countries spend on food and drink, housing, clothing and entertainment.

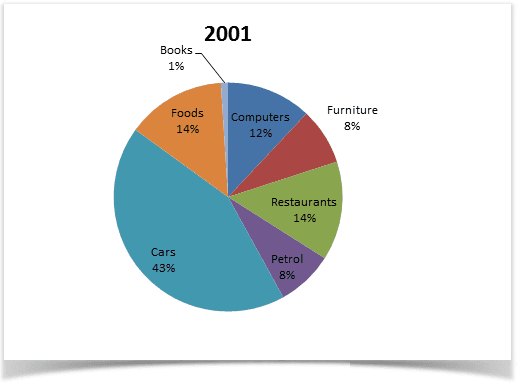
The pie charts below compare household spending in the uk in 1980 with prediction for 2030
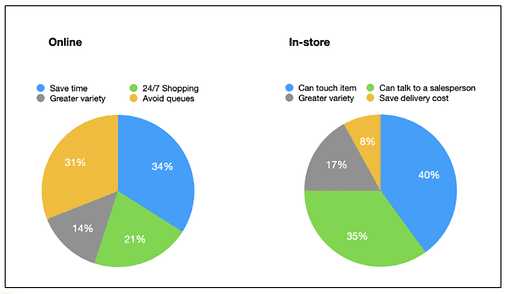
The pie charts below show the reasons given for shopping online and in-store. write 150 words
The table below shows social and economic indicators for four countries in 1994, according to United Nations statistics. Describe the information shown below in your own words. What implications do the indicators have for the countries? You should write at least 150 words.

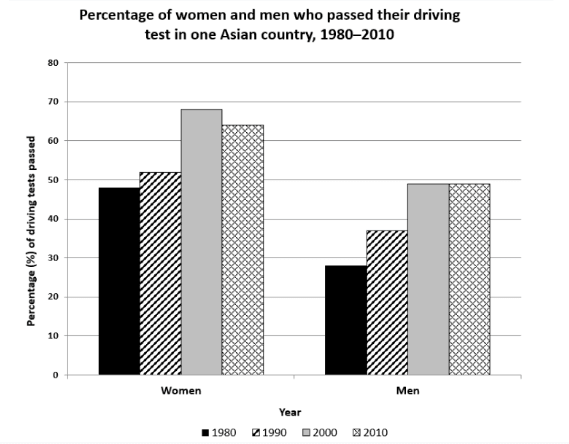
The chart shows the percentage of women and men in one Asian country who passed when they took their driving test between 1980 and 2010.
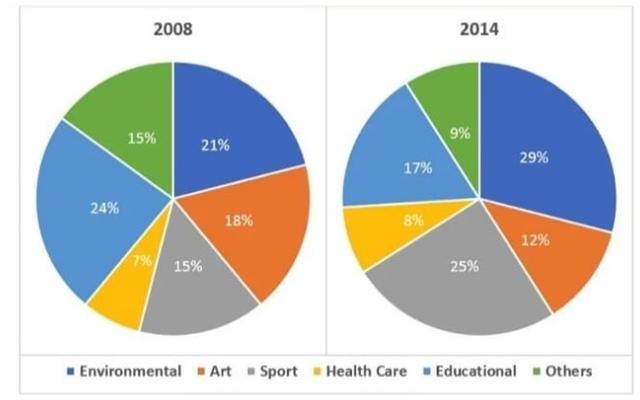
The pie charts below show the percentage of volunteers by organisations in 2008 and 2014.
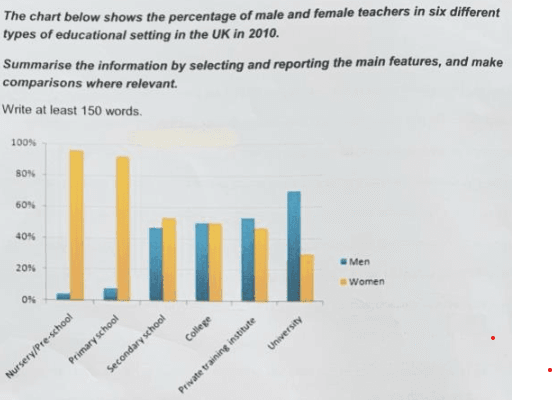
the chart shows that male and female teacheres in six different types of educational setting in the UK in 2010
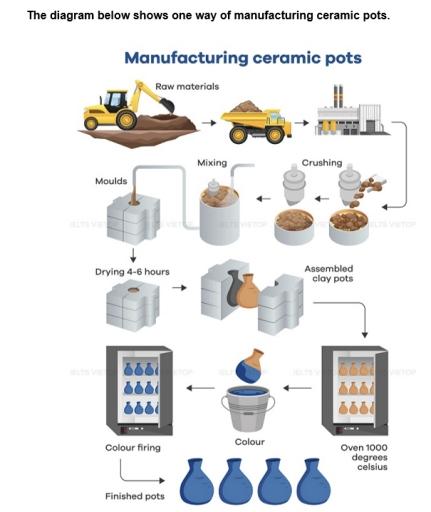
Task 1: The diagram below shows one method of manufacturing ceramic pots.
The following map details a town now and a proposed future layout. Summarise the information by selecting and reporting the main features and make comparisons where relevant.
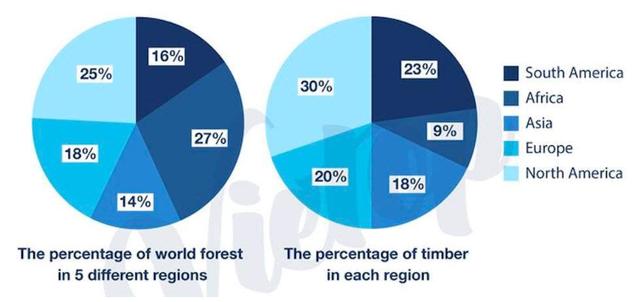
The charts give information about world forest in five different regions. Summarize the information by selecting and reporting the main features and make comparisons where relevant.
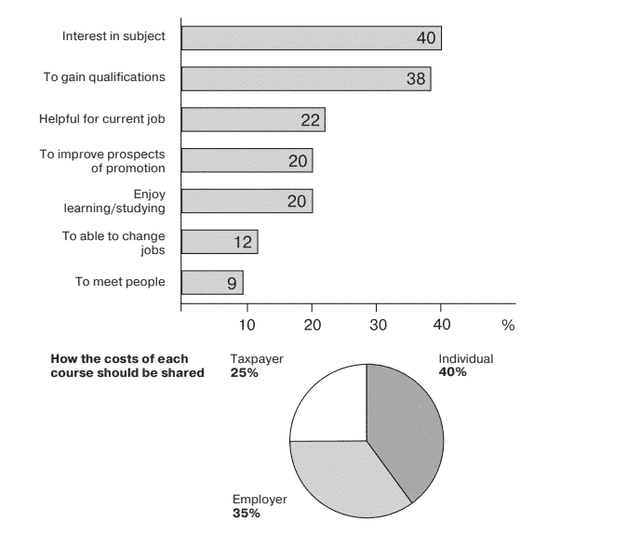
The charts below show the result of a survey of adult education. The first chart shows the reason why adults decide to study. The pie chart shows how people think the costs of adult education should be shared. Write a report for a university lecturer, describing the information shown below.
The bar charts below shows the prevalence of obesity among boys and girls aged 12 to 19 by ethnicity, in the United States for the years 2004 and 2014.
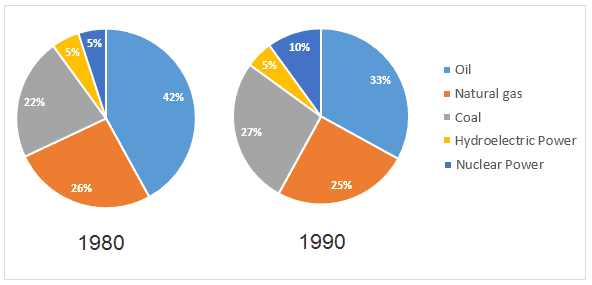
the two main graphs show the main sources of energy in the USA in 1980 and 1990. Write a report describing the changes, at least 150 words.
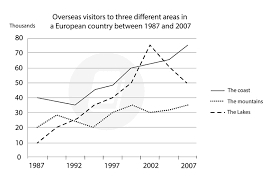
The line graph shows the changes in the number of overseas tourists in three different regions (coast, lakes, and mountains) in each country in Europe. Summarize the information by selecting and reporting the main features and making comparisons where relevant.

The chart below gives information about how families in one country spent their weekly income in 1968 and 2018. Summarise the information by selecting and reporting the main features, and make comparisons where relevant.
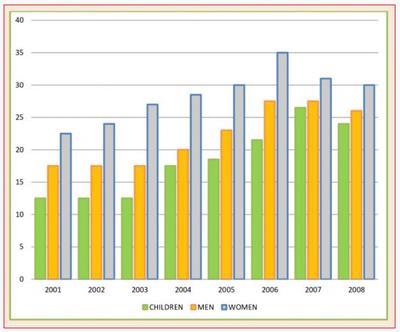
The charts below shows the percentage of people who ate five proportions of fruits and vegetables per day in the UK from 2001 to 2008.
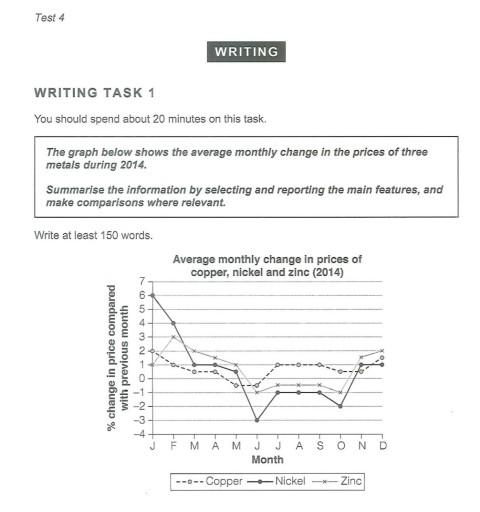
the graph below shows the average monthly change in the prices of three metals during 2014. summarize the information by selecting and reporting the main features and make comparisons where relevant.
The line graph below shows the international student enrolment numbers at De Salle University from 1980 to 2020. Summarise the information by selecting and reporting the main features, and make a comparison where relevant.
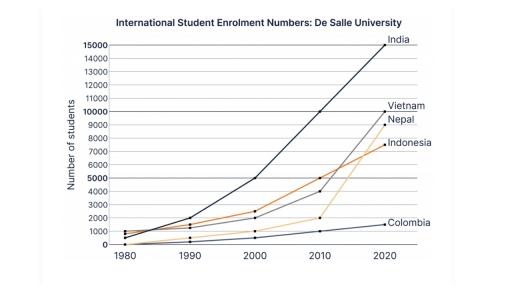
The line graph below shows the international student enrolment numbers at De Salle University from 2005 to 2009 Summarise the information by selecting and reporting the main features, and make a comparison where relevant.
You should spend about 20 minutes on this task. the charts below show the changes in ownership ofelectrical appliances andamount of time spent doing housework in households in one country between1920 and 2019. summarise the information by selecting and reporting the main features, andmake comparisons where relevant. write at least 150 words..
The graph below shows the consumption of fish and some different kinds of meat in an European country bbetween 1979 and 2004
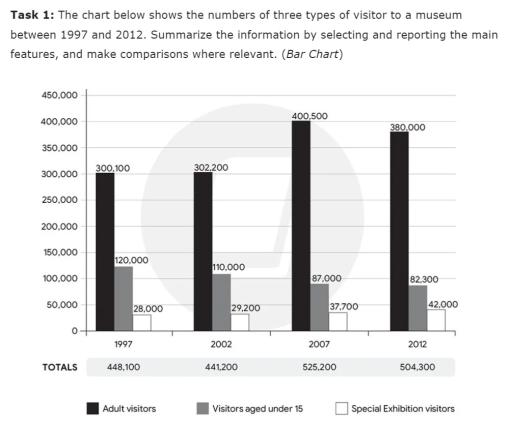
The chart below shows the numbers of three types of visitors to a museum between 1997 and 2012. Summarize the information by selecting and reporting the main features, and make comparisons where relevant.
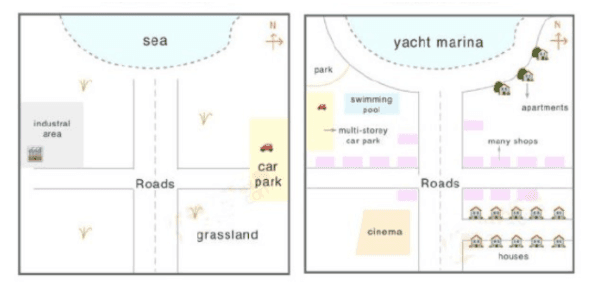
The map show a change of coastal town, called Petland, from 1950 to 2007
The bar chart below shows current health expenditure totals as percentages of GDP* for various European countries for the years 2002, 2007 and 2012. Summarise the information by selecting and reporting the main features, and make comparisons where relevant.
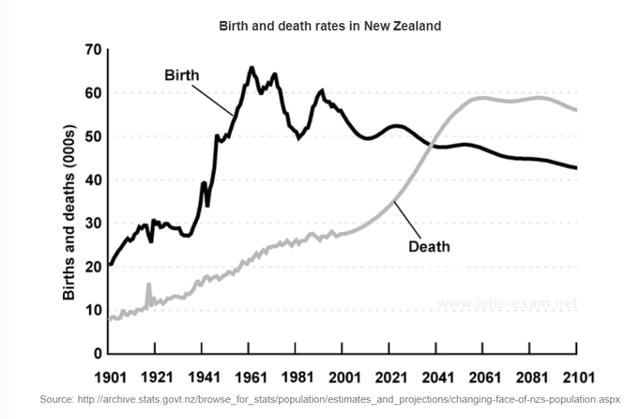
The graph below gives information about changes in the birth and death rates in New Zealand between 1901 and 2101. Summarise the information by selecting and reporting the main features, and make comparisons where relevant.
- Unlimited Essay Checks: Practice and perfect your skills.
- Detailed Error Analysis: Spot every mistake.
- In-Built Grammar Checker: Say no to grammatical errors.
- Personalized Suggestions: Know how to boost your score.
- Progress Tracking: View your checked essay history.
- Still thinking? We have a 14-day money-back guarantee. Take a leap of faith!
english course, online writing courses, online english speaking for IELTS
Ielts sample charts (ielts writing task 1).
The Writing Task 1 of the IELTS Academic test requires you to write a summary of at least 150 words in response to a particular graph (bar, line or pie graph), table, chart, or process (how something works, how something is done). This task tests your ability to select and report the main features, to describe and compare data, identify significance and trends in factual information, or describe a process.
Exam Preparation
Ielts preparation, ielts sample letters (ielts writing task 1).
The purpose of this section is to help you with the Writing Task 1 of the IELTS General test. In Task 1, candidates are asked to respond to a given problem with a letter requesting information or explaining a situation. It is suggested that about 20 minutes is spent on Task 1, which requires candidates to write at least 150 words. Depending on the task suggested, candidates are assessed on their ability to:
- engage in personal correspondence - elicit and provide general factual information - express needs, wants, likes and dislikes - express opinions (views, complaints etc.)
IELTS Writing Task 2 (IELTS Sample essays)
IELTS Writing Task 2 requires you to write at least 250 words. You will be presented with a topic and will be tested on your ability to respond by giving and justifying an opinion, discussing the topic, summarizing details, outlining problems, identifying possible solutions and supporting what you write with reasons, arguments and relevant examples from your own knowledge or experience. The assessment of Task 2 carries more weight in marking than Task 1. Writing scripts are marked by trained and certificated IELTS examiners, who all hold relevant teaching qualifications and are recruited as examiners by the test centres and approved by British Council or IDP: IELTS Australia.
SHARE THIS PAGE
The reading, writing and listening practice tests on this website have been designed to resemble the format of the IELTS test as closely as possible. They are not, however, real IELTS tests; they are designed to practise exam technique to help students to face the IELTS test with confidence and to perform to the best of their ability.
While using this site, you agree to have read and accepted our terms of use, cookie and privacy policy.
Dear readers,
This is to inform you that we have moved to a new domain, https://www.ielts-writing.info/EXAM/ .
Our old domain, https://www.ielts-exam.net/ will remain active till the time we migrate all our content to the new domain.
We look forward to your continuing support.
IELTS Writing Task 1 – Sample Questions and Practice Resources

On the IELTS Academic exam, Writing Task 1 requires you to look at an informational graphic and describe the contents of the graphic in writing. In this post, we’ll look at different IELTS Writing Task 1 samples to prepare you for test day. In addition to advice and practice, you’ll also get our IELTS Writing Task 1 Examples PDF with Answers for portable prompts and model answers.
IELTS Academic Writing Task 1 Samples With Answers PDF
If you want a print-friendly version of the IELTS Writing Task 1 samples in this post, click below to access the IELTS Writing Task 1 examples PDF!
Note that all the IELTS Writing Task 1 samples are model essays for a band 9 IELTS score. The line graph sample prompt includes a detailed scoring explanation. You can learn more about scores for IELTS Writing Task 1 by consulting the official IELTS rubric .
- Take a good look at our guide to IELTS Writing Task 1 paragraph structure . The guide tells you everything you need to know about how Writing Task 1 essays and paragraphs should be structured, with an example question and model essay.
IELTS Writing Task 1 Samples: The Major Question Types
Below are questions for each common infographic in IELTS Writing Task 1: bar charts, pie charts, line graphs, process diagrams, and maps.
IELTS Academic Writing Task 1: Line Graph with Model Answer and Scoring Explanation
[/threecol_one_last]
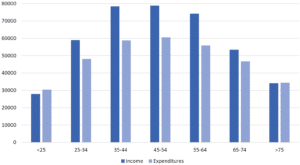
IELTS Academic Writing Task 1: Bar Chart With Model Answer
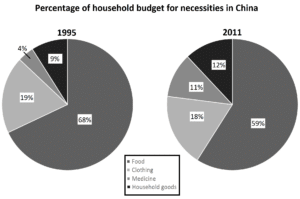
Pie Chart with Model Answer
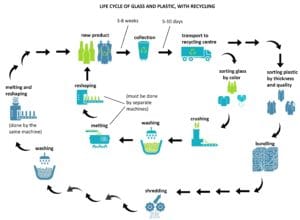
Process Diagram with Model Answer
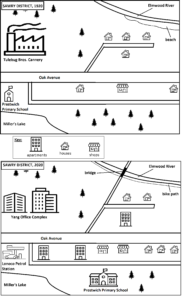
IELTS Academic Writing Task 1: Map with Model Answer
IELTS Academic Writing Task 1: Two Different Types of Graphics
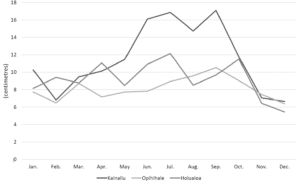
[/threecol_two][threecol_one_last]
Additional Resources for Writing Task 1
Now that you’ve seen some models for how this task is done, you should be ready for some real practice! Here are some resources from Magoosh that should help.
- Practicing using these common IELTS Writing Task 1 and Task 2 linking words .
- Familiarize yourself with the test with IELTS Academic Writing Task 1: Ultimate Guide video , and use a Writing diagnostic quiz to assess your current strengths and weaknesses.
- Use study schedules to help you find time to study and stay motivated. To help you organize your time, use this IELTS study schedule if you only have a week to go before you will take the IELTS. If you have a month, this one month IELTS study schedule offers more extended practice.
- Find high-quality study materials. We offer a huge collection of study reources for the whole IELTS Writing seciton ! Don’t forget about Magoosh IELTS Prep which includes lessons on IELTS Writing Task 1 (and all other sections of the exam!) to help you prep smarter. In addition to many video lessons and practice essays, the 6-month plan allows students to get feedback and scoring on four practice IELTS Writing essays; the 1-month plan includes feedback on one essay. You can also browse more recommended books and resources !

David is a Test Prep Expert for Magoosh TOEFL and IELTS. Additionally, he’s helped students with TOEIC, PET, FCE, BULATS, Eiken, SAT, ACT, GRE, and GMAT. David has a BS from the University of Wisconsin-Eau Claire and an MA from the University of Wisconsin-River Falls. His work at Magoosh has been cited in many scholarly articles , his Master’s Thesis is featured on the Reading with Pictures website, and he’s presented at the WITESOL (link to PDF) and NAFSA conferences. David has taught K-12 ESL in South Korea as well as undergraduate English and MBA-level business English at American universities. He has also trained English teachers in America, Italy, and Peru. Come join David and the Magoosh team on Youtube , Facebook , and Instagram , or connect with him via LinkedIn !
View all posts
More from Magoosh

Leave a Reply Cancel reply
Your email address will not be published. Required fields are marked *
IELTS Preparation with Liz: Free IELTS Tips and Lessons, 2024
- Test Information FAQ
- Band Scores
- IELTS Candidate Success Tips
- Computer IELTS: Pros & Cons
- How to Prepare
- Useful Links & Resources
- Recommended Books
- Writing Task 1
- Writing Task 2
- Speaking Part 1 Topics
- Speaking Part 2 Topics
- Speaking Part 3 Topics
- 100 Essay Questions
- On The Day Tips
- Top Results
- Advanced IELTS
IELTS Writing Task 1 Tips, Model Answers & More
Useful IELTS writing task 1 tips, answers, lessons & videos for success achieving a high score. This page contains all the information and help you need to do well. Learn about the IELTS marking criteria, paragraphing, vocabulary and much more. This page has tips for Academic writing task 1 and GT writing task 1 (see bottom of page).
IELTS Writing Task 1 Information
- IELTS recommend you spend no more than 20 mins on writing task 1. However, the time is yours to manage as you wish.
- You should write over 150 words.
- IELTS writing task 1 is worth only about 33% of your total writing marks.
- Task Achievement (25%)
- Coherence & Cohesion (25%)
- Vocabulary (25%)
- Grammar (25%)
- : IELTS Writing Task 1 Band Scores
- Academic writing task 1 is a report on a chart (bar chart, line graph, pie chart, table, map, diagram/process). See below for practice charts, model answers, tips etc.
- General Training writing task 1 is a letter only. GT letter writing tips can be found towards the bottom of this page. Click here for Information about GT Writing Differences. There are tips for letter writing, further down this page.
- All words will be counted and all numbers count as one word. See this page: How Words are Counted
- For more information about IELTS test rules, tips etc, see this page: IELTS Test 1 FAQ
IELTS Writing Task 1 Practice Charts
A collection of useful IELTS writing task 1 practice samples to develop your writing at home.
IELTS Charts for Practice : Academic Test Only
- Academic students may get bar charts, tables, line graphs, pie charts, maps and diagrams (processes).
IELTS Letters for Practice : GT Test Only
- GT students will only be given letters for task 1. GT students can find more tips lower down this page.
IELTS Writing Task 1 Tips & Free Videos
Free IELTS writing task 1 tips and videos for the right techniques and understanding the test more clearly.
- Essential Tips : How to Prepare for Writing Task 1
- Tips : How Many Words Should you Write?
- Tips: What tense to use in writing task 1?
- Tips : Penalty for Under the Word Count
- Video : How to Describe a Bar Chart with model answer
- Video : Map Language: 1
- Video: Conclusion or Overview Tips
- Video : Vocabulary for Accurate Data
- Video : How many Paragraphs
- Video : Official Writing Answer Sheet Tips
- Video : Line Graph 4 Main Sentences
- Video : Line Graph How to Write a Complex Sentence
IELTS Bar Chart Video
Learn how to describe a bar chart in IELTS writing task 1. You can find a model answer for this lesson here: Model Answer .
Writing Task 1 Model Answers
IELTS model answers for charts, graphs, diagrams, maps and tables.. Each sample answer is estimated band score 9.
- Diagram Model Answer
- Bar Chart & Pie Charts Model Answer
- Table Model Answer
- Map Model Answer
- Line Graph Model Answer
- Bar Chart Model Answer
- Pie Chart Model Answer
- Bar Chart of Age Groups Model Answer
- Table Future Form Model Answer
- Line Graph & Bar Chart Model Answer
- Practise at Home: IELTS Sample Practice Charts
IELTS Writing Task 1 Practice Lessons
IELTS writing task 1 free practice lessons to help you develop skills and understand about the requirements of task 1 academic. More lessons will be added over time.
- Table & Pie Charts
- IELTS Diagram Rain Water
- Two Line Graphs: Exercise & Model
- IELTS Diagram Paragraphs and Organisation
- IELTS Life Cycle Diagram: Model & Gap Fill
- Bar Chart of Change over Time
- IELTS Line Graph Gap Fill Exercise
- IELTS Diagrams: Practice Exercise
- IELTS Line Graph: Vocabulary List
- IELTS Line Graph: How to Describe Guidelines
- IELTS Line Graph: Exercise & Model
- Task 1 Introduction Paragraph Practice
- IELTS Map: Comparison Exercise
- IELTS Two Charts Practice: Pie Chart & Bar Chart
- IELTS Bar Chart: Practice Exercise
- IELTS Diagram Water Supply
- Grammar Accuracy: Practice & Tips
- IELTS Bar Chart: Introduction & Overview Practice
- IELTS Pie Chart: How to Describe a Pie Chart Step by Step
- IELTS Diagram: Introduction & Overview Practice
- Introduction Paragraph: Common Errors
- IELTS Bar Chart Sample Answer
IELTS General Training Letter
The following links are for IELTS candidates who are preparing for the General Training Writing Test. Your task will be asked to write a letter. You will not be writing a report as in the Academic Test. Use the links below to help you prepare:
10 Essential Tips for IELTS Letter Writing
How to Improve your IELTS GT Letter
Differences between GT & Academic Writing
General training model letters and practice exercises:
- Apology Letter: Model Answers Formal & Informal
- Amendment Letter: Model Answer 2017
- Complaint Letter: Model Answer
- Complaint Letter: Error Correction
- Letter to a Friend: Model Answer
- Invitation Letter: Model Answer
………………
FREE SUBSCRIBE: Get New Lessons & Posts by Email
Type your email…
Advanced IELTS Lessons & E-books
Recent Lessons
50% discount advanced ielts lessons & e-books final day, answers to age group bar chart lesson, ielts bar chart of age groups 2024, 50% discount: advanced ielts lessons & e-books, ielts topic: urban planning, ielts listening transcripts: when and how to use them.

Click Below to Learn:
- IELTS Test Information
Copyright Notice
Copyright © Elizabeth Ferguson, 2014 – 2024
All rights reserved.
Privacy Policy & Disclaimer
- Click here: Privacy Policy
- Click here: Disclaimer
Return to top of page
Copyright © 2024 · Prose on Genesis Framework · WordPress · Log in
IELTS Writing Task 1 – Process Example Essay 1
In this post, we will look at a Writing Task 1 Academic process essay example from the IELTS writing task 1 Academic Test. Students often ask if the questions are repeated year after year and the answer is no, but the type of chart, graph or process can be.
There are so many questions written each year, you may find you practice answering various questions on different topics. It is best practice to learn how to answer each one of the various types of writing task 1 questions , from bar charts, line graphs, maps, process etc.
If you would like to learn how to structure a process essay please click the button below >
Take a look at the IELTS Writing Task 1 Academic essay example below >>
*This process question and answer were provided by a student. IELTS Achieve did not design this question*
The picture illustrates the different life stages of a salmon.
Overall, it can be observed that there are eight phases in the life cycle of a salmon, beginning with laying fertilized eggs by mature salmons in the river and ending with producing its own sets of fingerlings in the same river.
To begin with, mature salmons will produce fertilized eggs in the river and then the incubation period starts, which nurtures and helps the eggs to hatch. Next, the fertilized eggs will hatch into a freshwater hearing. These hearings will proceed to an estuary where they can mingle with other hearings.
In the subsequent stage, estuary hearings will then journey to a rearing area where they will join other hearings to develop into medium sized salmons. Afterwards, they will travel together towards the ocean to become fully grown salmons. Finally, the salmons will then proceed to the same river to produce fertilized eggs for the survival of its species.
Word count 159 / Band score 8

- Task Achievement – The answer provides a paraphrased question, to begin with, followed by an overview that gives the reader key information.
- Coherence and Cohesion – The answer has been divided into clear logical paragraphs.
- Lexical Resource – There is evidence of paraphrasing, synonyms and some less common words.
- Grammatical Range and Accuracy – The answer has no grammatical errors. The sentences are mainly made up of multiple clauses and have a variety of structures.
We hope you found this post useful in helping you to study for the IELTS Test . If you have any questions please let us know in the comments below or on the Facebook page.
The best way to keep up to date with posts like this is to like us on Facebook , then follow us on Instagram and Pinterest . If you need help preparing for the IELTS Test, join the IELTS Achieve Academy and see how we can assist you to achieve your desired band score. We offer an essay correction service, mock exams and online courses.
Related Posts
You have a full-time job and doing a part-time evening course: semi-formal letter [ielts general writing task 1 ].
You should spend about 20 minutes on this task. You have a full-time job and are also…
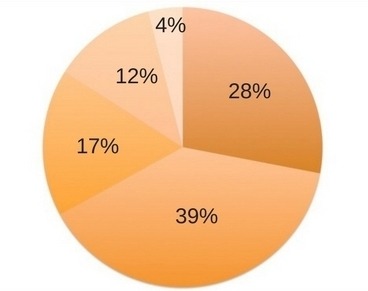
IELTS Academic Writing Task 1 – Lesson 1 – Pie Charts
This post will help you to write a successful pie charts essay, with step by…
Leave a Comment Cancel Reply
Your email address will not be published. Required fields are marked *
Save my name, email, and website in this browser for the next time I comment.
- A Beginner’s Guide to IELTS
- Common Grammar Mistakes [for IELTS Writing Candidates]
Writing Correction Service
- Free IELTS Resources
- Practice Speaking Test
Select Page
How to Structure IELTS Writing Task 1 Essays
Posted by David S. Wills | Aug 24, 2020 | IELTS Tips , Writing | 1
I have written many times about structure on this website, but mostly I have focused on task 2 . Today, however, I am going to take some time to show you how to structure IELTS writing task 1 essays . This often seems like a mystery but in fact it is quite simple and you can usually follow a pretty basic template.
I am going to divide this lesson into two parts. First, we will deal with the IELTS Academic exam and then we will look briefly at the IELTS General exam because these require different structures. Also, keep in mind that IELTS academic writing includes line graphs, pie charts, bar charts, maps, and more, so each of these might require some changes to the essay structure.
IELTS Academic Writing Task 1 Structure
When you do IELTS academic writing task 1, you may find yourself presented with one (or more) of the following:
- Process diagram
These require quite different language but generally you can apply a similar essay structure to all of them. Whether you are writing about a line graph or a table, you can pretty much use this IELTS writing task 1 template :
Let’s establish what “group of information” means
When you are doing IELTS Academic writing task 1, you need to examine the data and then describe it. To do this, you cannot just take a random approach and write about the different features of the data. Instead, you need to highlight the important parts.
This can be difficult, so let’s take an example.
In this line graph, we only have two lines to write about. Clearly, we could write one paragraph about men and one paragraph about women. Easy! Our structure would look like this:
To be honest, that is a very, very easy graph to describe so it was not a challenge. Let’s choose something more difficult to explore:
This is not a terribly difficult line graph to describe, but it presents a challenge for our IELTS writing task 1 structure template. How should we group these three lines?
One option is to structure it like this:
Another option is to break the information down according to time:
Grouping by Time vs Grouping by Type
The easiest way to group data for IELTS writing task 1 is to put them into different types. For example, in this line graph about a Caribbean island, we could potentially describe the number of people who stayed on the island in one paragraph and then the people who stayed on the ships in another paragraph.
But is this the best way?
When you write an essay with that structure, it becomes harder to compare the data. Remember that your question will always say “make comparisons where relevant.”
This suggests that grouping by time is better for one major reason: You can compare the different types of data over time. In this case, we can see the two sets of data are opposites, which gives us a great chance to make comparisons.
Sample Essay
Here is my sample essay about the Caribbean island.
The line graph displays the numbers of tourists that visited an unnamed Caribbean island between 2010 and 2017. The tourists are divided into two groups – those staying on cruise ships and those staying on the island itself – and these had a loosely inverse correlation. The total number of visitors, however, rose more or less continuously throughout the eight-year period. In the first year recorded, which was 2010, there were about twice as many tourists staying on the island as those staying on cruise ships. A year later, the number staying on cruise ships doubled to a half million, but this dropped back to around a quarter million in 2012. When the figures for tourists on cruise ships dropped, the number staying on the island rose quickly and over the coming few years, as this sudden increased levelled off, the number of people who stayed onboard their ship continued to grow again. Between 2012 and 2017, there were more and more visitors staying on cruise ships. From just a quarter million, this rose to two million, while the figures for those on the island levelled off at just one and a half million and then dropped slightly in the penultimate year, before finishing at one and a half. This meant that, for the final two years, more tourists stayed on cruise ships than on the island.
Can you write more than 3 paragraphs?
I would like to make clear that there is no such thing as the correct IELTS writing task 1 essay structure. It is possible to write a great essay with 2 paragraphs, but it is also possible to do it with 4 paragraphs. I would not recommend writing more than 4 paragraphs and I would certainly not recommend writing just 1! This would show a total lack of understanding of Coherence and Cohesion.
(P.S. – Read all about the number of paragraphs for IELTS writing task 2 here .)
Anyway, let’s look at an example of an essay that might be best described with 4 paragraphs:
For this task, we have to decide how to group the data. I personally find that the trend for burglary is more interesting than the others because it has much more of a change, which tells me that it should be described first. You could definitely write a paragraph that grouped car thefts and robberies together, but one is much more common than the other, so it might not work well.
I would take this approach:
Of course, writing this much could mean taking a long time and potentially not finishing your essay. I have written an article about how many words you should write for IELTS, which you can read here .
Sample Essay – 4 Paragraphs
Ok, let’s look at the essay I wrote about crime rates in Newport.
The line graph shows changes in crime rates over a ten-year period in the city centre of Newport. Three types of crimes are listed, two of which ended the period at roughly similar levels to where they began, and one experienced a major drop. In 2003, which was the beginning of the recorded period, burglary was the most common type of crime in Newport, with just under 3,500 cases reported. This rose slightly the following year, before entering into a long downward trend, reaching a low of about 1,200 in 2008. After this, the number of burglaries reported fluctuated until 2012. The number of car thefts was about 2,800 in 2003, and ended the period slightly lower, at 2,700. During the decade-long period, it fluctuated, reaching low points in 2006 and 2008. Car theft was the second most common type of crime in 2003, but the fall in burglaries meant that from 2008 onwards, they were the most common crime in Newport. Robberies were the least common crime and followed a somewhat similar trend to that of car thefts, starting and ending the period with around 700 incidents. It fluctuated only slightly during the ten-year period.
IELTS Writing Task 1 Pie Chart Structure
The previous examples were both line graphs because these are the most common type of IELTS academic writing task 1 question. However, in order to ensure you understand fully, I will also include a pie chart and show you how to structure your essay.
This is actually the most difficult IELTS writing task 1 question I have ever seen!
So how could we produce an IELTS writing task 1 essay structure to fit this?
The obvious choice seems to be writing 3 paragraphs, with 1 paragraph for each of the pie charts. That’s sensible, right?
Well, personally I think that would make it harder to draw comparisons between these data. Instead, I will group the data in terms of meals . I will look at the main meals in one paragraph and then snacks in a final paragraph. This allows me to compare all 3 nutrients!
My structure would then look like this:
**Please note that this is a quite advanced structure and it is difficult to do. I am including it to show you how it is possible to take various approaches and produce a great essay.
Sample Answer
This is my answer to the very difficult question about nutrients:
The pie charts show information about three different kinds of nutrients and their prevalence in typical American meals. There are four kinds of meal mentioned, including snacks. The figures for sodium and saturated fat are loosely similar, but for added sugar they are quite different. Sodium and saturated fat are both extremely common in typical American dinners. According to the pie charts, 43% of sodium is consumed at dinner time as well as 37% of saturated fat, but just 23% of added sugar is found in American dinners. Almost a third of sodium eaten by Americans is consumed at lunch, alongside more than a quarter of saturated fat. Breakfasts contain the lowest amount of these potentially unhealthy ingredients, at 14% sodium and 16% for both saturated fat and added sugar. The figures for snacks look quite different. More than four tenths of the added sugar consumed by Americans came from snacks, which also contained a fifth of the saturated fats and about a sixth of sodium.
IELTS General Training Writing Task 1 Structure
When you take the IELTS General Training (GT) writing test, you will see that task 1 requires you to write a letter. As such, there is no “recommended essay structure” that you can use.
Instead, you should aim to write a letter that follows typical letter-writing conventions and to use paragraphs logically to guide your reader.
How can you structure an IELTS general writing task 1 letter?
I would strongly recommend this sort of approach:
Of course, I will say here that you should not take this as a 100% perfect letter template . It is merely a suggestion and you should pay close attention to the actual task you are assigned. This template can usually be adapted to make a good letter, but sometimes you need to add or combine paragraphs. Also, we might have a short paragraph at the start and/or end of the essay to give some friendly greeting or send some kind regards.
For one thing, sometimes you need to give much more weight to one part of the question, which could require using two paragraphs for that and one for the other parts. An example would be:
How to Adapt an IELTS General Writing Task 1 Format Structure
The people who score band 8 or 9 in IELTS writing are not the ones who memorize structures and vocabulary, or who attempt to predict the questions they will encounter. Instead, these are people who can learn from others but create their own essays and letters by adapting good ideas to the present situation.
Let’s look at an example question from IELTS GT writing task 1.
A large company in your area has decided to spend a certain amount of money, either to sponsor a local children’s sports team for two years, or to pay for two open-air concerts. It has asked for feedback from the general public. Write a letter to the company. In your letter, – describe the benefit of sponsoring the sports ream – summarise the benefits of paying for the concerts – say how you think the company should spend the money
How can we structure a reply to this task?
I am going to use the IELTS general writing task 1 format structure that I suggested above, with two paragraphs of explanation in the middle because there are two sides to the issue. My structure would look like this:
Here is my sample answer to the above question:
Dear Sir or Madam, I am writing in response to your request for input on the decision about either spending money on a sports team or for two open-air concerts. Firstly, if you were to sponsor the children’s sports team, it would obviously be a great investment in the community. Nothing is more important to us than our children’s health and happiness. If you decided to sponsor the football team, this would mean a tremendous amount to many families. The concerts would also be beneficial in bringing the community together in a big event. This would foster some positive experiences and allow people to have fun together doing something they don’t normally do. It might also be good for local businesses. It is my opinion that you invest the money in the sports team as I think this would have the greatest benefit. For two whole years, parents would be able to watch their children play sports, and that is much better than going along to two concerts. Sincerely, David Wills
More Resources
This is a massive topic to cover and so I suggest that you continue reading once you are finished with this article. I have countless lessons on this website about IELTS writing task 1 (both academic and general) that you can read. I also have an IELTS writing task 1 template PDF file here .
More articles about structure:
- How to Describe a Bar Chart
- 7 Steps to Structuring an IELTS Essay
- How to Describe a Process Diagram
About The Author
David S. Wills
David S. Wills is the author of Scientologist! William S. Burroughs and the 'Weird Cult' and the founder/editor of Beatdom literary journal. He lives and works in rural Cambodia and loves to travel. He has worked as an IELTS tutor since 2010, has completed both TEFL and CELTA courses, and has a certificate from Cambridge for Teaching Writing. David has worked in many different countries, and for several years designed a writing course for the University of Worcester. In 2018, he wrote the popular IELTS handbook, Grammar for IELTS Writing and he has since written two other books about IELTS. His other IELTS website is called IELTS Teaching.
Related Posts
New Year Resolutions
February 6, 2018
IELTS Speaking Questions About the Environment
May 27, 2017
How to Structure a Paragraph
November 12, 2016
How to Start an Agreement Essay
August 7, 2023
I liked the course very much. It extended my knowledge about IELTS task 1 essay writing. This article is very insightful, points well explained and use of tutorials and examples to give a more clear picture of how task 1 essay should be tackled. Thanks for the great post! I liked how detailed and helpful it is.
Leave a reply Cancel reply
Your email address will not be published. Required fields are marked *
This site uses Akismet to reduce spam. Learn how your comment data is processed .
Download my IELTS Books
Recent Posts
- Past Simple vs Past Perfect
- Complex Sentences
- How to Score Band 9 [Video Lesson]
- Taxing Fast Food: Model IELTS Essay
- Airport Vocabulary
Recent Comments
- Daisey Lachut on IELTS Discussion Essays [Discuss Both Views/Sides]
- David S. Wills on Describe a Historical Period
- Siavash on Describe a Historical Period
- fabliha on IELTS Speaking Partners
- tufail khan on IELTS Discussion Essays [Discuss Both Views/Sides]
- Lesson Plans
- Model Essays
- TED Video Lessons
- Weekly Roundup

IELTS with Mark Teacher
How to write ielts task 1 academic ‘dynamic graphs’.
There are 3 main types of diagrams in Writing Task 1 Academic: a.) Dynamic graphs <– we’re talking about this one b.) Static graphs c.) Diagrams ( Maps , Processes )
In this post I will show you how to write about dynamic graphs.

If you want to practise the grammar and vocabulary of Dynamic Graphs, my 19-page workbook can help you make fewer mistakes and write longer, high-band sentences , click here to learn more
Want expert feedback on your own IELTS Task 1 Dynamic Essays?

The essay structure for every type of Task 1 is basically the same.
Structure: Task 1 – Academic 4 paragraphs 1.) Summary / Introduction 2.) Overview 3.) Body 1 4.) Body 2
What are dynamic graphs?
Dynamic graphs are graphs, charts or tables that contain data in 2 or more time periods.
For example:

The data is measured in 5 time periods – every 10 years from 1967 to 2007.

In this graph the data is measured in 3 time periods – every 5 years from 2005 to 2015.

In this graph, the data is measured in 2 time periods. In 2005 and in 2015.

In contrast, this is a Static graph because there is only data in one time period . In fact, there is no time period mentioned. In this case, you should approach the graph as a static graph.

Looking for more graph examples? My IELTS Writing Task 1 Workbook for Dynamic Graphs features 16 custom-made graphs and tables to help you practise the specific language and grammar for this type of task.
1.) Dynamic Summary / Introduction
The introduction paragraph in Task 1 only needs to be 1 or 2 sentences. In your introduction, you should present the main purpose of the graph to the reader in your own words . This means paraphrasing the official IELTS diagram description if you can.
Here is a sentence-making structure that presents the purpose of a dynamic graph.
Dynamic Tasks show data in 2 or more time periods and in English grammar time should come at the start or at the end of a sentence .
Here are some examples that use the table above:
The chart below shows the number of international students at a British University over a period of time.

- The line graph illustrates the amount of international students + from different continents + at a UK university + across a 30-year time period .
- The line graph explains the number of students from overseas + at a university in the UK + over a 30-year time span .
- The line graph shows how many students + from Asia, Africa, Europe and North American attended + a British university + from 1995 to 2015 .
Here are some more examples with dynamic graph example:
The table shows the obesity rate in one country over a period of time.

- The line graph illustrates the rate of obesity + among 4 age groups + over 34 years .
- The line graph shows obesity rates + between 18 to 74 year olds + over a 34-year time span .
- The line graph outlines the percentage of obese people + in 4 different age groups + between 1971 and 2005.
You try! – Write an introduction sentence for this dynamic task. Use the table above to help you.
The table shows average calorie intake in the United States over a period of time.

Click here to see my examples (47 More Words)
- The table reveals the average amount of calories consumed + by Americans + between 1970 and 2010.
- The table shows the median calorie intake + in the United States + over a 40-year time span .
- The table illustrates how many calories Americans consume on average + over 4 decades .
2.) Dynamic Graph Overview
The purpose of the overview paragraph is to give a short summary of the main features. Since dynamic graphs feature data over many years , the main overall features are usually changes . These changes include the most notable increases or decreases over a time period.
Importantly, you should describe these changes in words – do not use any numbers or data points from the graph.
So don’t say: “There was a [50%] increase” Say : “The numbers rose [by half] .”
Or, don’t say: “The numbers rose from [1,000 to 2,000]. Say: “The number [doubled]. ”
Or you can simply say [how much] the number increased or decreased by:
- “The number increased [a little / slightly]
- “The number increased [a lot / significantly / notably]
Let’s see some examples using the same Task 1 graphs from earlier:

Main features :
- Increases : Asia, North America
- Decreases : none
- Contrasts / Other features : Europe, Africa
– Overall, we can see that enrollments by students from Asian countries doubled throughout the time period, while North American students also grew . However, student numbers from Europe and Africa remained relatively consistent over the 2 decades.
– Overall, we can see that the number of Asian students at the university enjoyed steady, significant growth over the 20 years , with North American attendance also increasing in the last 5 years of the graph . Meanwhile, both European and African student numbers remained steady throughout the time period .
Here’s another example:
Take a look at the graphic and complete the task. The table shows the obesity rate in one country over a period of time.

Main features:
- Increases : every group – 30-44 and 45-64 grew the most continuously
- Contrasts / Other features : 18-29 and 65-74 didn’t change after 1999
– Overall, we can see that every single age group saw an increase in obesity to some extent, with 30-44 year-olds and 45-64 years-olds both increasing continuously and reaching more than double by the end of the time period. Meanwhile, those within the 18-29 and 65-74 age groups also experienced significant rises, though at least their rates seemed to level off from 1999 onwards .
– Overall, we can see that there was a notable increase in obesity among all age groups in the graph. In particular, 18-29 year-olds saw a three-fold rise over the time period , though at least the trend somewhat stabilised after 1999 . Meanwhile, those aged 30-44 and 45-64 experience a more than two-fold increase throughout the time period . Lastly, the eldest age range, the 65-74 year-olds, jumped by a similar amount , but they too levelled off from 1999 onwards .
You try! – Write an overview paragraph for this dynamic task. Use the table above to help you. The main features have been highlighted for you.
- Increases : total , grains , added fat the most || added sugar , fruit , meat, eggs and nuts slightly
- Decreases : dairy , vegetable decreased minimally
- Contrasts / Other features : none
- Overall, we can see that the majority of the food groups contributed towards a higher total calorie intake over the whole time period. The foods to see the biggest rise include grains and added fat, both rising by around a third. Added sugar, fruit, meat, eggs and nuts also added to the average intake. Only two categories accounted for fewer calories by the end of the time period, which were the dairy and vegetable food groups.
- Overall, we can see that the total calorie intake rose, with almost all food groups accounting for a higher calorie total by the end of the 40-year period. The most significant increases were by grains and added fat, while added sugar, fruit, meats, nuts and eggs also contributed, although to a lesser extent. The two exceptions were the dairy and vegetable food groups, whose contributions had dropped by 2010.
3.) Body Paragraphs
Next are the Body paragraphs of your Task 1 report. You can write 2 or 3 Body paragraphs.
Body paragraphs describe the main features in detail, including specific numbers from the graph. The data and features in the body paragraph should be similar in some way.
For example, you should describe the increasing categories together in 1 body paragraph. Then write about the decreasing / contrasting categories in a new body paragraph.
I usually use my overview paragraph to guide the structure of my body paragraphs.
Here is the complete example of Task 1 dynamic graphs from before:

Introduction: The line graph illustrates the amount of international students from different continents at a UK university across a 30-year time period .
Overview: Overall, we can see that enrollments by students from Asian countries doubled throughout the time period, while North American students also grew . However, student numbers from Europe and Africa remained relatively consistent over the 2 decades.
Body 1: (increases together)
In regards to the rising number of enrollments, the number of Asian students at the university is the most striking. In 1995, their numbers were 60, before growing consistently to around 90 in 2005 and eventually reaching 120 by 2015. Meanwhile, though the first half of the time period didn’t show an increase among North American students, in 2010 there was a notable jump in their numbers, rising from 40 to around 70 by 2015.
Body 2: (Other / Contrasts together)
Concerning the other two continents however, there were few changes. The amount of African students remained unchanged apart from a slight surge in 2010, rising to around 30, before returning to 20 as it had been in all other years. Likewise, European students fluctuated steadily between approximately 50 and 55 across the entire 20-year time span.

Introduction: The line graph outlines the percentage of obese people in 4 different age groups between 1971 and 2005.
Overview: Overall, we can see that there was a notable increase in obesity among all age groups in the graph. In particular, 18-29 year-olds saw a three-fold rise over the time period , though at least the trend somewhat stabilised after 1999 . Meanwhile, those aged 30-44 and 45-64 experience a more than two-fold increase throughout the time period . Lastly, the eldest age range, the 65-74 year-olds, jumped by a similar amount , but they too levelled off from 1999 onwards .
Body 1: (biggest increase)
Starting with 18-29 year olds, their overall increase in obesity was the most dramatic, despite still being the lowest among all age groups. In 1971, their obesity rate was only around 7 or 8%, but from 1976 there was a sharp increase, rising from 8% to almost 25% by 2001. After this, the rate remained at around 25% from the remainder of the graph.
Body 2: (more increases, but new paragraph because Body 1 is already quite long)
In contrast, not only did 30-44 year-olds and 45-64 years-olds see a huge rise in obesity rates, their numbers continued to climb even after 2001. In the case of the 30-44 age group, their rates doubled from 15 to 30 by 2001, but then climbed once again to 35% by 2005. Likewise, 45-64 year-olds leapt from around 17% to 35% in 2003, before the rate rose even higher to 40% by the end of the graph.
Body 3: (least eventful category – new paragraph because Body 2 is already long)
Finally, the oldest group in the graph, 65-74 year-olds, also saw a steep rise in obesity, but followed a similar pattern to the 18-29 years old in the latter part of the time period. They began at around 17%, and rose to just over 35% by 1999. However, similarly to the youngest group, their rates stabilised at that number and did not increase or decrease in the remaining 6 years.
You try! – Write the body paragraphs for this dynamic task. Use the examples above to help you.

Introduction : The table reveals the average amount of calories consumed + by Americans + between 1970 and 2010.
Overview : Overall, we can see that the total calorie intake rose, with almost all food groups accounting for a higher calorie total by the end of the 40-year period. The most significant increases were by grains and added fat , while added sugar, fruit, meats, nuts and eggs also contributed, although to a lesser extent. The two exceptions were the dairy and vegetable food groups, whose contributions had dropped by 2010.
Body 1: (Biggest increases)
Beginning with the biggest calorie contributors, grains supplied only 430 calories of an American diet in 1970, which had risen to 575 by 1990 and then to 625 by 2010. Similarly, added fat added the most calories of any other food group with 230 more calories, rising from 410 in 1970 to 640 in 2010.
Body 2: (Slight increases)
Meanwhile, several other food groups made contributions, although smaller. Added sugar constituted 400 calories per person in 1970, compared with 460 in 2010. In the same time period, fruit rose slightly from 70 to 85 calories on average. Lastly, meat, eggs and nuts saw a mere 15 calorie increase from 1970 to 2010.
Body 3: (Decreases)
However, two groups made up slightly less of an average American’s calorie intake than in 1970. Dairy fell from 265 calories in 1970, to 260 in 1990 and then to 255 in 2010. Likewise, the vegetable food group accounts for 5 calories less than in 1970, dropping from 125 to 120 by 2010.
There you go! A high-band approach, several examples and a reliable framework for you to use in your own IELTS Writing test.

Again, if you want to practise more dynamic graph vocabulary and grammar, there are 19 pages of custom-made graphs, exercises and examples to help you improve your writing skills. Click here to learn more !
Show m e what you’ve learnt – send me your IELTS essays!

<– Back to Task 1 Academic example essays and lessons.
Share this:
- Click to share on Twitter (Opens in new window)
- Click to share on Facebook (Opens in new window)
Related Posts

IELTS Writing Task 1 Essay Sample – Static – News Sources
Learn how to write high-band IELTS Task 1 essays like this with my IELTS Task 1 – Static Graph eBook: Click here or the picture below! Want me…

IELTS Writing Task 1 Essay Sample – Static – Tea & Coffee Habits

IELTS Writing Task 1 Essay Sample – Static – Library Use

IELTS Writing Task 1 Essay Sample – Process – Geothermal Electricity
The diagram below shows how geothermal energy is used to produce electricity. Want me to check your IELTS Task 1 essays? You can send me your own IELTS…

IELTS Writing Task 1 Essay Sample – Map – Norbiton Industrial Area
If you want to learn how to write IELTS Task 1 essays like this one, you can get Advanced eBook here: Or …. you can send me your…

IELTS Writing Task 1 – Maps e-Book – Out now!
I’m excited to announce another addition to my growing IELTS Writing Task 1 eBook series! The latest downloadable PDF is all about Maps! 19 pages of grammar and…

- IELTS Writing General Task 1
Home » IELTS writing general task 1
Whether you’re taking the IELTS academic or general exam, writing task 1 is the first section of the IELTS writing task. Our website contains numerous online resources to help you prepare for this part of your IELTS exam , with different IELTS vocabulary , writing exercises and task 1 sample essays .
It is important that you focus your preparation on the right information so that you’re able to write a well-structured letter for your task 1 exam.
Important information about IELTS General Writing Task 1
- General writing task 1 takes the form of a letter. Here candidates are asked to respond to a complaint, request information or explain a certain situation.
- You should spend no more than 20 mins on this test and you should write at least 150 words.
- Task 1 forms 33% of your total writing mark
- Grammar - 25%
- Vocabulary - 25%
- Task achievement - 25%
- Coherence and cohesion - 25%
- It is very important that candidates are able to express their ideas, provide general factual information and express opinions in this section of the exam.
- To get the best possible band score for your GT writing task 1, it is important that you familiarise yourself with the possible types of letter for this task.
Two main different types of letters :
- Formal letter - This could be to complain about a product/service or provide an apology or apply for a job,
- Informal letter - This type of question can require you to ask for advice, thank a colleague/friend or invite a friend to vacation with you. Remember that you should write at least 150 words.
Practising the various types of letters is important so that can understand what the right vocabulary, style and tone is for each kind of letter.
Preparation tips for IELTS General Writing Task 1
- Practice spending no more than 20 minutes on this task. If you practice enough beforehand, you’ll be able to stay within these limits during your exam.
- Make sure that you always read the question thoroughly and understand what you need to do.
- The general task 1 normally comes with 3 bullets, requesting information, for example: “You moved to a new country and you want to write a letter to your former colleague.
In your letter, you should:
- tell him/her where did you go and what you are doing there (job)
- describe your feeling
- invite your friend to come.”
Be sure that you have mentioned all three of these bullet points. The best is to write a paragraph about each of these to make sure that you have covered all the information.
- Leave yourself some time at the end to check your paper so that you don’t lose any unnecessary points.
- It is important to learn new IELTS vocabulary before your exam. Keep a notebook of new words, phrases and idioms that can help you improve your vocabulary score. Make that you know how to use these new words accurately, in the right context.
- NEVER use shortened versions of a word like you would in a text.
Here we have some sample general task 1 essays and useful English phrases to use in your exam.
The following tutorials will help the IELTS candidate prepare for their general exam. This part of the exam differs from the academic section and you will be asked to write a letter instead of interpreting a graph.
- How to write informal letters
- Best general task 1 structure
- Sample general Task 1 letter
- How to expand your IELTS vocabulary
- IELTS General Writing Task 1: Letter samples, phrases and tips
- An ex-examiner reviews a Task 1 informal letter
- IELTS Sample Letters – Band 9
- How to Plan and Write IELTS Task 1 Informal Letters In 20 Minutes
- Why students fail IELTS General Task 1
We also have useful tutorials to help you prepare for the IELTS Academic :
- Academic task 1 sample essays
- How to get band 9 in IELTS academic task 1
- How to describe a pie chart for IELTS
- Free Essay Band Score Evaluation
- Sign up to claim your free IELTS materials
- Jump to Band 7 or it’s Free
- IELTS Writing Evaluation
- IELTS Band Score Calculator
- Book Your Online IELTS Test
- Sample Topic Answers
- Useful Sentences
- Sample Task 2 Questions 2022
- Introduction to Paraphrasing
- Model Band 9 Essay
- Five Band 9 Words
- Model Band 7 Essay
- Differences Band 9 vs Band 7 Essay
- Band 6.5 Essay
- Academic Collocations
- Topic Sentences
- Discuss Both Views
- Tutorial: To What Extent Essays
- Paraphrasing Introductions
- Essay Structures
- Essay Plans
- Describe a Pie Chart
- Using Percentages
- Map Vocabulary
- Describe Flow Charts
- Describe a Bar Chart
- How to get Band 9
- AT 1 Sample Questions 2022
- Describe a Graphic
- GT Task 1 Questions 2022
- IELTS Vocabulary
- Google Play / Podcasts
- Apple Podcast
- Android App
- Task 2 Sample Questions
- AT 1 Questions
Company addresses: HK Office: BW ENGLISH SERVICES HK Ltd, Unit 2512, 25/F, Langham Place Office Tower, 8 Argyle Street, Mongkok, Hong Kong UK Office: BW ENGLISH SERVICES, 120 High Road, East Finchley, N29ED, London, England, United Kingdom +44 20 3951 8271 ($1/min).

All IELTS Academic Writing Task 1 Types (+Tips & Examples)
IELTS Academic Writing Task 1 can be a challenging test for many students. One of the reasons for this is the variety of question types that may appear on the test, including bar charts, line graphs, pie charts, tables, maps, diagrams, and more. However, understanding the different types of questions and how to approach them can make all the difference in achieving a high score.
In this blog post, we will explore all of the different types of IELTS Academic Writing Task 1 questions that may come up on the test. We will also provide examples and tips on how to approach each type of question, so you can feel confident and prepared on the test day.
Types of IELTS Academic Writing Task 1 Question
Here are all of the different IELTS Academic Writing Task 1 question types you need to know:
1. Describing a Line Graph
Line graphs are used to show trends or changes over time.

- What is the chart representing?
- What is the unit of measurement?
- Is there a specific time frame or interval shown?
- How many lines are displayed on the chart?
- What is the tense used in the description of the chart?
- Study the x-axis and y-axis labels and the units of measurement.
- Look for trends, fluctuations, and significant points on the graph.
- Introduction: Paraphrase the question.
- Identify the main trend(s) or pattern(s) in the graph.
- Highlight the main trends or patterns.
- Provide a broad description of the data, including any significant changes or fluctuations.
- Describe the trend and the significant changes.
- Break down the data by showing specific data points and trends.
- Compare and contrast the data if applicable.
- Use linking words and phrases to connect the data points and trends.
- Use a variety of verbs to describe trends, such as “rise,” “increase,” “grow,” “fall,” “decrease,” “drop,” and “level off.”
- Use adjectives to describe the degree of change, such as “dramatic,” “significant,” “moderate,” or “slight.”
- Use linking words and phrases to connect ideas and show relationships, such as “while,” “although,” “despite,” and “due to.”
- Use the simple present tense to describe general truths or ongoing trends, such as “the data shows,” “the graph indicates,” or “the trend is.”
- Use the past tense to describe specific data points or changes, such as “in 2015, the figure was,” “there was a sharp increase in,” or “the numbers fell dramatically.”
- Sample line graph and model answer:

It is important to identify the key features of the graph, such as:
- The highest and lowest points
- The overall trend
- Any significant changes
2. Describing a Bar Graph
Bar graphs are used to compare data between different items or groups.

- What is the main subject of the bar chart?
- What are the units of measurement used?
- Are the bars arranged in any particular order?
- How many categories or groups are being compared?
- What is the overall trend displayed in the chart?
- Identify the different categories on the x-axis and the values on the y-axis.
- Look for comparisons and contrasts between the bars.
- Identify the main differences or similarities between the categories.
- Compare the highest and lowest bars and any significant differences.
- Provide a brief description of the data, including any significant differences.
- Describe the comparison between the items or groups.
- Break down the data by showing specific data points and comparisons between the categories.
- Highlight the significant differences.
- Use linking words and phrases to connect the data points and comparisons.
- Use appropriate adjectives to describe the size or quantity of each category, such as “large,” “small,” “significant,” or “minor.”
- Use linking words and phrases to compare and contrast categories, such as “in contrast,” “on the other hand,” and “similarly.”
- Use the simple present tense to describe general truths or ongoing comparisons, such as “the chart shows,” “the data indicates,” or “the difference is.”
- Use the past tense to describe specific data points or comparisons, such as “in 2015, the figure for A was,” “B had a higher percentage than,” or “there was a significant contrast between.”
- Sample bar graph and model answer:

- The highest and lowest bars
- The most and least popular items
- Any significant differences
3. Describing a Pie Chart
Pie charts are used to show data percentages of a whole.

- What does the pie chart represent?
- What are the percentages or proportions shown?
- Are there any significant differences between the sections of the chart?
- What is the largest or smallest section of the chart?
- What conclusions can be drawn from the chart?
- Identify the different categories and their corresponding percentages.
- Look for the largest and smallest slices and any notable differences.
- Identify the largest and smallest slices and any significant differences.
- Compare the largest and smallest slices and any significant differences.
- Provide a brief description of the data.
- Describe the proportions of the groups
- Highlight the most and least represented groups
- Use percentages and fractions to describe each category.
- Use adjectives to describe the degree of difference between categories, such as “marked,” “slight,” or “significant.”
- Use linking words and phrases to show relationships between categories, such as “corresponding to,” “accounting for,” and “contributing to.”
- Use the simple present tense to describe general truths or ongoing proportions, such as “the pie chart illustrates,” “the data suggests,” or “the largest slice is.”
- Use the past tense to describe specific data points or proportions, such as “in 2015, the percentage for C was,” “D accounted for a smaller proportion than,” or “there was a slight shift in the distribution from.”
- Model answer:

It is important to identify the key features of the chart, such as:
- The largest and smallest segments
- The most and least represented groups
4. Describing a Table
Tables are used to present data measurements in a structured format.

- What is the main topic or subject of the table?
- What are the categories or variables being compared?
- How are the values arranged within the table?
- Are there any significant differences or patterns in the data?
- What are the highest or lowest values in the table?
- Study the headings and units of measurement for each column and row.
- Look for patterns, rankings, and comparisons.
- Identify the highest and lowest values and any significant differences.
- Break down the data by showing specific data points and comparisons between the rows and columns.
- Highlight the most and least profitable professions.
- Use appropriate adjectives to describe the size or quantity of each row or column, such as “lowest,” “highest,” “most,” or “least.”
- Use linking words and phrases to compare and contrast rows or columns, such as “in contrast,” “on the other hand,” and “similarly.”
- Use the simple present tense to describe general truths or ongoing rankings or comparisons, such as “the table presents,” “the data compares,” or “the figures show.”
- Use the past tense to describe specific data points or rankings, such as “in 2015, the number for X was,” “Y had the highest total of,” or “there was a significant difference between Z and.”

It is important to identify the key features of the table, such as:
- The highest and lowest values
- The most and least profitable professions
5. Describing a Map
Maps are used to show a location or a facility such as a street map and a plan of a building or site.

- What does the map show?
- What is the scale of the map?
- Are there any significant features or landmarks highlighted on the map?
- What is the overall trend or pattern shown in the map?
- What conclusions can be drawn from the map?
- Identify the key features of the map, such as roads, buildings, landmarks, and areas of open space.
- Look for patterns, such as the layout of streets or the distribution of buildings.
- Identify any changes or developments over time.
- Summarize the main stages and the overall process.
- The location of the shops or facilities.
- Highlight the distance between them.
- Describe the key features of the map in a logical and organized way.
- Use linking words and phrases to connect the different features.
- Use prepositions to describe the location of features, such as “to the north of,” “adjacent to,” or “surrounded by.”
- Use adjectives to describe the size, shape, or function of features, such as “large,” “narrow,” or “commercial.”
- Use the simple present tense to describe general truths or ongoing features or locations, such as “the map displays,” “the data identifies,” or “the area is.”
- Use the past tense to describe specific data points or locations, such as “in 2015, the building was,” “there used to be a park where,” or “the river flowed through.”

It is important to identify the key features of the map, such as:
- The location of different shops or facilities
- The distance between them
6. Describing a Process/Diagram
Process diagrams are used to show the stages or steps in a process and their order.

- What is the process being shown in the diagram?
- What are the main stages or steps in the process?
- Are there any key inputs or outputs shown in the diagram?
- Are there any significant changes or transformations in the process?
- What is the final outcome or result of the process?
- Identify the different stages or steps in the process and their order.
- Look for the inputs, outputs, and transformations that occur.
- Look for any significant changes or developments.
- Identify the main stages of the process and the inputs, outputs, and transformations that occur.
- Describe the main steps and the significant changes of the process in detail and the key features of each.
- Use linking words and phrases to connect the different stages.
- Use appropriate verbs to describe each stage of the process, such as “input,” “transform,” or “output.”
- Use linking words and phrases to show the sequence of stages, such as “after,” “before,” “subsequently,” and “finally.”
- Use the simple present tense to describe general truths or ongoing stages or transformations, such as “the diagram represents,” “the data outlines,” or “the process involves.”
- Use the past tense to describe specific data points or stages, such as “in the first step, the input was,” “there was a change in the output from,” or “the transformation led to.”
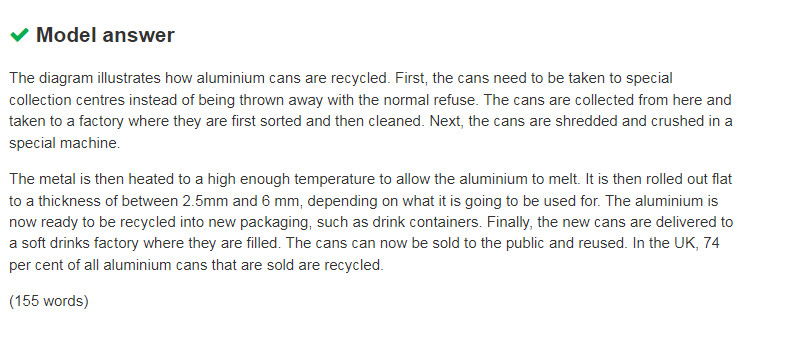
It is important to identify the key features of the diagram, such as:
- The starting and ending points
- The main steps
7. Describing Combination
A combination task may include two or more types of graphs or diagrams, and it requires candidates to compare and contrast the information presented.

- What types of charts or diagrams are included in the combination?
- What is the main topic or subject of the combination?
- How are the various elements of the combination related to each other?
- What is the overall trend or pattern shown in the combination?
- What conclusions can be drawn from the combination?
- Study the different elements of the visual representation and how they relate to each other.
- Look for patterns, trends, and comparisons between different types of data.
- Identify the different elements of the visual representation and how they relate to each other.
- Describe each element in detail and the key features of the different types of graphs or diagrams
- Compare and contrast the data presented.
- Use linking words and phrases to connect the different elements and show their relationships.
- Use appropriate language for each type of visual representation and show how they are related to each other.
- Use linking words and phrases to connect ideas and show relationships, such as “whereas,” “in comparison,” “in addition,” and “moreover.”
- Use appropriate tenses for each type of visual representation and make sure they are consistent throughout the analysis.
- Use linking words and phrases to connect ideas and show relationships between different tenses, such as “while,” “although,” “despite,” and “due to.”

In conclusion, the IELTS Academic Writing Task 1 test can be challenging, but understanding the different types of questions and how to approach them is crucial to achieving a high score. By familiarizing yourself with line graphs, bar charts, pie charts, tables, maps, and combinations thereof, you can feel confident and prepared on test day.
Remember to focus on the key trends, comparisons, components, data points, and features, and use specific data to support your analysis. With these tips and examples in mind, you can be well on your way to achieving your desired score.
Related Posts

25 Expert Tips For IELTS Academic Writing Task 2 Success

21 Complex Sentence Structures For IELTS Writing Task 1

100 Common Phrases For IELTS Academic Writing Task 2
Leave a comment cancel reply.
Your email address will not be published. Required fields are marked *
Save my name, email, and website in this browser for the next time I comment.
Plans & Pricing

- Writing Correction
- Online Prep Platform
- Online Course
- Speaking Assessment
- Ace The IELTS
- Target Band 7
- Practice Tests Downloads
- IELTS Success Formula
- Essays Band 9 IELTS Writing Task 2 samples – IELTS Band 9 essays
- Essays Band 8 IELTS Writing – samples of IELTS essays of Band 8
- Essays Band 7 IELTS Writing – samples of IELTS essays of Band 7
- Essays Band 6 IELTS Writing – samples of IELTS essays of Band 6
- Essays Band 5 IELTS Writing – samples of IELTS essays of Band 5
- Reports Band 9 IELTS Writing – samples of IELTS reports of Band 9 (Academic Writing Task 1)
- Reports Band 8 IELTS Writing – samples of IELTS reports of Band 8
- Reports Band 7 IELTS Writing – samples of IELTS reports of Band 7
- Letters Band 9 IELTS Writing Task 1 – samples of IELTS letters of Band 9
- Letters Band 8 IELTS Writing – samples of IELTS letters of Band 8
- Letters Band 7 IELTS Writing – samples of IELTS letters of Band 7
- Speaking Samples
- Tests Samples
- 2023, 2024 IELTS questions
- 2022 IELTS questions
- 2021 IELTS questions
- 2020 IELTS questions
- High Scorer’s Advice IELTS high achievers share their secrets
- IELTS Results Competition
- IELTS-Blog App
IELTS Report Samples of Band 9
- IELTS Reports- Band 9 , IELTS Writing Samples
Here you can find IELTS Report samples of Band 9, written by a native English speaker and a former IELTS examiner. Robert Nicholson is the co-author of ‘High Scorer’s Choice’ IELTS Practice Tests book series, created in collaboration with Simone Braverman, the founder of this website.
New reports are being added weekly. Last updated: September 15, 2022
IELTS Band 9 sample report 1
IELTS Band 9 sample report 2
IELTS Band 9 sample report 3

IELTS Band 9 sample report 4
IELTS Band 9 sample report 5
IELTS Band 9 sample report 6
IELTS Band 9 sample report 7
IELTS Band 9 sample report 8
IELTS Band 9 sample report 9
IELTS Band 9 sample report 10
IELTS Band 9 sample report 11
IELTS Band 9 sample report 12
IELTS Band 9 sample report 13
IELTS Band 9 sample report 14
IELTS Band 9 sample report 15
IELTS Band 9 sample report 16
IELTS Band 9 sample report 17
IELTS Band 9 sample report 18
Related posts:
- IELTS Essay Samples of Band 9 Last updated: May 3, 2023 Here you can find IELTS...
- IELTS Letter Samples of Band 9 Here you can find IELTS Letter samples of Band 9,...
- IELTS Report, topic: Pie charts of greenhouse gas emissions (from IELTS High Scorer’s Choice series, Academic Set 4) This is a model response to a Writing Task 1...
- IELTS Report, topic: Bar chart of average rainfall by month (from IELTS High Scorer’s Choice series, Academic Set 1) This is a model response to a Writing Task 1...
- IELTS Report, topic: Bar chart describing Scotland’s exports (from IELTS High Scorer’s Choice series, Academic Set 3) This is a model response to a Writing Task 1...
2 thoughts on “IELTS Report Samples of Band 9”
Thank you very much for all the writings that helps me a lot.
Leave a Reply
Your email address will not be published. Required fields are marked *
Save my name, email, and website in this browser for the next time I comment.

- Listening Overview
- Listening Tips
- Listening Online Practice
- Reading Overview
- Reading Tips
- Reading Online Practice
- GT Reading Online Practice
- Writing Overview
- Writing Tips
- Writing Common Mistakes
- Test Your Writing Skill
- Master Writing Task 1
- Writing Task 1 Essays
- Writing Task 2 Essays
- Writing Topics
- Speaking Overview
- Speaking Tips
- Band 7 in Speaking Test
- Speaking Test Summary/Audio
- Speaking Tests with answers
How to Master IELTS Writing Task 1
- In IELTS Writing Task 1

- You must be able to answer the task within the 20 minutes recommended time, to ensure that you leave at least 40 minutes for Writing Task 2. For Task 1, most test papers ask you to describe data (the other possibilities are maps, flow diagrams or image comparison tasks). As it is most probable that you will get a data task, we have developed a 3–step process for dealing with data quickly, which many of our candidates have used to get very high IELTS Bands.
- Let’s introduce this process and show you how it works, using examples from the sample essays given here:
- Read the task 1 instructions, and look at the chart(s), graph (s) or table(s) with it, for about 1 minute. Make sure that you understand the following:
- Is this ‘static data’ or ‘movement data’? What are the timescales?
- The difference is that static data shows 1 timescale only, while movement data shows a number of different timescales. For example, a static data chart may show the population of 5 different cities in 2002, and you need to compare the numbers. A movement data chart would show the 5 cities in 2002 and 2012, and you need to compare the changes in the situation from one timescale to the other.
- Example Chart 1 (below) is an example of static data:

- Example Chart 2 (below) is an example of movement data:

- It is essential to be clear about this difference, because the way that you write about the data will be different. In a static chart, you will compare the sizes and proportions of the figures. In a movement chart, you will also compare the changes in the figures over time.
- Remember that in Task 1 data, the information could be all static, or all movement, or occasionally a combination of both. This book gives you lots of examples of describing both static and movement data.
- Is there a timescale on one axis? (eg years, months, hours etc)
- If there is a timescale, is this showing the past, present, future; or a combination?
- (eg 000 of people, or degrees centigrade, or prices in $ etc)
- Be clear about any ‘multiples’ in the figures (eg “000 people” or “millions of tonnes.”)
- To illustrate this, look at Example Chart 3 below:

- This is a movement Chart (because the timescale shows 7 different days). No year (eg 2012 etc) is shown, so you should use the present simple to describe the data. The axes are days of the week and 5 separate countries. The units shown are electricity megawatts (but not in thousands or millions.)
- Remember that the information about the timescale(s), the axes and the units may be located on the chart itself, or it may be in a caption, and/or contained in the Task description. Check everywhere!
- Remember that in the IELTS test, you can of course write your notes on the test paper as you wish.
- Don’t be distracted by the fact that some Tasks have bar chart formats, while other Tasks have line graphs, pie charts or tables. The way that the data is presented could be any of these formats, and you need to practise analysing data from all formats. You should approach the data in the same way, using the 3-step process.
- In the Test, you have now completed Step 1, and you are sure about these vital points. You can now go to Step 2 of the process.
- This means deciding which groups of the data are similar to each other. For example, look at example chart 3 again and ask yourself which countries have a similar pattern in their use of electricity? Are any of the countries very different?
- The answer is that we can group France and Japan together, because their pattern is similar (their electricity figures fluctuate during the whole week.)
- We can also group Canada and Russia together, because they have a similar pattern (their electricity figures rise considerably towards the weekend.)
- Argentina is different from these 2 groups, because it declines towards the weekend.
- This is a classic example of grouping data together. It’s essential for you to be aware that all IELTS Task 1 data Tasks include this concept of groups, because the examiner wants to see that you can identify groups, trends and exceptions.
- When you have decided on the groups of data, identify the trends and exceptions that the groups show. A trend means a pattern which is common or shared by a group. An exception is a group or an element which behaves differently from the trend(s).

- This is a movement chart (it shows 9 different timescales along the top axis.) The units shown are number of passengers and dollars per ticket. We can group the figures into two groups (passengers and ticket prices), and we see that the higher the passenger number, the higher is the cost of the ticket. This is true from 6am to 4pm and again from 8pm to 10pm. However, the situation for the two groups at 6pm is different. Here, a high number of passengers pay a very low-ticket price.
- We can now decide on the trend and the exception. The trend is for high passenger numbers to match high ticket prices. The exception is the 6pm time, when the reverse is true. Remember that in the test, you should look for trends and exceptions within each chart and also when comparing 2 or 3 charts together. The sample essays here have examples of how to do this.
- When you have grouped the data and decided on the trend(s) and the exception(s) in this way, you are ready to select some figures to use in your essay.
- Remember that the Task 1 instruction always says “Summarise the information. Select and describe the main features, and make comparisons where relevant. Write at least 150 words. ” Main features in data Tasks means the key figures which demonstrate the groups, trends and exceptions which you have identified. It is impossible (and totally unnecessary) to select more than a few figures to use in your Task 1 essay.
- For example, the example chart 3 (electricity in hospitals) contains 35 figures; example chart 4 has 18 figures. In Task 1 you may have up to 3 such charts to describe!
- You should use your red pen to highlight the figures on the charts which show the most noticeable figures in each group of data, because this will give you the trend. For example, in example chart 3, you should not list all the figures for France and Japan. If you say “France and Japan fluctuate around 32, this shows you understand the trend and have selected a key figure in each country to demonstrate this.
- Taking example chart 4 as another example, you do not need to list all the figures in the ‘Ticket price’ group. If you say “The 8am passenger surge is matched by a high price of $29, followed by a peak of $31 at midday and a decrease to $17 by 4pm” or similar, you show that you have seen the trend and can select the figures.
- It is very important to avoid the mistake of simply listing the figures that you see in the charts. You should never describe the figures in sequence from left to right, or from top to bottom. You must show that you can group data, identify trends/exceptions, and select the key figures. If the examiner feels that you have done this in your essay, you will increase your Band score considerably, even if there are some mistakes in your English.
- You should spend about 5 minutes maximum on Steps 1 and 2 in the process. By this stage, you have about 15 minutes remaining for Task 1, so you need to work rapidly now.
- By this stage, you should have plenty of notes made with your red pen on the Test paper itself. We recommend that you do not make a plan for the Task 1 essay, because this would take too long, and your notes should be sufficient now. Using your notes, you can start writing your essay, and complete it in about 10 to 12 minutes.
- For your introduction, the examiner wants to see a clear, single sentence that shows you have analysed and understood the data, timescales and units involved. To do this, take the explanatory part of the Task instruction, and paraphrase it in your own words.
- For example, if the Task instruction includes the information:
- “The first graph below shows the weight (in tonnes) of fruit produced by a farm during each month in 2013, and also the amount (in tonnes) of fertiliser used. The second graph shows the volume of rainfall in each month (in millimetres.)”
- You can paraphrase this as:
- “The charts give data regarding the tonnage of fruit produced in a farm per month in 2013, the fertiliser used and the monthly rainfall in that year.”
- Another example Task is:
- “The table shows data about the average length of time (in minutes) that people of different ages spend in a consultation with family doctors in a number of countries.”
- Which you can paraphrase as
- “The chart gives information about the typical time that patients spend with doctors in various countries, split by age group.”
- In these two examples, the candidate has replaced as many words as possible from the Task with his own words. For example, “data > information, average > typical, a number of > various” etc. He has also varied the structure of the sentences, condensing the first example into one sentence and making the sentences slightly shorter.
- NOT include any figures or data (except the year(s) if given)
- NOT give any background to the topic or add any knowledge, opinions or ideas of your own. Save that for Task 2, where it is needed!
- NOT copy the complete Task instruction from the Test paper without changing/paraphrasing it. If you practise this, you should be able to write a good introduction sentence in about 1 minute, leaving enough time for the main body of the essay. Don’t spend longer than about 1 minute on this, because you need plenty of time to write the main body.
- You will gain marks by having a very clearly structured essay. To achieve this, you should describe each chart, table or graph in turn, explaining any trends or exceptions that you have seen between the groups of data.
- You should explain the trend at the beginning of each group, and then give your selected figures to illustrate. A simple example is:
- “Regarding x, the trend is a slow rise and then a fall, going from 100 to 10 and then down to 80.”
- You should try to compare any trends and/or exceptions that exist between the different charts and/or the groups. You should use the notes you have made on the test paper to remind you what to write, including the key figures you have selected.
- Here is an example, based on the example chart 3 (hospital electricity) that we mentioned in Step 2.
- “Regarding electricity, we see that consumption in the French and Japanese hospitals is roughly stable during the week, fluctuating around 32 and 18 mw for ( $i = 1; $i <10; $i++ ) {. In Canada and Russia, electricity use climbs dramatically towards the end of the week, going from 26 to 38 mw and from 12 to 24 mw. In Argentina, however, the use actually declines by almost half.”
- Please notice how this paragraph is organised. The candidate identifies the first group of data (French and Japanese hospitals), explains the trend (fluctuation) and gives just 2 figures to show how they fluctuate. He then identifies the second group (Canada and Russia) and explains the trend (increase), giving the start and end figures to illustrate the extent of the increase. He points out that Argentina is the exception, and has decided not to use a figure to illustrate this. This is acceptable, as he shows his understanding of the figures by writing “declines by almost half.” This demonstrates that he can see the proportion of the decline.
- A paragraph such as this will achieve a very high Band score in Task 1, provided the whole essay is of a similar standard.
- Your essay should then move on to discuss the next chart or the next group of data.
- A further example of a successful main body paragraph is this one, based on example Task 4 (the passenger numbers and ticket prices):
- “Passenger numbers peak 3 times during the day. For example, the number at 6am is 480, rising to 690 by 8am before falling again. There is then a peak of 700 at midday, followed by an afternoon decline to a low of 230 at 4pm. A third spike is at 6pm, reaching 670 before tailing off.”
- In this example, the candidate has used the first main body paragraph to describe the passenger numbers group. He has started by explaining the trend (showing that he sees 3 peaks), and then he describes each peak using a figure from the chart. He uses a variety of phrases to describe the changes (“peak/rise/fall/decline/spike/tailing off”) to show that he can use a wide range of vocabulary.
- The next paragraph in this essay is the following:
- “The ticket prices partially follow this pattern. The 8am passenger surge is matched by a high price of $29, followed by a peak of $31 at midday and a decrease to $17 by 4pm. However, the 6pm spike in passenger numbers is accompanied by a low of $1 in prices, with a subsequent rise to $22 at 8pm and a final levelling off.”
- Here, the candidate starts the paragraph by saying that he sees a trend (“ticket prices partially follow . . .”) and he then gives 3 figures to demonstrate this. He then introduces the exception by saying “However” and explains how the 6pm figure is different from the normal pattern, using the contrast between “spike” and “a low of $1 . . .” to illustrate.
- A good Task 1 data essay will have a main body containing between 1 and 3 paragraphs, depending on how many charts or groups you need to describe. Remember to make it very clear which chart or group you are describing at each point. You can do this by starting the sentence with the name of the group you are describing (eg “x declines dramatically”) or by saying “Regarding x” or “looking at x, we see that . . .” or “Turning to x, it is clear that . . .” or similar.
- Remember the Task instruction always says “Summarise the information. Select and describe the main features, and make comparisons where relevant. Write at least 150 words. ” This means that you should make it clear that you see the trends and the exceptions.
- To introduce the trends, use phrases such as “similarly/likewise/in the same way/a similar pattern or trend.” To introduce the exceptions, use contrast phrases such as “however/ by contrast/ by comparison/conversely.”
- Be careful of the tenses you use in the essay. If the data shows a past timescale which is finished, use the past simple. For example, if the data shows 2002 or 2002 plus 2012, use the past simple. If the timescale is the current year, or if no year is given, use the present simple. For example if the data shows the months January to June without giving the specific year, use the present simple. If the data includes a prediction about the future (eg ‘2030 estimate’) use phrases such as “The 2030 figure is predicted to be x’ or ‘the number for 2030 is estimated to be x.”
- While you are writing the main body (in paper-based test), try to count the number of words you have written at least twice, to make sure you aim for at least 150 words, but in (computer-based test) there is no need to count the number of words because you will find a word counter that counts what you type.
- After about fifteen minutes in the test, you should be finishing your main body paragraphs and starting to write the summary. This will usually be 1 sentence (a maximum of 3 sentences if there are several charts or groups in the Task.) The summary in a Task 1 essay is very different from the conclusion in a Task 2 essay. In Task 1, you must not give your opinion, or make any suggestions about the causes of the data in the Task. Instead, you should summarise the key trends and the key exceptions that you have described in the main body.
- An example (based on the example chart 4) is:
- “In summary, ticket prices increase broadly in line with passenger traffic, except during the evening rush hour when they actually fall.”
- This summary is simple, but it succeeds because it sums up the key groups, the trend and the exception in the data. Notice that the summary does not include any figures. Neither your introduction nor your summary should include figures.
- Another example of a very good summary is:
- “In summary, this farm generally employed the most fertiliser at seasons of high rainfall, and by contrast it produced the most fruit when both rainfall and fertiliser use were around their lowest.”
- This summary uses the phrase “by contrast” to emphasise the exception which exists in the data.
- Remember to start your summary by saying “in summary/to sum up/overall/to summarise.” Try to use a different phrase to begin your Task 2 conclusion when you come to write the Task 2 essay.
- When you have finished the Task 1 essay, you should have about 1 or 2 minutes remaining to check your work for grammatical and spelling errors, before putting it on one side so that you can start on Task 2. You need to make sure you finish Task 1 completely in 20 minutes so that you have enough time for Task 2.


IMAGES
VIDEO
COMMENTS
Here you will find IELTS Writing Task 1 Samples for a variety of common tasks that appear in the writing exam. The model answers all have tips and strategies for how you may approach the question and comments on the sample answer. It's a great way to help you to prepare for the test.
The resources below include an IELTS writing task 1 sample answer pdf. Line graph IELTS academic task 1 sample essay 26: Thermal conductivity of material at 25C. Line graph IELTS academic task 1 sample essay 7: January 2015 temperature variation in the Philippines. Line and bar chart IELTS academic task 1 sample essay 5: Common budget items chart.
Read my sample answer for this (unusual) task 1 here. IELTS Essay: Bridges. Read my sample answer for this topic here. The bar graph shows the total manufacturing production in percentages Asia, Europe, and the rest of the world. IELTS Task 1 Reported on May 7th. Read my sample answer here. Reported on IELTS May 1st. Read my sample answer here.
In your IELTS Academic Writing Task 1, you will be given with one or more graph (s) (i.e. bar, column, line or pie), table, flowchart, map or process diagram and you need to summarise the main information, compare data, show contrasts and trends, identify significant trends and describe a process. You should write between 150 to 200 words and ...
Paradise Island Map - IELTS Academic Writing Task 1 Answers. IELTS Academic Writing Task 1 Example 4 : Development of the village of Rye mouth - Map. IELTS Academic Writing Task 1 Topic: The development of cutting tools in the stone age - Diagram. IELTS Academic Writing Task 1 Example 3: Civic Centre - Map.
Sample Essay 1 - Pie Charts. The pie charts show the ratio of goods shipped from Great Britain from 2010 to 2015. The products are measured by percentage. Overall, over the five-year period, the most exported goods were machinery and vehicles. These two types of goods were predominantly wanted out of all of the categories.
A: Do pay attention to time - task 1 is worth one third of the total marks (while task 2 is worth two thirds), Don't let nervousness stop you from trying your best. Get more tips to help you prepare for the writing tasks. Task 1 - Take a look at the chart below and perform the task as outlined:
Task 1: The diagram below shows one method of manufacturing ceramic pots. The diagram illustrates the process of making ceramic pots. Generally, it contains of 11 steps, beginning with collection of the raw materials, and ending with finished pots. 6.5.
The Writing Task 1 of the IELTS Academic test requires you to write a summary of at least 150 words in response to a particular graph (bar, line or pie graph), table, chart, or process (how something works, how something is done). This task tests your ability to select and report the main features, to describe and compare data, identify significance and trends in factual information, or ...
The guide tells you everything you need to know about how Writing Task 1 essays and paragraphs should be structured, with an example question and model essay. IELTS Writing Task 1 Samples: The Major Question Types. Below are questions for each common infographic in IELTS Writing Task 1: bar charts, pie charts, line graphs, process diagrams, and ...
People doing the Academic test will write a report on a data set, map, or process. People doing General Training will write a letter. You must write 150 words or more. You should spend around 20 minutes on this part of the test. Task 1 is worth 1/3 of your total mark on the Writing test.
First, look at some excellent essay examples for writing task 1. There are quite a few useful links at the end of this article. Find a style or model you like and try to use some of the same phrases to describe a similar diagram, remembering to write at least 150 words. Try your hand at describing and comparing various diagrams and graphs.
Essay 2 Notice anything about the answer below? It is exactly the same as Essay 1. This is to demonstrate to you that all you are looking at in Task 1 graphs and charts is data. It does not matter how the data is visually represented, it is still just data. Many students get lost because the graphs look 'complex' or 'confusing '.
You should write over 150 words. IELTS writing task 1 is worth only about 33% of your total writing marks. Academic writing task 1 is a report on a chart (bar chart, line graph, pie chart, table, map, diagram/process). See below for practice charts, model answers, tips etc. General Training writing task 1 is a letter only.
In this post, we will look at a Writing Task 1 Academic process essay example from the IELTS writing task 1 Academic Test. Students often ask if the questions are repeated year after year and the answer is no, but the type of chart, graph or process can be. There are so many questions written each year, you may find you practice answering ...
IELTS general writing task 1 sample: You will be graduating from university and would like to invite your family to the ceremony. Write a letter of invitation to your parents. In the letter: - Explain that you have completed your studies. - Give details of the event, including time, date and dress code.
1.) Map Diagram Introduction / Summary. The introduction paragraph in Task 1 only needs to be 1 or 2 sentences. Like all IELTS Writing Task 1 essays, your introduction should present the main purpose of the graph to the reader in your own words. This means paraphrasing the official IELTS diagram description if you can.
Whether you are writing about a line graph or a table, you can pretty much use this IELTS writing task 1 template: Paragraph #1. Explain the basic facts of the image. Describe the general trend. Paragraph #2. Describe the first group of information. Paragraph #3. Describe the second group of information.
My IELTS Writing Task 1 Workbook for Dynamic Graphs features 16 custom-made graphs and tables to help you practise the specific language and grammar for this type of task. 1.) Dynamic Summary / Introduction. The introduction paragraph in Task 1 only needs to be 1 or 2 sentences.
The general task 1 normally comes with 3 bullets, requesting information, for example: "You moved to a new country and you want to write a letter to your former colleague. In your letter, you should: tell him/her where did you go and what you are doing there (job) describe your feeling. invite your friend to come.".
Types of IELTS Academic Writing Task 1 Question. Here are all of the different IELTS Academic Writing Task 1 question types you need to know: 1. Describing a Line Graph. Line graphs are used to show trends or changes over time. Source: ielts-writing.info. Analysis :
Here you can find IELTS Report samples (Academic Writing Task 1) of Band 9, written by a native English speaker and a former IELTS examiner. Robert Nicholson is the co-author of 'High Scorer's Choice' IELTS Practice Tests book series, created in collaboration with Simone Braverman, the founder of this website.
Step 3: Writing the essay. You should spend about 5 minutes maximum on Steps 1 and 2 in the process. By this stage, you have about 15 minutes remaining for Task 1, so you need to work rapidly now. By this stage, you should have plenty of notes made with your red pen on the Test paper itself.