- > Statistics
An Overview of Descriptive Analysis
- Ayush Singh Rawat
- Mar 31, 2021

Nowadays, Big Data and Data Science have become high volume keywords. They tend to become extensively researched and this makes this data to be processed and studied with scrutiny. One of the techniques to analyse this data is Descriptive Analysis.
This data needs to be analysed to provide great insights and influential trends that allows the next batch of content to be made in accordance to the general population’s liking or dis-liking.

Introduction
The conversion of raw data into a form that will make it easy to understand & interpret, ie., rearranging, ordering, and manipulating data to provide insightful information about the provided data.
Descriptive Analysis is the type of analysis of data that helps describe, show or summarize data points in a constructive way such that patterns might emerge that fulfill every condition of the data.
It is one of the most important steps for conducting statistical data analysis . It gives you a conclusion of the distribution of your data, helps you detect typos and outliers, and enables you to identify similarities among variables, thus making you ready for conducting further statistical analyses.
Techniques for Descriptive Analysis
Data aggregation and data mining are two techniques used in descriptive analysis to churn out historical data. In Data aggregation, data is first collected and then sorted in order to make the datasets more manageable.
Descriptive techniques often include constructing tables of quantiles and means, methods of dispersion such as variance or standard deviation, and cross-tabulations or "crosstabs" that can be used to carry out many disparate hypotheses. These hypotheses often highlight differences among subgroups.
Measures like segregation, discrimination, and inequality are studied using specialised descriptive techniques. Discrimination is measured with the help of audit studies or decomposition methods. More segregation on the basis of type or inequality of outcomes need not be wholly good or bad in itself, but it is often considered a marker of unjust social processes; accurate measurement of the different steps across space and time is a prerequisite to understanding these processes.
A table of means by subgroup is used to show important differences across subgroups, which mostly results in inference and conclusions being made. When we notice a gap in earnings, for example, we naturally tend to extrapolate reasons for those patterns complying.
But this also enters the province of measuring impacts which requires the use of different techniques. Often, random variation causes difference in means, and statistical inference is required to determine whether observed differences could happen merely due to chance.
A crosstab or two-way tabulation is supposed to show the proportions of components with unique values for each of two variables available, or cell proportions. For example, we might tabulate the proportion of the population that has a high school degree and also receives food or cash assistance, meaning a crosstab of education versus receipt of assistance is supposed to be made.
Then we might also want to examine row proportions, or the fractions in each education group who receive food or cash assistance, perhaps seeing assistance levels dip extraordinarily at higher education levels.
Column proportions can also be examined, for the fraction of population with different levels of education, but this is the opposite from any causal effects. We might come across a surprisingly high number or proportion of recipients with a college education, but this might be a result of larger numbers of people being college graduates than people who have less than a high school degree.
(Must check: 4 Types of Data in Statistics )
Types of Descriptive Analysis
Descriptive analysis can be categorized into four types which are measures of frequency, central tendency, dispersion or variation, and position. These methods are optimal for a single variable at a time.

Different types of Descriptive Analysis
Measures of Frequency
In descriptive analysis, it’s essential to know how frequently a certain event or response is likely to occur. This is the prime purpose of measures of frequency to make like a count or percent.
For example, consider a survey where 500 participants are asked about their favourite IPL team. A list of 500 responses would be difficult to consume and accommodate, but the data can be made much more accessible by measuring how many times a certain IPL team was selected.
Measures of Central Tendency
In descriptive analysis, it’s also important to find out the Central (or average) Tendency or response. Central tendency is measured with the use of three averages — mean, median, and mode. As an example, consider a survey in which the weight of 1,000 people is measured. In this case, the mean average would be an excellent descriptive metric to measure mid-values.
Measures of Dispersion
Sometimes, it is important to know how data is divided across a range. To elaborate this, consider the average weight in a sample of two people. If both individuals are 60 kilos, the average weight will be 60 kg. However, if one individual is 50 kg and the other is 70 kg, the average weight is still 60 kg. Measures of dispersion like range or standard deviation can be employed to measure this kind of distribution.
Measures of Position
Descriptive analysis also involves identifying the position of a single value or its response in relation to others. Measures like percentiles and quartiles become very useful in this area of expertise.
Apart from it, if you’ve collected data on multiple variables, you can use the Bivariate or Multivariate descriptive statistics to study whether there are relationships between them.
In bivariate analysis, you simultaneously study the frequency and variability of two different variables to see if they seem to have a pattern and vary together. You can also test and compare the central tendency of the two variables before carrying out further types of statistical analysis .
Multivariate analysis is the same as bivariate analysis but it is carried out for more than two variables. Following 2 methods are for bivariate analysis.
Contingency table
In a contingency table, each cell represents the combination of the two variables. Naturally, an independent variable (e.g., gender) is listed along the vertical axis and a dependent one is tallied along the horizontal axis (e.g., activities). You need to read “across” the table to witness how the two variables i.e. independent and dependent variables relate to each other.
A table showing a tally of different gender with number of activities
Scatter plots
A scatter plot is a chart that enables you to see the relationship between two or three different variables. It’s a visual rendition of the strength of a relationship.
In a scatter plot, you are supposed to plot one variable along the x-axis and another one along the y-axis. Each data point is denoted by a point in the chart.

The scatter plot shows the hours of sleep needed per day by age, Source
(Recommend Blog: Introduction to Bayesian Statistics )
Advantages of Descriptive Analysis
High degree of objectivity and neutrality of the researchers are one of the main advantages of Descriptive Analysis. The reason why researchers need to be extra vigilant is because descriptive analysis shows different characteristics of the data extracted and if the data doesn’t match with the trends then it will lead to major dumping of data.
Descriptive analysis is considered to be more vast than other quantitative methods and provide a broader picture of an event or phenomenon. It can use any number of variables or even a single number of variables to conduct a descriptive research.
This type of analysis is considered as a better method for collecting information that describes relationships as natural and exhibits the world as it exists. This reason makes this analysis very real and close to humanity as all the trends are made after research about the real-life behaviour of the data.
It is considered useful for identifying variables and new hypotheses which can be further analyzed through experimental and inferential studies. It is considered useful because the margin for error is very less as we are taking the trends straight from the data properties.
This type of study gives the researcher the flexibility to use both quantitative and qualitative data in order to discover the properties of the population.
For example, researchers can use both case study which is a qualitative analysis and correlation analysis to describe a phenomena in its own way. Using the case studies for describing people, events, institutions enables the researcher to understand the behavior and pattern of the concerned set to its maximum potential.
In the case of surveys which consist of one of the main types of Descriptive Analysis, the researcher tends to gather data points from a relatively large number of samples unlike experimental studies that generally need smaller samples.
This is an out and out advantage of the survey method over other descriptive methods that it enables researchers to study larger groups of individuals with ease. If the surveys are properly administered, it gives a broader and neater description of the unit under research.
(Also check: Importance of Statistics for Data Science )
Share Blog :
Be a part of our Instagram community
Trending blogs
5 Factors Influencing Consumer Behavior
Elasticity of Demand and its Types
What is PESTLE Analysis? Everything you need to know about it
What is Managerial Economics? Definition, Types, Nature, Principles, and Scope
5 Factors Affecting the Price Elasticity of Demand (PED)
6 Major Branches of Artificial Intelligence (AI)
Dijkstra’s Algorithm: The Shortest Path Algorithm
Scope of Managerial Economics
Different Types of Research Methods
Latest Comments

Dr Sheik Zubaili
How To Enlarge Your Penis Size Naturally In Just 5 Days In Pietermaritzburg City Call ☏ +27710732372 Permanent Penis Enlargement Products In Cape Town South Africa, (1).My penis is too small, how to enlarge it? First of all, we have to define what small really means and what statistics apart from any personal impressions and taste actually say: The flaccid size is irrelevant, some men have a rather small penis growing to enormous size when erect, on the other hand there are men with a rather impressive flaccid penis that just erects itself when aroused and doesn't grow much in girth or length. Even in reputable studies, the statistical average varies, the US median is about 5.5 inch according to the biggest study (1661 sexually active men) we could find by the well known Journal of Sexual Medicine. Most men have an erect size between 5 and 6 inch, so below 5 inch can be considered small. Don't be fooled by the penis sizes you often see in adult movies, all actors are selected individuals far above the average size. These movies certainly don't depict any statistical average and also use visual tricks to make the manhood of the male actors appear even larger. (2).How long does herbal penis enlargement take? For the best results, calculate five to fifteen for significant results. The success of penis exercises varies, some guys are really lucky and see a measurable growth in just a few days, for some guys it takes a little longer. Don't give up if you don't get fast results, every penis is a little different, but jelling already worked in ancient Egypt, so it will work for you, too. Today's techniques and exercises are a lot more sophisticated than in the beginning, tested by thousands of men who successfully enlarged their penis this way, so it's really only a matter of time. It works for everybody, without exceptions. It's no easy way, like training in the gym: Cheating yourself, skipping exercises or being lazy and neglecting your training means it will take longer till you notice results. (3).Are there any ways to make my penis look bigger? Great news, even without a real increase in size, you can make your penis look bigger with herbal products, in an erect and flaccid state. If this extra inch hidden in the jungle is suddenly visible, it already makes you manhood look a bit more impressive. In case you have a few extra pounds, losing lower belly fat can optically enhance your penis, too. Unfortunately, this is a purely optical enlargement, but an easy and instant way to present your penis in a particularly advantageous possible way. Delivery Detail: International 1-5 Days local will take 1-3 days
Dark Knuckle Whitening Serum Hand Elbow Knee Brightening Serum In Polokwane City And Saldanha Town Call ☏ +2771 073 2372 Get Rid Of Vitiligo In Vaasa City In Finland, Scars And Stretch Marks In Vereeniging City In South Africa, This whitening serum will help address issues like dark spots, hyperpigmentation, sun damage, and skin tone unevenness, leaving you with a beautiful, smooth, radiant, and even skin tone. Made with natural quality vegetable ingredients. This product is rich in collagen, which makes the skin fully nourished. And repair skin damage. Tranexamic acid has been scientifically proven to renew the skin, it reduces the formation of melanin pigment. It is the best agent to renew the skin, reduce freckles, blemishes and dark spots. This whitening serum thoroughly targets various types of blemishes, from those that are typically dark and defined to the smaller scattered spots that are blurry and widely distributed over the face. The fast-absorbing texture doesn't feel sticky, leaving skin beautifully glowing and translucent. Our Serum also repairs and hydrates the skin, it does not irritate your skin, it is extra gentle on the most sensitive skin and areas of your body. How to use: Wet the skin with water first, apply the essence on the skin, wait for 15-20 minutes and then wash it off. Net Weight: 50ml Package List: 1 x Serum Call/Whatsapp +27710732372
brucejohns224f53c1637ff7541b3
My wife and I were trying to purchase a house after we gave birth to two children. But due to our bad credit score it was not approved. Her score was 545 and mine was 544. They use the higher of the two scores, so we decided to work on her score, as she has less total debt in just her name than I do. Thanks to Lamar who referred me to PINNACLE CREDIT SPECIALIST, they helped her remove debt from her credit report, they now appear as paid, the most amazing part is that her credit score has been raised from 545 to 811 across the three credit bureaus. I assure you they are the best in terms of credit repair. Contact them by email: [email protected] / +1 (409) 231-0041.

Cindy Jason
HOW TO GET YOUR EX HUSBAND BACK HELP OF DR KACHI CALL NUMBER +1 (209) 893-8075 God did it for me again with the help of Dr Kachi with his love spell to get my husband back. we divorce 3months ago and since things become so hard for me because I love my husband so much, But he was chatting on me with another woman and he always goes to party every night my husband doesn't care about me whenever he get back at night he will be beating me up with no reason, I cry every night and day to get my husband back to his normal love and affection that he give to me before. but nothing was working out for me I try my best I left him with my kids but I couldn't sleep at night without thinking about my husband, then one day I was reading a new online about our politics and I see a comment about Dr Kachi how he restored broken relationship back and marriage, i didn't believe in love spell at the first place, then i have to make further research about Dr Kachi I opened his website I can't believe what I saw a great man helping people return their lover back and being happy in relationship again. I went fast and contacted Dr Kachi to help me restore my marriage back, after I provided the required needed to cast the love spell, the next day my husband come back to me and apologies for him leaving me and the kids Dr Kachi made me the happiest woman on earth I am so happy, I do appreciate your kind help bring my husband home, you can also contact him and seek for help in break up in married Via Text Number Call: +1 (209) 893-8075 Website: https://drkachispellcaster.wixsite.com/my-site Email [email protected]
effectivespellcaster81a31589b7eec45f9
I`m happy sharing this experiences on how to fix your marriages/relationships problems. my life become more beautiful since i contacted this real spell caster Dr Excellent for help" I was heart broken when my husband left me and moved to California to be with another woman. I felt my life was over and my kids thought they would never see their father again. I tried to be strong just for the kids but I could not control the pains that tormented my heart, my heart was filled with sorrows and pains because I was really in love with my husband. I have tried many options but he did not come back, until i met a friend that directed me to Dr.Excellent a spell caster, who helped me to bring back my husband after 11hours. Me and my husband are living happily together again, This man is powerful, Contact Dr Excellent for any kind of spiritual problems or any kind of spell or relationship problems he is capable of making things right for you with no side effect., Here his contact. WhatsApp him at: +2348084273514 "Or email him at: [email protected] , His website:https://drexcellentspellcaster.godaddysites.com
williambarry169d9d00404166a4109
I am sure a lot of us are still not aware of the recent development of the Blank ATM card.. An ATM card that can change your financial status within few days. With this Blank ATM card, you can withdraw between $1,000 to $2,000 daily and weekly from any ATM machine in the world. The Blank ATM card is also sophisticated. i am not a stupid man that i will come out to the public and start saying what i cannot do. For how you can get your Card, Order yours today via Email: [email protected] telegram: william_barry

Katherine Griffith
Hello everyone, I wish to share my testimonies with the general public about Dr Kachi for helping me to win the LOTTO MAX, i have been playing all types of lottery for the past 9years now. the only big money i have ever win was $3000 ever since things became worse to enduring because i couldn’t been able to win again, i was not happy i need help to win the lottery, until the day i was reading a newspaper online which so many people has talked good things about best lottery cast Dr Kachi who can change your life into riches. So I contacted him and he cast the spell and gave me the hot figures. I played the LOTTO MAX DRAW Behold when I went to check and to my greatest surprise my name came out as one of the winners. I won $60 Millions Dr Kachi, your spell made it wonderful to win the lottery. I can't believe it. Thank you so much sir for dedicating your time to cast the Lottery spell for me. I am eternally grateful for the lottery spell winning Dr Kachi did for me. I’m now out of debts and experiencing the most amazing good life of the lottery after I won a huge amount of money. I am more excited now than I ever have been in my life. In case you also need him to help you win, you can contact: [email protected] OR Call/Text number: +1 (209) 893-8075 Visit his Website: https://drkachispellcaster.wixsite.com/my-site
- Skip to primary navigation
- Skip to main content
- Skip to primary sidebar
PESTLE Analysis
Insights and resources on business analysis tools
Descriptive Analysis: How-To, Types, Examples
Last Updated: Mar 29, 2024 by Thomas Bush Filed Under: Business
From diagnostic to predictive, there are many different types of data analysis . Perhaps the most straightforward of them is descriptive analysis, which seeks to describe or summarize past and present data, helping to create accessible data insights. In this short guide, we’ll review the basics of descriptive analysis, including what exactly it is, what benefits it has, how to do it, as well as some types and examples.
What Is Descriptive Analysis?
Descriptive analysis, also known as descriptive analytics or descriptive statistics, is the process of using statistical techniques to describe or summarize a set of data. As one of the major types of data analysis, descriptive analysis is popular for its ability to generate accessible insights from otherwise uninterpreted data.
Unlike other types of data analysis, the descriptive analysis does not attempt to make predictions about the future. Instead, it draws insights solely from past data, by manipulating in ways that make it more meaningful.
Benefits of Descriptive Analysis
Descriptive analysis is all about trying to describe or summarize data. Although it doesn’t make predictions about the future, it can still be extremely valuable in business environments . This is chiefly because descriptive analysis makes it easier to consume data, which can make it easier for analysts to act on.
Another benefit of descriptive analysis is that it can help to filter out less meaningful data. This is because the statistical techniques used within this type of analysis usually focus on the patterns in data, and not the outliers.
Types of Descriptive Analysis
According to CampusLabs.com , descriptive analysis can be categorized as one of four types. They are measures of frequency, central tendency, dispersion or variation, and position.
Measures of Frequency
In descriptive analysis, it’s essential to know how frequently a certain event or response occurs. This is the purpose of measures of frequency, like a count or percent. For example, consider a survey where 1,000 participants are asked about their favourite ice cream flavor. A list of 1,000 responses would be difficult to consume, but the data can be made much more accessible by measuring how many times a certain flavor was selected.
Measures of Central Tendency
In descriptive analysis, it’s also worth knowing the central (or average) event or response. Common measures of central tendency include the three averages — mean, median, and mode. As an example, consider a survey in which the height of 1,000 people is measured. In this case, the mean average would be a very helpful descriptive metric.
Measures of Dispersion
Sometimes, it may be worth knowing how data is distributed across a range. To illustrate this, consider the average height in a sample of two people. If both individuals are six feet tall, the average height is six feet. However, if one individual is five feet tall and the other is seven feet tall, the average height is still six feet. In order to measure this kind of distribution, measures of dispersion like range or standard deviation can be employed.
Measures of Position
Last of all, descriptive analysis can involve identifying the position of one event or response in relation to others. This is where measures like percentiles and quartiles can be used.
How to Do Descriptive Analysis
Like many types of data analysis, descriptive analysis can be quite open-ended. In other words, it’s up to you what you want to look for in your analysis. With that said, the process of descriptive analysis usually consists of the same few steps.
- Collect data
The first step in any type of data analysis is to collect the data. This can be done in a variety of ways, but surveys and good old fashioned measurements are often used.
Another important step in descriptive and other types of data analysis is to clean the data. This is because data may be formatted in inaccessible ways, which will make it difficult to manipulate with statistics. Cleaning data may involve changing its textual format, categorizing it, and/or removing outliers.
- Apply methods
Finally, descriptive analysis involves applying the chosen statistical methods so as to draw the desired conclusions. What methods you choose will depend on the data you are dealing with and what you are looking to determine. If in doubt, review the four types of descriptive analysis methods explained above.
When to Do Descriptive Analysis
Descriptive analysis is often used when reviewing any past or present data. This is because raw data is difficult to consume and interpret, while the metrics offered by descriptive analysis are much more focused.
Descriptive analysis can also be conducted as the precursor to diagnostic or predictive analysis , providing insights into what has happened in the past before attempting to explain why it happened or predicting what will happen in the future.
Descriptive Analysis Example
As an example of descriptive analysis, consider an insurance company analyzing its customer base.
The insurance company may know certain traits about its customers, such as their gender, age, and nationality. To gain a better profile of their customers, the insurance company can apply descriptive analysis.
Measures of frequency can be used to identify how many customers are under a certain age; measures of central tendency can be used to identify who most of their customers are; measures of dispersion can be used to identify the variation in, for example, the age of their customers; finally, measures of position can be used to compare segments of customers based on specific traits.
Final Thoughts
Descriptive analysis is a popular type of data analysis. It’s often conducted before diagnostic or predictive analysis, as it simply aims to describe and summarize past data.
To do so, descriptive analysis uses a variety of statistical techniques, including measures of frequency, central tendency, dispersion, and position. How exactly you conduct descriptive analysis will depend on what you are looking to find out, but the steps usually involve collecting, cleaning, and finally analyzing data.
In any case, this business analysis process is invaluable when working with data.
Image by Pexels
Quant Analysis 101: Descriptive Statistics
Everything You Need To Get Started (With Examples)
By: Derek Jansen (MBA) | Reviewers: Kerryn Warren (PhD) | October 2023
If you’re new to quantitative data analysis , one of the first terms you’re likely to hear being thrown around is descriptive statistics. In this post, we’ll unpack the basics of descriptive statistics, using straightforward language and loads of examples . So grab a cup of coffee and let’s crunch some numbers!
Overview: Descriptive Statistics
What are descriptive statistics.
- Descriptive vs inferential statistics
- Why the descriptives matter
- The “ Big 7 ” descriptive statistics
- Key takeaways
At the simplest level, descriptive statistics summarise and describe relatively basic but essential features of a quantitative dataset – for example, a set of survey responses. They provide a snapshot of the characteristics of your dataset and allow you to better understand, roughly, how the data are “shaped” (more on this later). For example, a descriptive statistic could include the proportion of males and females within a sample or the percentages of different age groups within a population.
Another common descriptive statistic is the humble average (which in statistics-talk is called the mean ). For example, if you undertook a survey and asked people to rate their satisfaction with a particular product on a scale of 1 to 10, you could then calculate the average rating. This is a very basic statistic, but as you can see, it gives you some idea of how this data point is shaped .

What about inferential statistics?
Now, you may have also heard the term inferential statistics being thrown around, and you’re probably wondering how that’s different from descriptive statistics. Simply put, descriptive statistics describe and summarise the sample itself , while inferential statistics use the data from a sample to make inferences or predictions about a population .
Put another way, descriptive statistics help you understand your dataset , while inferential statistics help you make broader statements about the population , based on what you observe within the sample. If you’re keen to learn more, we cover inferential stats in another post , or you can check out the explainer video below.
Why do descriptive statistics matter?
While descriptive statistics are relatively simple from a mathematical perspective, they play a very important role in any research project . All too often, students skim over the descriptives and run ahead to the seemingly more exciting inferential statistics, but this can be a costly mistake.
The reason for this is that descriptive statistics help you, as the researcher, comprehend the key characteristics of your sample without getting lost in vast amounts of raw data. In doing so, they provide a foundation for your quantitative analysis . Additionally, they enable you to quickly identify potential issues within your dataset – for example, suspicious outliers, missing responses and so on. Just as importantly, descriptive statistics inform the decision-making process when it comes to choosing which inferential statistics you’ll run, as each inferential test has specific requirements regarding the shape of the data.
Long story short, it’s essential that you take the time to dig into your descriptive statistics before looking at more “advanced” inferentials. It’s also worth noting that, depending on your research aims and questions, descriptive stats may be all that you need in any case . So, don’t discount the descriptives!

The “Big 7” descriptive statistics
With the what and why out of the way, let’s take a look at the most common descriptive statistics. Beyond the counts, proportions and percentages we mentioned earlier, we have what we call the “Big 7” descriptives. These can be divided into two categories – measures of central tendency and measures of dispersion.
Measures of central tendency
True to the name, measures of central tendency describe the centre or “middle section” of a dataset. In other words, they provide some indication of what a “typical” data point looks like within a given dataset. The three most common measures are:
The mean , which is the mathematical average of a set of numbers – in other words, the sum of all numbers divided by the count of all numbers.
The median , which is the middlemost number in a set of numbers, when those numbers are ordered from lowest to highest.
The mode , which is the most frequently occurring number in a set of numbers (in any order). Naturally, a dataset can have one mode, no mode (no number occurs more than once) or multiple modes.
To make this a little more tangible, let’s look at a sample dataset, along with the corresponding mean, median and mode. This dataset reflects the service ratings (on a scale of 1 – 10) from 15 customers.

As you can see, the mean of 5.8 is the average rating across all 15 customers. Meanwhile, 6 is the median . In other words, if you were to list all the responses in order from low to high, Customer 8 would be in the middle (with their service rating being 6). Lastly, the number 5 is the most frequent rating (appearing 3 times), making it the mode.
Together, these three descriptive statistics give us a quick overview of how these customers feel about the service levels at this business. In other words, most customers feel rather lukewarm and there’s certainly room for improvement. From a more statistical perspective, this also means that the data tend to cluster around the 5-6 mark , since the mean and the median are fairly close to each other.
To take this a step further, let’s look at the frequency distribution of the responses . In other words, let’s count how many times each rating was received, and then plot these counts onto a bar chart.

As you can see, the responses tend to cluster toward the centre of the chart , creating something of a bell-shaped curve. In statistical terms, this is called a normal distribution .
As you delve into quantitative data analysis, you’ll find that normal distributions are very common , but they’re certainly not the only type of distribution. In some cases, the data can lean toward the left or the right of the chart (i.e., toward the low end or high end). This lean is reflected by a measure called skewness , and it’s important to pay attention to this when you’re analysing your data, as this will have an impact on what types of inferential statistics you can use on your dataset.

Measures of dispersion
While the measures of central tendency provide insight into how “centred” the dataset is, it’s also important to understand how dispersed that dataset is . In other words, to what extent the data cluster toward the centre – specifically, the mean. In some cases, the majority of the data points will sit very close to the centre, while in other cases, they’ll be scattered all over the place. Enter the measures of dispersion, of which there are three:
Range , which measures the difference between the largest and smallest number in the dataset. In other words, it indicates how spread out the dataset really is.
Variance , which measures how much each number in a dataset varies from the mean (average). More technically, it calculates the average of the squared differences between each number and the mean. A higher variance indicates that the data points are more spread out , while a lower variance suggests that the data points are closer to the mean.
Standard deviation , which is the square root of the variance . It serves the same purposes as the variance, but is a bit easier to interpret as it presents a figure that is in the same unit as the original data . You’ll typically present this statistic alongside the means when describing the data in your research.
Again, let’s look at our sample dataset to make this all a little more tangible.

As you can see, the range of 8 reflects the difference between the highest rating (10) and the lowest rating (2). The standard deviation of 2.18 tells us that on average, results within the dataset are 2.18 away from the mean (of 5.8), reflecting a relatively dispersed set of data .
For the sake of comparison, let’s look at another much more tightly grouped (less dispersed) dataset.

As you can see, all the ratings lay between 5 and 8 in this dataset, resulting in a much smaller range, variance and standard deviation . You might also notice that the data are clustered toward the right side of the graph – in other words, the data are skewed. If we calculate the skewness for this dataset, we get a result of -0.12, confirming this right lean.
In summary, range, variance and standard deviation all provide an indication of how dispersed the data are . These measures are important because they help you interpret the measures of central tendency within context . In other words, if your measures of dispersion are all fairly high numbers, you need to interpret your measures of central tendency with some caution , as the results are not particularly centred. Conversely, if the data are all tightly grouped around the mean (i.e., low dispersion), the mean becomes a much more “meaningful” statistic).
Key Takeaways
We’ve covered quite a bit of ground in this post. Here are the key takeaways:
- Descriptive statistics, although relatively simple, are a critically important part of any quantitative data analysis.
- Measures of central tendency include the mean (average), median and mode.
- Skewness indicates whether a dataset leans to one side or another
- Measures of dispersion include the range, variance and standard deviation
If you’d like hands-on help with your descriptive statistics (or any other aspect of your research project), check out our private coaching service , where we hold your hand through each step of the research journey.

Psst… there’s more!
This post is an extract from our bestselling short course, Methodology Bootcamp . If you want to work smart, you don't want to miss this .
You Might Also Like:
")
Good day. May I ask about where I would be able to find the statistics cheat sheet?

Right above you comment 🙂

Good job. you saved me

Brilliant and well explained. So much information explained clearly!
Submit a Comment Cancel reply
Your email address will not be published. Required fields are marked *
Save my name, email, and website in this browser for the next time I comment.
- Print Friendly
Have a thesis expert improve your writing
Check your thesis for plagiarism in 10 minutes, generate your apa citations for free.
- Knowledge Base
Descriptive Statistics | Definitions, Types, Examples
Published on 4 November 2022 by Pritha Bhandari . Revised on 9 January 2023.
Descriptive statistics summarise and organise characteristics of a data set. A data set is a collection of responses or observations from a sample or entire population .
In quantitative research , after collecting data, the first step of statistical analysis is to describe characteristics of the responses, such as the average of one variable (e.g., age), or the relation between two variables (e.g., age and creativity).
The next step is inferential statistics , which help you decide whether your data confirms or refutes your hypothesis and whether it is generalisable to a larger population.
Table of contents
Types of descriptive statistics, frequency distribution, measures of central tendency, measures of variability, univariate descriptive statistics, bivariate descriptive statistics, frequently asked questions.
There are 3 main types of descriptive statistics:
- The distribution concerns the frequency of each value.
- The central tendency concerns the averages of the values.
- The variability or dispersion concerns how spread out the values are.

You can apply these to assess only one variable at a time, in univariate analysis, or to compare two or more, in bivariate and multivariate analysis.
- Go to a library
- Watch a movie at a theater
- Visit a national park
A data set is made up of a distribution of values, or scores. In tables or graphs, you can summarise the frequency of every possible value of a variable in numbers or percentages.
- Simple frequency distribution table
- Grouped frequency distribution table
From this table, you can see that more women than men or people with another gender identity took part in the study. In a grouped frequency distribution, you can group numerical response values and add up the number of responses for each group. You can also convert each of these numbers to percentages.
Measures of central tendency estimate the center, or average, of a data set. The mean , median and mode are 3 ways of finding the average.
Here we will demonstrate how to calculate the mean, median, and mode using the first 6 responses of our survey.
The mean , or M , is the most commonly used method for finding the average.
To find the mean, simply add up all response values and divide the sum by the total number of responses. The total number of responses or observations is called N .
The median is the value that’s exactly in the middle of a data set.
To find the median, order each response value from the smallest to the biggest. Then, the median is the number in the middle. If there are two numbers in the middle, find their mean.
The mode is the simply the most popular or most frequent response value. A data set can have no mode, one mode, or more than one mode.
To find the mode, order your data set from lowest to highest and find the response that occurs most frequently.
Measures of variability give you a sense of how spread out the response values are. The range, standard deviation and variance each reflect different aspects of spread.
The range gives you an idea of how far apart the most extreme response scores are. To find the range , simply subtract the lowest value from the highest value.
Standard deviation
The standard deviation ( s ) is the average amount of variability in your dataset. It tells you, on average, how far each score lies from the mean. The larger the standard deviation, the more variable the data set is.
There are six steps for finding the standard deviation:
- List each score and find their mean.
- Subtract the mean from each score to get the deviation from the mean.
- Square each of these deviations.
- Add up all of the squared deviations.
- Divide the sum of the squared deviations by N – 1.
- Find the square root of the number you found.
Step 5: 421.5/5 = 84.3
Step 6: √84.3 = 9.18
The variance is the average of squared deviations from the mean. Variance reflects the degree of spread in the data set. The more spread the data, the larger the variance is in relation to the mean.
To find the variance, simply square the standard deviation. The symbol for variance is s 2 .
Univariate descriptive statistics focus on only one variable at a time. It’s important to examine data from each variable separately using multiple measures of distribution, central tendency and spread. Programs like SPSS and Excel can be used to easily calculate these.
If you were to only consider the mean as a measure of central tendency, your impression of the ‘middle’ of the data set can be skewed by outliers, unlike the median or mode.
Likewise, while the range is sensitive to extreme values, you should also consider the standard deviation and variance to get easily comparable measures of spread.
If you’ve collected data on more than one variable, you can use bivariate or multivariate descriptive statistics to explore whether there are relationships between them.
In bivariate analysis, you simultaneously study the frequency and variability of two variables to see if they vary together. You can also compare the central tendency of the two variables before performing further statistical tests .
Multivariate analysis is the same as bivariate analysis but with more than two variables.
Contingency table
In a contingency table, each cell represents the intersection of two variables. Usually, an independent variable (e.g., gender) appears along the vertical axis and a dependent one appears along the horizontal axis (e.g., activities). You read ‘across’ the table to see how the independent and dependent variables relate to each other.
Interpreting a contingency table is easier when the raw data is converted to percentages. Percentages make each row comparable to the other by making it seem as if each group had only 100 observations or participants. When creating a percentage-based contingency table, you add the N for each independent variable on the end.
From this table, it is more clear that similar proportions of children and adults go to the library over 17 times a year. Additionally, children most commonly went to the library between 5 and 8 times, while for adults, this number was between 13 and 16.
Scatter plots
A scatter plot is a chart that shows you the relationship between two or three variables. It’s a visual representation of the strength of a relationship.
In a scatter plot, you plot one variable along the x-axis and another one along the y-axis. Each data point is represented by a point in the chart.
From your scatter plot, you see that as the number of movies seen at movie theaters increases, the number of visits to the library decreases. Based on your visual assessment of a possible linear relationship, you perform further tests of correlation and regression.

Descriptive statistics summarise the characteristics of a data set. Inferential statistics allow you to test a hypothesis or assess whether your data is generalisable to the broader population.
The 3 main types of descriptive statistics concern the frequency distribution, central tendency, and variability of a dataset.
- Distribution refers to the frequencies of different responses.
- Measures of central tendency give you the average for each response.
- Measures of variability show you the spread or dispersion of your dataset.
- Univariate statistics summarise only one variable at a time.
- Bivariate statistics compare two variables .
- Multivariate statistics compare more than two variables .
Cite this Scribbr article
If you want to cite this source, you can copy and paste the citation or click the ‘Cite this Scribbr article’ button to automatically add the citation to our free Reference Generator.
Bhandari, P. (2023, January 09). Descriptive Statistics | Definitions, Types, Examples. Scribbr. Retrieved 29 April 2024, from https://www.scribbr.co.uk/stats/descriptive-statistics-explained/
Is this article helpful?

Pritha Bhandari
Other students also liked, data collection methods | step-by-step guide & examples, variability | calculating range, iqr, variance, standard deviation, normal distribution | examples, formulas, & uses.
- What is descriptive research?
Last updated
5 February 2023
Reviewed by
Cathy Heath
Descriptive research is a common investigatory model used by researchers in various fields, including social sciences, linguistics, and academia.
Read on to understand the characteristics of descriptive research and explore its underlying techniques, processes, and procedures.
Analyze your descriptive research
Dovetail streamlines analysis to help you uncover and share actionable insights
Descriptive research is an exploratory research method. It enables researchers to precisely and methodically describe a population, circumstance, or phenomenon.
As the name suggests, descriptive research describes the characteristics of the group, situation, or phenomenon being studied without manipulating variables or testing hypotheses . This can be reported using surveys , observational studies, and case studies. You can use both quantitative and qualitative methods to compile the data.
Besides making observations and then comparing and analyzing them, descriptive studies often develop knowledge concepts and provide solutions to critical issues. It always aims to answer how the event occurred, when it occurred, where it occurred, and what the problem or phenomenon is.
- Characteristics of descriptive research
The following are some of the characteristics of descriptive research:
Quantitativeness
Descriptive research can be quantitative as it gathers quantifiable data to statistically analyze a population sample. These numbers can show patterns, connections, and trends over time and can be discovered using surveys, polls, and experiments.
Qualitativeness
Descriptive research can also be qualitative. It gives meaning and context to the numbers supplied by quantitative descriptive research .
Researchers can use tools like interviews, focus groups, and ethnographic studies to illustrate why things are what they are and help characterize the research problem. This is because it’s more explanatory than exploratory or experimental research.
Uncontrolled variables
Descriptive research differs from experimental research in that researchers cannot manipulate the variables. They are recognized, scrutinized, and quantified instead. This is one of its most prominent features.
Cross-sectional studies
Descriptive research is a cross-sectional study because it examines several areas of the same group. It involves obtaining data on multiple variables at the personal level during a certain period. It’s helpful when trying to understand a larger community’s habits or preferences.
Carried out in a natural environment
Descriptive studies are usually carried out in the participants’ everyday environment, which allows researchers to avoid influencing responders by collecting data in a natural setting. You can use online surveys or survey questions to collect data or observe.
Basis for further research
You can further dissect descriptive research’s outcomes and use them for different types of investigation. The outcomes also serve as a foundation for subsequent investigations and can guide future studies. For example, you can use the data obtained in descriptive research to help determine future research designs.
- Descriptive research methods
There are three basic approaches for gathering data in descriptive research: observational, case study, and survey.
You can use surveys to gather data in descriptive research. This involves gathering information from many people using a questionnaire and interview .
Surveys remain the dominant research tool for descriptive research design. Researchers can conduct various investigations and collect multiple types of data (quantitative and qualitative) using surveys with diverse designs.
You can conduct surveys over the phone, online, or in person. Your survey might be a brief interview or conversation with a set of prepared questions intended to obtain quick information from the primary source.
Observation
This descriptive research method involves observing and gathering data on a population or phenomena without manipulating variables. It is employed in psychology, market research , and other social science studies to track and understand human behavior.
Observation is an essential component of descriptive research. It entails gathering data and analyzing it to see whether there is a relationship between the two variables in the study. This strategy usually allows for both qualitative and quantitative data analysis.
Case studies
A case study can outline a specific topic’s traits. The topic might be a person, group, event, or organization.
It involves using a subset of a larger group as a sample to characterize the features of that larger group.
You can generalize knowledge gained from studying a case study to benefit a broader audience.
This approach entails carefully examining a particular group, person, or event over time. You can learn something new about the study topic by using a small group to better understand the dynamics of the entire group.
- Types of descriptive research
There are several types of descriptive study. The most well-known include cross-sectional studies, census surveys, sample surveys, case reports, and comparison studies.
Case reports and case series
In the healthcare and medical fields, a case report is used to explain a patient’s circumstances when suffering from an uncommon illness or displaying certain symptoms. Case reports and case series are both collections of related cases. They have aided the advancement of medical knowledge on countless occasions.
The normative component is an addition to the descriptive survey. In the descriptive–normative survey, you compare the study’s results to the norm.
Descriptive survey
This descriptive type of research employs surveys to collect information on various topics. This data aims to determine the degree to which certain conditions may be attained.
You can extrapolate or generalize the information you obtain from sample surveys to the larger group being researched.
Correlative survey
Correlative surveys help establish if there is a positive, negative, or neutral connection between two variables.
Performing census surveys involves gathering relevant data on several aspects of a given population. These units include individuals, families, organizations, objects, characteristics, and properties.
During descriptive research, you gather different degrees of interest over time from a specific population. Cross-sectional studies provide a glimpse of a phenomenon’s prevalence and features in a population. There are no ethical challenges with them and they are quite simple and inexpensive to carry out.
Comparative studies
These surveys compare the two subjects’ conditions or characteristics. The subjects may include research variables, organizations, plans, and people.
Comparison points, assumption of similarities, and criteria of comparison are three important variables that affect how well and accurately comparative studies are conducted.
For instance, descriptive research can help determine how many CEOs hold a bachelor’s degree and what proportion of low-income households receive government help.
- Pros and cons
The primary advantage of descriptive research designs is that researchers can create a reliable and beneficial database for additional study. To conduct any inquiry, you need access to reliable information sources that can give you a firm understanding of a situation.
Quantitative studies are time- and resource-intensive, so knowing the hypotheses viable for testing is crucial. The basic overview of descriptive research provides helpful hints as to which variables are worth quantitatively examining. This is why it’s employed as a precursor to quantitative research designs.
Some experts view this research as untrustworthy and unscientific. However, there is no way to assess the findings because you don’t manipulate any variables statistically.
Cause-and-effect correlations also can’t be established through descriptive investigations. Additionally, observational study findings cannot be replicated, which prevents a review of the findings and their replication.
The absence of statistical and in-depth analysis and the rather superficial character of the investigative procedure are drawbacks of this research approach.
- Descriptive research examples and applications
Several descriptive research examples are emphasized based on their types, purposes, and applications. Research questions often begin with “What is …” These studies help find solutions to practical issues in social science, physical science, and education.
Here are some examples and applications of descriptive research:
Determining consumer perception and behavior
Organizations use descriptive research designs to determine how various demographic groups react to a certain product or service.
For example, a business looking to sell to its target market should research the market’s behavior first. When researching human behavior in response to a cause or event, the researcher pays attention to the traits, actions, and responses before drawing a conclusion.
Scientific classification
Scientific descriptive research enables the classification of organisms and their traits and constituents.
Measuring data trends
A descriptive study design’s statistical capabilities allow researchers to track data trends over time. It’s frequently used to determine the study target’s current circumstances and underlying patterns.
Conduct comparison
Organizations can use a descriptive research approach to learn how various demographics react to a certain product or service. For example, you can study how the target market responds to a competitor’s product and use that information to infer their behavior.
- Bottom line
A descriptive research design is suitable for exploring certain topics and serving as a prelude to larger quantitative investigations. It provides a comprehensive understanding of the “what” of the group or thing you’re investigating.
This research type acts as the cornerstone of other research methodologies . It is distinctive because it can use quantitative and qualitative research approaches at the same time.
What is descriptive research design?
Descriptive research design aims to systematically obtain information to describe a phenomenon, situation, or population. More specifically, it helps answer the what, when, where, and how questions regarding the research problem rather than the why.
How does descriptive research compare to qualitative research?
Despite certain parallels, descriptive research concentrates on describing phenomena, while qualitative research aims to understand people better.
How do you analyze descriptive research data?
Data analysis involves using various methodologies, enabling the researcher to evaluate and provide results regarding validity and reliability.
Get started today
Go from raw data to valuable insights with a flexible research platform
Editor’s picks
Last updated: 21 December 2023
Last updated: 16 December 2023
Last updated: 6 October 2023
Last updated: 25 November 2023
Last updated: 12 May 2023
Last updated: 15 February 2024
Last updated: 11 March 2024
Last updated: 12 December 2023
Last updated: 18 May 2023
Last updated: 6 March 2024
Last updated: 10 April 2023
Last updated: 20 December 2023
Latest articles
Related topics, log in or sign up.
Get started for free
- Skip to main content
- Skip to primary sidebar
- Skip to footer
- QuestionPro

- Solutions Industries Gaming Automotive Sports and events Education Government Travel & Hospitality Financial Services Healthcare Cannabis Technology Use Case NPS+ Communities Audience Contactless surveys Mobile LivePolls Member Experience GDPR Positive People Science 360 Feedback Surveys
- Resources Blog eBooks Survey Templates Case Studies Training Help center
Home Market Research
Descriptive Research: Definition, Characteristics, Methods + Examples

Suppose an apparel brand wants to understand the fashion purchasing trends among New York’s buyers, then it must conduct a demographic survey of the specific region, gather population data, and then conduct descriptive research on this demographic segment.
The study will then uncover details on “what is the purchasing pattern of New York buyers,” but will not cover any investigative information about “ why ” the patterns exist. Because for the apparel brand trying to break into this market, understanding the nature of their market is the study’s main goal. Let’s talk about it.
What is descriptive research?
Descriptive research is a research method describing the characteristics of the population or phenomenon studied. This descriptive methodology focuses more on the “what” of the research subject than the “why” of the research subject.
The method primarily focuses on describing the nature of a demographic segment without focusing on “why” a particular phenomenon occurs. In other words, it “describes” the research subject without covering “why” it happens.
Characteristics of descriptive research
The term descriptive research then refers to research questions, the design of the study, and data analysis conducted on that topic. We call it an observational research method because none of the research study variables are influenced in any capacity.
Some distinctive characteristics of descriptive research are:
- Quantitative research: It is a quantitative research method that attempts to collect quantifiable information for statistical analysis of the population sample. It is a popular market research tool that allows us to collect and describe the demographic segment’s nature.
- Uncontrolled variables: In it, none of the variables are influenced in any way. This uses observational methods to conduct the research. Hence, the nature of the variables or their behavior is not in the hands of the researcher.
- Cross-sectional studies: It is generally a cross-sectional study where different sections belonging to the same group are studied.
- The basis for further research: Researchers further research the data collected and analyzed from descriptive research using different research techniques. The data can also help point towards the types of research methods used for the subsequent research.
Applications of descriptive research with examples
A descriptive research method can be used in multiple ways and for various reasons. Before getting into any survey , though, the survey goals and survey design are crucial. Despite following these steps, there is no way to know if one will meet the research outcome. How to use descriptive research? To understand the end objective of research goals, below are some ways organizations currently use descriptive research today:
- Define respondent characteristics: The aim of using close-ended questions is to draw concrete conclusions about the respondents. This could be the need to derive patterns, traits, and behaviors of the respondents. It could also be to understand from a respondent their attitude, or opinion about the phenomenon. For example, understand millennials and the hours per week they spend browsing the internet. All this information helps the organization researching to make informed business decisions.
- Measure data trends: Researchers measure data trends over time with a descriptive research design’s statistical capabilities. Consider if an apparel company researches different demographics like age groups from 24-35 and 36-45 on a new range launch of autumn wear. If one of those groups doesn’t take too well to the new launch, it provides insight into what clothes are like and what is not. The brand drops the clothes and apparel that customers don’t like.
- Conduct comparisons: Organizations also use a descriptive research design to understand how different groups respond to a specific product or service. For example, an apparel brand creates a survey asking general questions that measure the brand’s image. The same study also asks demographic questions like age, income, gender, geographical location, geographic segmentation , etc. This consumer research helps the organization understand what aspects of the brand appeal to the population and what aspects do not. It also helps make product or marketing fixes or even create a new product line to cater to high-growth potential groups.
- Validate existing conditions: Researchers widely use descriptive research to help ascertain the research object’s prevailing conditions and underlying patterns. Due to the non-invasive research method and the use of quantitative observation and some aspects of qualitative observation , researchers observe each variable and conduct an in-depth analysis . Researchers also use it to validate any existing conditions that may be prevalent in a population.
- Conduct research at different times: The analysis can be conducted at different periods to ascertain any similarities or differences. This also allows any number of variables to be evaluated. For verification, studies on prevailing conditions can also be repeated to draw trends.
Advantages of descriptive research
Some of the significant advantages of descriptive research are:

- Data collection: A researcher can conduct descriptive research using specific methods like observational method, case study method, and survey method. Between these three, all primary data collection methods are covered, which provides a lot of information. This can be used for future research or even for developing a hypothesis for your research object.
- Varied: Since the data collected is qualitative and quantitative, it gives a holistic understanding of a research topic. The information is varied, diverse, and thorough.
- Natural environment: Descriptive research allows for the research to be conducted in the respondent’s natural environment, which ensures that high-quality and honest data is collected.
- Quick to perform and cheap: As the sample size is generally large in descriptive research, the data collection is quick to conduct and is inexpensive.
Descriptive research methods
There are three distinctive methods to conduct descriptive research. They are:
Observational method
The observational method is the most effective method to conduct this research, and researchers make use of both quantitative and qualitative observations.
A quantitative observation is the objective collection of data primarily focused on numbers and values. It suggests “associated with, of or depicted in terms of a quantity.” Results of quantitative observation are derived using statistical and numerical analysis methods. It implies observation of any entity associated with a numeric value such as age, shape, weight, volume, scale, etc. For example, the researcher can track if current customers will refer the brand using a simple Net Promoter Score question .
Qualitative observation doesn’t involve measurements or numbers but instead just monitoring characteristics. In this case, the researcher observes the respondents from a distance. Since the respondents are in a comfortable environment, the characteristics observed are natural and effective. In a descriptive research design, the researcher can choose to be either a complete observer, an observer as a participant, a participant as an observer, or a full participant. For example, in a supermarket, a researcher can from afar monitor and track the customers’ selection and purchasing trends. This offers a more in-depth insight into the purchasing experience of the customer.
Case study method
Case studies involve in-depth research and study of individuals or groups. Case studies lead to a hypothesis and widen a further scope of studying a phenomenon. However, case studies should not be used to determine cause and effect as they can’t make accurate predictions because there could be a bias on the researcher’s part. The other reason why case studies are not a reliable way of conducting descriptive research is that there could be an atypical respondent in the survey. Describing them leads to weak generalizations and moving away from external validity.
Survey research
In survey research, respondents answer through surveys or questionnaires or polls . They are a popular market research tool to collect feedback from respondents. A study to gather useful data should have the right survey questions. It should be a balanced mix of open-ended questions and close ended-questions . The survey method can be conducted online or offline, making it the go-to option for descriptive research where the sample size is enormous.
Examples of descriptive research
Some examples of descriptive research are:
- A specialty food group launching a new range of barbecue rubs would like to understand what flavors of rubs are favored by different people. To understand the preferred flavor palette, they conduct this type of research study using various methods like observational methods in supermarkets. By also surveying while collecting in-depth demographic information, offers insights about the preference of different markets. This can also help tailor make the rubs and spreads to various preferred meats in that demographic. Conducting this type of research helps the organization tweak their business model and amplify marketing in core markets.
- Another example of where this research can be used is if a school district wishes to evaluate teachers’ attitudes about using technology in the classroom. By conducting surveys and observing their comfortableness using technology through observational methods, the researcher can gauge what they can help understand if a full-fledged implementation can face an issue. This also helps in understanding if the students are impacted in any way with this change.
Some other research problems and research questions that can lead to descriptive research are:
- Market researchers want to observe the habits of consumers.
- A company wants to evaluate the morale of its staff.
- A school district wants to understand if students will access online lessons rather than textbooks.
- To understand if its wellness questionnaire programs enhance the overall health of the employees.
FREE TRIAL LEARN MORE
MORE LIKE THIS

NPS Survey Platform: Types, Tips, 11 Best Platforms & Tools
Apr 26, 2024

User Journey vs User Flow: Differences and Similarities

Best 7 Gap Analysis Tools to Empower Your Business
Apr 25, 2024

12 Best Employee Survey Tools for Organizational Excellence
Other categories.
- Academic Research
- Artificial Intelligence
- Assessments
- Brand Awareness
- Case Studies
- Communities
- Consumer Insights
- Customer effort score
- Customer Engagement
- Customer Experience
- Customer Loyalty
- Customer Research
- Customer Satisfaction
- Employee Benefits
- Employee Engagement
- Employee Retention
- Friday Five
- General Data Protection Regulation
- Insights Hub
- Life@QuestionPro
- Market Research
- Mobile diaries
- Mobile Surveys
- New Features
- Online Communities
- Question Types
- Questionnaire
- QuestionPro Products
- Release Notes
- Research Tools and Apps
- Revenue at Risk
- Survey Templates
- Training Tips
- Uncategorized
- Video Learning Series
- What’s Coming Up
- Workforce Intelligence
- Business Essentials
- Leadership & Management
- Credential of Leadership, Impact, and Management in Business (CLIMB)
- Entrepreneurship & Innovation
- Digital Transformation
- Finance & Accounting
- Business in Society
- For Organizations
- Support Portal
- Media Coverage
- Founding Donors
- Leadership Team

- Harvard Business School →
- HBS Online →
- Business Insights →
Business Insights
Harvard Business School Online's Business Insights Blog provides the career insights you need to achieve your goals and gain confidence in your business skills.
- Career Development
- Communication
- Decision-Making
- Earning Your MBA
- Negotiation
- News & Events
- Productivity
- Staff Spotlight
- Student Profiles
- Work-Life Balance
- AI Essentials for Business
- Alternative Investments
- Business Analytics
- Business Strategy
- Business and Climate Change
- Design Thinking and Innovation
- Digital Marketing Strategy
- Disruptive Strategy
- Economics for Managers
- Entrepreneurship Essentials
- Financial Accounting
- Global Business
- Launching Tech Ventures
- Leadership Principles
- Leadership, Ethics, and Corporate Accountability
- Leading with Finance
- Management Essentials
- Negotiation Mastery
- Organizational Leadership
- Power and Influence for Positive Impact
- Strategy Execution
- Sustainable Business Strategy
- Sustainable Investing
- Winning with Digital Platforms
What Is Descriptive Analytics? 5 Examples

- 09 Nov 2021
Data analytics is a valuable tool for businesses aiming to increase revenue, improve products, and retain customers. According to research by global management consulting firm McKinsey & Company, companies that use data analytics are 23 times more likely to outperform competitors in terms of new customer acquisition than non-data-driven companies. They were also nine times more likely to surpass them in measures of customer loyalty and 19 times more likely to achieve above-average profitability.
Data analytics can be broken into four key types :
- Descriptive, which answers the question, “What happened?”
- Diagnostic , which answers the question, “Why did this happen?”
- Predictive , which answers the question, “What might happen in the future?”
- Prescriptive , which answers the question, “What should we do next?”
Each type of data analysis can help you reach specific goals and be used in tandem to create a full picture of data that informs your organization’s strategy formulation and decision-making.
Descriptive analytics can be leveraged on its own or act as a foundation for the other three analytics types. If you’re new to the field of business analytics, descriptive analytics is an accessible and rewarding place to start.
Access your free e-book today.
What Is Descriptive Analytics?
Descriptive analytics is the process of using current and historical data to identify trends and relationships. It’s sometimes called the simplest form of data analysis because it describes trends and relationships but doesn’t dig deeper.
Descriptive analytics is relatively accessible and likely something your organization uses daily. Basic statistical software, such as Microsoft Excel or data visualization tools , such as Google Charts and Tableau, can help parse data, identify trends and relationships between variables, and visually display information.
Descriptive analytics is especially useful for communicating change over time and uses trends as a springboard for further analysis to drive decision-making .
Here are five examples of descriptive analytics in action to apply at your organization.
Related: 5 Business Analytics Skills for Professionals
5 Examples of Descriptive Analytics
1. traffic and engagement reports.
One example of descriptive analytics is reporting. If your organization tracks engagement in the form of social media analytics or web traffic, you’re already using descriptive analytics.
These reports are created by taking raw data—generated when users interact with your website, advertisements, or social media content—and using it to compare current metrics to historical metrics and visualize trends.
For example, you may be responsible for reporting on which media channels drive the most traffic to the product page of your company’s website. Using descriptive analytics, you can analyze the page’s traffic data to determine the number of users from each source. You may decide to take it one step further and compare traffic source data to historical data from the same sources. This can enable you to update your team on movement; for instance, highlighting that traffic from paid advertisements increased 20 percent year over year.
The three other analytics types can then be used to determine why traffic from each source increased or decreased over time, if trends are predicted to continue, and what your team’s best course of action is moving forward.
2. Financial Statement Analysis
Another example of descriptive analytics that may be familiar to you is financial statement analysis. Financial statements are periodic reports that detail financial information about a business and, together, give a holistic view of a company’s financial health.
There are several types of financial statements, including the balance sheet , income statement , cash flow statement , and statement of shareholders’ equity. Each caters to a specific audience and conveys different information about a company’s finances.
Financial statement analysis can be done in three primary ways: vertical, horizontal, and ratio.
Vertical analysis involves reading a statement from top to bottom and comparing each item to those above and below it. This helps determine relationships between variables. For instance, if each line item is a percentage of the total, comparing them can provide insight into which are taking up larger and smaller percentages of the whole.
Horizontal analysis involves reading a statement from left to right and comparing each item to itself from a previous period. This type of analysis determines change over time.
Finally, ratio analysis involves comparing one section of a report to another based on their relationships to the whole. This directly compares items across periods, as well as your company’s ratios to the industry’s to gauge whether yours is over- or underperforming.
Each of these financial statement analysis methods are examples of descriptive analytics, as they provide information about trends and relationships between variables based on current and historical data.

3. Demand Trends
Descriptive analytics can also be used to identify trends in customer preference and behavior and make assumptions about the demand for specific products or services.
Streaming provider Netflix’s trend identification provides an excellent use case for descriptive analytics. Netflix’s team—which has a track record of being heavily data-driven—gathers data on users’ in-platform behavior. They analyze this data to determine which TV series and movies are trending at any given time and list trending titles in a section of the platform’s home screen.
Not only does this data allow Netflix users to see what’s popular—and thus, what they might enjoy watching—but it allows the Netflix team to know which types of media, themes, and actors are especially favored at a certain time. This can drive decision-making about future original content creation, contracts with existing production companies, marketing, and retargeting campaigns.
4. Aggregated Survey Results
Descriptive analytics is also useful in market research. When it comes time to glean insights from survey and focus group data, descriptive analytics can help identify relationships between variables and trends.
For instance, you may conduct a survey and identify that as respondents’ age increases, so does their likelihood to purchase your product. If you’ve conducted this survey multiple times over several years, descriptive analytics can tell you if this age-purchase correlation has always existed or if it was something that only occurred this year.
Insights like this can pave the way for diagnostic analytics to explain why certain factors are correlated. You can then leverage predictive and prescriptive analytics to plan future product improvements or marketing campaigns based on those trends.
Related: What Is Marketing Analytics?
5. Progress to Goals
Finally, descriptive analytics can be applied to track progress to goals. Reporting on progress toward key performance indicators (KPIs) can help your team understand if efforts are on track or if adjustments need to be made.
For example, if your organization aims to reach 500,000 monthly unique page views, you can use traffic data to communicate how you’re tracking toward it. Perhaps halfway through the month, you’re at 200,000 unique page views. This would be underperforming because you’d like to be halfway to your goal at that point—at 250,000 unique page views. This descriptive analysis of your team’s progress can allow further analysis to examine what can be done differently to improve traffic numbers and get back on track to hit your KPI.

Using Data to Identify Relationships and Trends
“Never before has so much data about so many different things been collected and stored every second of every day,” says Harvard Business School Professor Jan Hammond in the online course Business Analytics . “In this world of big data, data literacy —the ability to analyze, interpret, and even question data—is an increasingly valuable skill.”
Leveraging descriptive analytics to communicate change based on current and historical data and as a foundation for diagnostic, predictive, and prescriptive analytics has the potential to take you and your organization far.
Do you want to become a data-driven professional? Explore our eight-week Business Analytics course and our three-course Credential of Readiness (CORe) program to deepen your analytical skills and apply them to real-world business problems.

About the Author
Want to create or adapt books like this? Learn more about how Pressbooks supports open publishing practices.
14 Quantitative analysis: Descriptive statistics
Numeric data collected in a research project can be analysed quantitatively using statistical tools in two different ways. Descriptive analysis refers to statistically describing, aggregating, and presenting the constructs of interest or associations between these constructs. Inferential analysis refers to the statistical testing of hypotheses (theory testing). In this chapter, we will examine statistical techniques used for descriptive analysis, and the next chapter will examine statistical techniques for inferential analysis. Much of today’s quantitative data analysis is conducted using software programs such as SPSS or SAS. Readers are advised to familiarise themselves with one of these programs for understanding the concepts described in this chapter.
Data preparation
In research projects, data may be collected from a variety of sources: postal surveys, interviews, pretest or posttest experimental data, observational data, and so forth. This data must be converted into a machine-readable, numeric format, such as in a spreadsheet or a text file, so that they can be analysed by computer programs like SPSS or SAS. Data preparation usually follows the following steps:
Data coding. Coding is the process of converting data into numeric format. A codebook should be created to guide the coding process. A codebook is a comprehensive document containing a detailed description of each variable in a research study, items or measures for that variable, the format of each item (numeric, text, etc.), the response scale for each item (i.e., whether it is measured on a nominal, ordinal, interval, or ratio scale, and whether this scale is a five-point, seven-point scale, etc.), and how to code each value into a numeric format. For instance, if we have a measurement item on a seven-point Likert scale with anchors ranging from ‘strongly disagree’ to ‘strongly agree’, we may code that item as 1 for strongly disagree, 4 for neutral, and 7 for strongly agree, with the intermediate anchors in between. Nominal data such as industry type can be coded in numeric form using a coding scheme such as: 1 for manufacturing, 2 for retailing, 3 for financial, 4 for healthcare, and so forth (of course, nominal data cannot be analysed statistically). Ratio scale data such as age, income, or test scores can be coded as entered by the respondent. Sometimes, data may need to be aggregated into a different form than the format used for data collection. For instance, if a survey measuring a construct such as ‘benefits of computers’ provided respondents with a checklist of benefits that they could select from, and respondents were encouraged to choose as many of those benefits as they wanted, then the total number of checked items could be used as an aggregate measure of benefits. Note that many other forms of data—such as interview transcripts—cannot be converted into a numeric format for statistical analysis. Codebooks are especially important for large complex studies involving many variables and measurement items, where the coding process is conducted by different people, to help the coding team code data in a consistent manner, and also to help others understand and interpret the coded data.
Data entry. Coded data can be entered into a spreadsheet, database, text file, or directly into a statistical program like SPSS. Most statistical programs provide a data editor for entering data. However, these programs store data in their own native format—e.g., SPSS stores data as .sav files—which makes it difficult to share that data with other statistical programs. Hence, it is often better to enter data into a spreadsheet or database where it can be reorganised as needed, shared across programs, and subsets of data can be extracted for analysis. Smaller data sets with less than 65,000 observations and 256 items can be stored in a spreadsheet created using a program such as Microsoft Excel, while larger datasets with millions of observations will require a database. Each observation can be entered as one row in the spreadsheet, and each measurement item can be represented as one column. Data should be checked for accuracy during and after entry via occasional spot checks on a set of items or observations. Furthermore, while entering data, the coder should watch out for obvious evidence of bad data, such as the respondent selecting the ‘strongly agree’ response to all items irrespective of content, including reverse-coded items. If so, such data can be entered but should be excluded from subsequent analysis.

Data transformation. Sometimes, it is necessary to transform data values before they can be meaningfully interpreted. For instance, reverse coded items—where items convey the opposite meaning of that of their underlying construct—should be reversed (e.g., in a 1-7 interval scale, 8 minus the observed value will reverse the value) before they can be compared or combined with items that are not reverse coded. Other kinds of transformations may include creating scale measures by adding individual scale items, creating a weighted index from a set of observed measures, and collapsing multiple values into fewer categories (e.g., collapsing incomes into income ranges).
Univariate analysis
Univariate analysis—or analysis of a single variable—refers to a set of statistical techniques that can describe the general properties of one variable. Univariate statistics include: frequency distribution, central tendency, and dispersion. The frequency distribution of a variable is a summary of the frequency—or percentages—of individual values or ranges of values for that variable. For instance, we can measure how many times a sample of respondents attend religious services—as a gauge of their ‘religiosity’—using a categorical scale: never, once per year, several times per year, about once a month, several times per month, several times per week, and an optional category for ‘did not answer’. If we count the number or percentage of observations within each category—except ‘did not answer’ which is really a missing value rather than a category—and display it in the form of a table, as shown in Figure 14.1, what we have is a frequency distribution. This distribution can also be depicted in the form of a bar chart, as shown on the right panel of Figure 14.1, with the horizontal axis representing each category of that variable and the vertical axis representing the frequency or percentage of observations within each category.

With very large samples, where observations are independent and random, the frequency distribution tends to follow a plot that looks like a bell-shaped curve—a smoothed bar chart of the frequency distribution—similar to that shown in Figure 14.2. Here most observations are clustered toward the centre of the range of values, with fewer and fewer observations clustered toward the extreme ends of the range. Such a curve is called a normal distribution .

Lastly, the mode is the most frequently occurring value in a distribution of values. In the previous example, the most frequently occurring value is 15, which is the mode of the above set of test scores. Note that any value that is estimated from a sample, such as mean, median, mode, or any of the later estimates are called a statistic .

Bivariate analysis
Bivariate analysis examines how two variables are related to one another. The most common bivariate statistic is the bivariate correlation —often, simply called ‘correlation’—which is a number between -1 and +1 denoting the strength of the relationship between two variables. Say that we wish to study how age is related to self-esteem in a sample of 20 respondents—i.e., as age increases, does self-esteem increase, decrease, or remain unchanged?. If self-esteem increases, then we have a positive correlation between the two variables, if self-esteem decreases, then we have a negative correlation, and if it remains the same, we have a zero correlation. To calculate the value of this correlation, consider the hypothetical dataset shown in Table 14.1.

After computing bivariate correlation, researchers are often interested in knowing whether the correlation is significant (i.e., a real one) or caused by mere chance. Answering such a question would require testing the following hypothesis:
![\[H_0:\quad r = 0 \]](https://usq.pressbooks.pub/app/uploads/quicklatex/quicklatex.com-74bb8e9e674477ba33a9eb751bfd254d_l3.png "Rendered by QuickLaTeX.com")
Social Science Research: Principles, Methods and Practices (Revised edition) Copyright © 2019 by Anol Bhattacherjee is licensed under a Creative Commons Attribution-NonCommercial-ShareAlike 4.0 International License , except where otherwise noted.
Share This Book
- Privacy Policy
Home » Descriptive Statistics – Types, Methods and Examples
Descriptive Statistics – Types, Methods and Examples
Table of Contents

Descriptive Statistics
Descriptive statistics is a branch of statistics that deals with the summarization and description of collected data. This type of statistics is used to simplify and present data in a manner that is easy to understand, often through visual or numerical methods. Descriptive statistics is primarily concerned with measures of central tendency, variability, and distribution, as well as graphical representations of data.
Here are the main components of descriptive statistics:
- Measures of Central Tendency : These provide a summary statistic that represents the center point or typical value of a dataset. The most common measures of central tendency are the mean (average), median (middle value), and mode (most frequent value).
- Measures of Dispersion or Variability : These provide a summary statistic that represents the spread of values in a dataset. Common measures of dispersion include the range (difference between the highest and lowest values), variance (average of the squared differences from the mean), standard deviation (square root of the variance), and interquartile range (difference between the upper and lower quartiles).
- Measures of Position : These are used to understand the distribution of values within a dataset. They include percentiles and quartiles.
- Graphical Representations : Data can be visually represented using various methods like bar graphs, histograms, pie charts, box plots, and scatter plots. These visuals provide a clear, intuitive way to understand the data.
- Measures of Association : These measures provide insight into the relationships between variables in the dataset, such as correlation and covariance.
Descriptive Statistics Types
Descriptive statistics can be classified into two types:
Measures of Central Tendency
These measures help describe the center point or average of a data set. There are three main types:
- Mean : The average value of the dataset, obtained by adding all the data points and dividing by the number of data points.
- Median : The middle value of the dataset, obtained by ordering all data points and picking out the one in the middle (or the average of the two middle numbers if the dataset has an even number of observations).
- Mode : The most frequently occurring value in the dataset.
Measures of Variability (or Dispersion)
These measures describe the spread or variability of the data points in the dataset. There are four main types:
- Range : The difference between the largest and smallest values in the dataset.
- Variance : The average of the squared differences from the mean.
- Standard Deviation : The square root of the variance, giving a measure of dispersion that is in the same units as the original dataset.
- Interquartile Range (IQR) : The range between the first quartile (25th percentile) and the third quartile (75th percentile), which provides a measure of variability that is resistant to outliers.
Descriptive Statistics Formulas
Sure, here are some of the most commonly used formulas in descriptive statistics:
Mean (μ or x̄) :
The average of all the numbers in the dataset. It is computed by summing all the observations and dividing by the number of observations.
Formula : μ = Σx/n or x̄ = Σx/n (where Σx is the sum of all observations and n is the number of observations)
The middle value in the dataset when the observations are arranged in ascending or descending order. If there is an even number of observations, the median is the average of the two middle numbers.
The most frequently occurring number in the dataset. There’s no formula for this as it’s determined by observation.
The difference between the highest (max) and lowest (min) values in the dataset.
Formula : Range = max – min
Variance (σ² or s²) :
The average of the squared differences from the mean. Variance is a measure of how spread out the numbers in the dataset are.
Population Variance formula : σ² = Σ(x – μ)² / N Sample Variance formula: s² = Σ(x – x̄)² / (n – 1)
(where x is each individual observation, μ is the population mean, x̄ is the sample mean, N is the size of the population, and n is the size of the sample)
Standard Deviation (σ or s) :
The square root of the variance. It measures the amount of variability or dispersion for a set of data. Population Standard Deviation formula: σ = √σ² Sample Standard Deviation formula: s = √s²
Interquartile Range (IQR) :
The range between the first quartile (Q1, 25th percentile) and the third quartile (Q3, 75th percentile). It measures statistical dispersion, or how far apart the data points are.
Formula : IQR = Q3 – Q1
Descriptive Statistics Methods
Here are some of the key methods used in descriptive statistics:
This method involves arranging data into a table format, making it easier to understand and interpret. Tables often show the frequency distribution of variables.
Graphical Representation
This method involves presenting data visually to help reveal patterns, trends, outliers, or relationships between variables. There are many types of graphs used, such as bar graphs, histograms, pie charts, line graphs, box plots, and scatter plots.
Calculation of Central Tendency Measures
This involves determining the mean, median, and mode of a dataset. These measures indicate where the center of the dataset lies.
Calculation of Dispersion Measures
This involves calculating the range, variance, standard deviation, and interquartile range. These measures indicate how spread out the data is.
Calculation of Position Measures
This involves determining percentiles and quartiles, which tell us about the position of particular data points within the overall data distribution.
Calculation of Association Measures
This involves calculating statistics like correlation and covariance to understand relationships between variables.
Summary Statistics
Often, a collection of several descriptive statistics is presented together in what’s known as a “summary statistics” table. This provides a comprehensive snapshot of the data at a glanc
Descriptive Statistics Examples
Descriptive Statistics Examples are as follows:
Example 1: Student Grades
Let’s say a teacher has the following set of grades for 7 students: 85, 90, 88, 92, 78, 88, and 94. The teacher could use descriptive statistics to summarize this data:
- Mean (average) : (85 + 90 + 88 + 92 + 78 + 88 + 94)/7 = 88
- Median (middle value) : First, rearrange the grades in ascending order (78, 85, 88, 88, 90, 92, 94). The median grade is 88.
- Mode (most frequent value) : The grade 88 appears twice, more frequently than any other grade, so it’s the mode.
- Range (difference between highest and lowest) : 94 (highest) – 78 (lowest) = 16
- Variance and Standard Deviation : These would be calculated using the appropriate formulas, providing a measure of the dispersion of the grades.
Example 2: Survey Data
A researcher conducts a survey on the number of hours of TV watched per day by people in a particular city. They collect data from 1,000 respondents and can use descriptive statistics to summarize this data:
- Mean : Calculate the average hours of TV watched by adding all the responses and dividing by the total number of respondents.
- Median : Sort the data and find the middle value.
- Mode : Identify the most frequently reported number of hours watched.
- Histogram : Create a histogram to visually display the frequency of responses. This could show, for example, that the majority of people watch 2-3 hours of TV per day.
- Standard Deviation : Calculate this to find out how much variation there is from the average.
Importance of Descriptive Statistics
Descriptive statistics are fundamental in the field of data analysis and interpretation, as they provide the first step in understanding a dataset. Here are a few reasons why descriptive statistics are important:
- Data Summarization : Descriptive statistics provide simple summaries about the measures and samples you have collected. With a large dataset, it’s often difficult to identify patterns or tendencies just by looking at the raw data. Descriptive statistics provide numerical and graphical summaries that can highlight important aspects of the data.
- Data Simplification : They simplify large amounts of data in a sensible way. Each descriptive statistic reduces lots of data into a simpler summary, making it easier to understand and interpret the dataset.
- Identification of Patterns and Trends : Descriptive statistics can help identify patterns and trends in the data, providing valuable insights. Measures like the mean and median can tell you about the central tendency of your data, while measures like the range and standard deviation tell you about the dispersion.
- Data Comparison : By summarizing data into measures such as the mean and standard deviation, it’s easier to compare different datasets or different groups within a dataset.
- Data Quality Assessment : Descriptive statistics can help identify errors or outliers in the data, which might indicate issues with data collection or entry.
- Foundation for Further Analysis : Descriptive statistics are typically the first step in data analysis. They help create a foundation for further statistical or inferential analysis. In fact, advanced statistical techniques often assume that one has first examined their data using descriptive methods.
When to use Descriptive Statistics
They can be used in a wide range of situations, including:
- Understanding a New Dataset : When you first encounter a new dataset, using descriptive statistics is a useful first step to understand the main characteristics of the data, such as the central tendency, dispersion, and distribution.
- Data Exploration in Research : In the initial stages of a research project, descriptive statistics can help to explore the data, identify trends and patterns, and generate hypotheses for further testing.
- Presenting Research Findings : Descriptive statistics can be used to present research findings in a clear and understandable way, often using visual aids like graphs or charts.
- Monitoring and Quality Control : In fields like business or manufacturing, descriptive statistics are often used to monitor processes, track performance over time, and identify any deviations from expected standards.
- Comparing Groups : Descriptive statistics can be used to compare different groups or categories within your data. For example, you might want to compare the average scores of two groups of students, or the variance in sales between different regions.
- Reporting Survey Results : If you conduct a survey, you would use descriptive statistics to summarize the responses, such as calculating the percentage of respondents who agree with a certain statement.
Applications of Descriptive Statistics
Descriptive statistics are widely used in a variety of fields to summarize, represent, and analyze data. Here are some applications:
- Business : Businesses use descriptive statistics to summarize and interpret data such as sales figures, customer feedback, or employee performance. For instance, they might calculate the mean sales for each month to understand trends, or use graphical representations like bar charts to present sales data.
- Healthcare : In healthcare, descriptive statistics are used to summarize patient data, such as age, weight, blood pressure, or cholesterol levels. They are also used to describe the incidence and prevalence of diseases in a population.
- Education : Educators use descriptive statistics to summarize student performance, like average test scores or grade distribution. This information can help identify areas where students are struggling and inform instructional decisions.
- Social Sciences : Social scientists use descriptive statistics to summarize data collected from surveys, experiments, and observational studies. This can involve describing demographic characteristics of participants, response frequencies to survey items, and more.
- Psychology : Psychologists use descriptive statistics to describe the characteristics of their study participants and the main findings of their research, such as the average score on a psychological test.
- Sports : Sports analysts use descriptive statistics to summarize athlete and team performance, such as batting averages in baseball or points per game in basketball.
- Government : Government agencies use descriptive statistics to summarize data about the population, such as census data on population size and demographics.
- Finance and Economics : In finance, descriptive statistics can be used to summarize past investment performance or economic data, such as changes in stock prices or GDP growth rates.
- Quality Control : In manufacturing, descriptive statistics can be used to summarize measures of product quality, such as the average dimensions of a product or the frequency of defects.
Limitations of Descriptive Statistics
While descriptive statistics are a crucial part of data analysis and provide valuable insights about a dataset, they do have certain limitations:
- Lack of Depth : Descriptive statistics provide a summary of your data, but they can oversimplify the data, resulting in a loss of detail and potentially significant nuances.
- Vulnerability to Outliers : Some descriptive measures, like the mean, are sensitive to outliers. A single extreme value can significantly skew your mean, making it less representative of your data.
- Inability to Make Predictions : Descriptive statistics describe what has been observed in a dataset. They don’t allow you to make predictions or generalizations about unobserved data or larger populations.
- No Insight into Correlations : While some descriptive statistics can hint at potential relationships between variables, they don’t provide detailed insights into the nature or strength of these relationships.
- No Causality or Hypothesis Testing : Descriptive statistics cannot be used to determine cause and effect relationships or to test hypotheses. For these purposes, inferential statistics are needed.
- Can Mislead : When used improperly, descriptive statistics can be used to present a misleading picture of the data. For instance, choosing to only report the mean without also reporting the standard deviation or range can hide a large amount of variability in the data.
About the author

Muhammad Hassan
Researcher, Academic Writer, Web developer
You may also like

Cluster Analysis – Types, Methods and Examples

Discriminant Analysis – Methods, Types and...

MANOVA (Multivariate Analysis of Variance) –...

Documentary Analysis – Methods, Applications and...

ANOVA (Analysis of variance) – Formulas, Types...

Graphical Methods – Types, Examples and Guide

Bridging the Gap: Overcome these 7 flaws in descriptive research design
Descriptive research design is a powerful tool used by scientists and researchers to gather information about a particular group or phenomenon. This type of research provides a detailed and accurate picture of the characteristics and behaviors of a particular population or subject. By observing and collecting data on a given topic, descriptive research helps researchers gain a deeper understanding of a specific issue and provides valuable insights that can inform future studies.
In this blog, we will explore the definition, characteristics, and common flaws in descriptive research design, and provide tips on how to avoid these pitfalls to produce high-quality results. Whether you are a seasoned researcher or a student just starting, understanding the fundamentals of descriptive research design is essential to conducting successful scientific studies.
Table of Contents
What Is Descriptive Research Design?
The descriptive research design involves observing and collecting data on a given topic without attempting to infer cause-and-effect relationships. The goal of descriptive research is to provide a comprehensive and accurate picture of the population or phenomenon being studied and to describe the relationships, patterns, and trends that exist within the data.
Descriptive research methods can include surveys, observational studies , and case studies, and the data collected can be qualitative or quantitative . The findings from descriptive research provide valuable insights and inform future research, but do not establish cause-and-effect relationships.
Importance of Descriptive Research in Scientific Studies
1. understanding of a population or phenomenon.
Descriptive research provides a comprehensive picture of the characteristics and behaviors of a particular population or phenomenon, allowing researchers to gain a deeper understanding of the topic.
2. Baseline Information
The information gathered through descriptive research can serve as a baseline for future research and provide a foundation for further studies.
3. Informative Data
Descriptive research can provide valuable information and insights into a particular topic, which can inform future research, policy decisions, and programs.
4. Sampling Validation
Descriptive research can be used to validate sampling methods and to help researchers determine the best approach for their study.
5. Cost Effective
Descriptive research is often less expensive and less time-consuming than other research methods , making it a cost-effective way to gather information about a particular population or phenomenon.
6. Easy to Replicate
Descriptive research is straightforward to replicate, making it a reliable way to gather and compare information from multiple sources.
Key Characteristics of Descriptive Research Design
The primary purpose of descriptive research is to describe the characteristics, behaviors, and attributes of a particular population or phenomenon.
2. Participants and Sampling
Descriptive research studies a particular population or sample that is representative of the larger population being studied. Furthermore, sampling methods can include convenience, stratified, or random sampling.
3. Data Collection Techniques
Descriptive research typically involves the collection of both qualitative and quantitative data through methods such as surveys, observational studies, case studies, or focus groups.
4. Data Analysis
Descriptive research data is analyzed to identify patterns, relationships, and trends within the data. Statistical techniques , such as frequency distributions and descriptive statistics, are commonly used to summarize and describe the data.
5. Focus on Description
Descriptive research is focused on describing and summarizing the characteristics of a particular population or phenomenon. It does not make causal inferences.
6. Non-Experimental
Descriptive research is non-experimental, meaning that the researcher does not manipulate variables or control conditions. The researcher simply observes and collects data on the population or phenomenon being studied.
When Can a Researcher Conduct Descriptive Research?
A researcher can conduct descriptive research in the following situations:
- To better understand a particular population or phenomenon
- To describe the relationships between variables
- To describe patterns and trends
- To validate sampling methods and determine the best approach for a study
- To compare data from multiple sources.
Types of Descriptive Research Design
1. survey research.
Surveys are a type of descriptive research that involves collecting data through self-administered or interviewer-administered questionnaires. Additionally, they can be administered in-person, by mail, or online, and can collect both qualitative and quantitative data.
2. Observational Research
Observational research involves observing and collecting data on a particular population or phenomenon without manipulating variables or controlling conditions. It can be conducted in naturalistic settings or controlled laboratory settings.
3. Case Study Research
Case study research is a type of descriptive research that focuses on a single individual, group, or event. It involves collecting detailed information on the subject through a variety of methods, including interviews, observations, and examination of documents.
4. Focus Group Research
Focus group research involves bringing together a small group of people to discuss a particular topic or product. Furthermore, the group is usually moderated by a researcher and the discussion is recorded for later analysis.
5. Ethnographic Research
Ethnographic research involves conducting detailed observations of a particular culture or community. It is often used to gain a deep understanding of the beliefs, behaviors, and practices of a particular group.
Advantages of Descriptive Research Design
1. provides a comprehensive understanding.
Descriptive research provides a comprehensive picture of the characteristics, behaviors, and attributes of a particular population or phenomenon, which can be useful in informing future research and policy decisions.
2. Non-invasive
Descriptive research is non-invasive and does not manipulate variables or control conditions, making it a suitable method for sensitive or ethical concerns.
3. Flexibility
Descriptive research allows for a wide range of data collection methods , including surveys, observational studies, case studies, and focus groups, making it a flexible and versatile research method.
4. Cost-effective
Descriptive research is often less expensive and less time-consuming than other research methods. Moreover, it gives a cost-effective option to many researchers.
5. Easy to Replicate
Descriptive research is easy to replicate, making it a reliable way to gather and compare information from multiple sources.
6. Informs Future Research
The insights gained from a descriptive research can inform future research and inform policy decisions and programs.
Disadvantages of Descriptive Research Design
1. limited scope.
Descriptive research only provides a snapshot of the current situation and cannot establish cause-and-effect relationships.
2. Dependence on Existing Data
Descriptive research relies on existing data, which may not always be comprehensive or accurate.
3. Lack of Control
Researchers have no control over the variables in descriptive research, which can limit the conclusions that can be drawn.
The researcher’s own biases and preconceptions can influence the interpretation of the data.
5. Lack of Generalizability
Descriptive research findings may not be applicable to other populations or situations.
6. Lack of Depth
Descriptive research provides a surface-level understanding of a phenomenon, rather than a deep understanding.
7. Time-consuming
Descriptive research often requires a large amount of data collection and analysis, which can be time-consuming and resource-intensive.
7 Ways to Avoid Common Flaws While Designing Descriptive Research
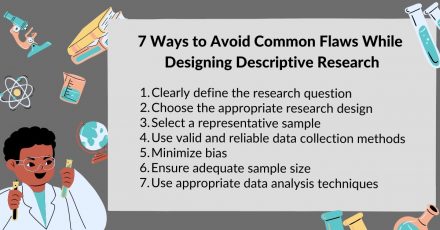
1. Clearly define the research question
A clearly defined research question is the foundation of any research study, and it is important to ensure that the question is both specific and relevant to the topic being studied.
2. Choose the appropriate research design
Choosing the appropriate research design for a study is crucial to the success of the study. Moreover, researchers should choose a design that best fits the research question and the type of data needed to answer it.
3. Select a representative sample
Selecting a representative sample is important to ensure that the findings of the study are generalizable to the population being studied. Researchers should use a sampling method that provides a random and representative sample of the population.
4. Use valid and reliable data collection methods
Using valid and reliable data collection methods is important to ensure that the data collected is accurate and can be used to answer the research question. Researchers should choose methods that are appropriate for the study and that can be administered consistently and systematically.
5. Minimize bias
Bias can significantly impact the validity and reliability of research findings. Furthermore, it is important to minimize bias in all aspects of the study, from the selection of participants to the analysis of data.
6. Ensure adequate sample size
An adequate sample size is important to ensure that the results of the study are statistically significant and can be generalized to the population being studied.
7. Use appropriate data analysis techniques
The appropriate data analysis technique depends on the type of data collected and the research question being asked. Researchers should choose techniques that are appropriate for the data and the question being asked.
Have you worked on descriptive research designs? How was your experience creating a descriptive design? What challenges did you face? Do write to us or leave a comment below and share your insights on descriptive research designs!

extremely very educative
Indeed very educative and useful. Well explained. Thank you
Simple,easy to understand
Rate this article Cancel Reply
Your email address will not be published.

Enago Academy's Most Popular Articles

- Publishing Research
- Reporting Research
How to Optimize Your Research Process: A step-by-step guide
For researchers across disciplines, the path to uncovering novel findings and insights is often filled…

- Industry News
- Trending Now
Breaking Barriers: Sony and Nature unveil “Women in Technology Award”
Sony Group Corporation and the prestigious scientific journal Nature have collaborated to launch the inaugural…

Achieving Research Excellence: Checklist for good research practices
Academia is built on the foundation of trustworthy and high-quality research, supported by the pillars…

- Promoting Research
Plain Language Summary — Communicating your research to bridge the academic-lay gap
Science can be complex, but does that mean it should not be accessible to the…

Science under Surveillance: Journals adopt advanced AI to uncover image manipulation
Journals are increasingly turning to cutting-edge AI tools to uncover deceitful images published in manuscripts.…
Choosing the Right Analytical Approach: Thematic analysis vs. content analysis for…
Comparing Cross Sectional and Longitudinal Studies: 5 steps for choosing the right…
Research Recommendations – Guiding policy-makers for evidence-based decision making

Sign-up to read more
Subscribe for free to get unrestricted access to all our resources on research writing and academic publishing including:
- 2000+ blog articles
- 50+ Webinars
- 10+ Expert podcasts
- 50+ Infographics
- 10+ Checklists
- Research Guides
We hate spam too. We promise to protect your privacy and never spam you.
I am looking for Editing/ Proofreading services for my manuscript Tentative date of next journal submission:

What should universities' stance be on AI tools in research and academic writing?
- Open access
- Published: 27 April 2024
Exploring health care providers’ engagement in prevention and management of multidrug resistant Tuberculosis and its factors in Hadiya Zone health care facilities: qualitative study
- Bereket Aberham Lajore 1 na1 nAff5 ,
- Yitagesu Habtu Aweke 2 na1 nAff6 ,
- Samuel Yohannes Ayanto 3 na1 nAff7 &
- Menen Ayele 4 nAff5
BMC Health Services Research volume 24 , Article number: 542 ( 2024 ) Cite this article
Metrics details
Engagement of healthcare providers is one of the World Health Organization strategies devised for prevention and provision of patient centered care for multidrug resistant tuberculosis. The need for current research question rose because of the gaps in evidence on health professional’s engagement and its factors in multidrug resistant tuberculosis service delivery as per the protocol in the prevention and management of multidrug resistant tuberculosis.
The purpose of this study was to explore the level of health care providers’ engagement in multidrug resistant tuberculosis prevention and management and influencing factors in Hadiya Zone health facilities, Southern Ethiopia.
Descriptive phenomenological qualitative study design was employed between 02 May and 09 May, 2019. We conducted a key informant interview and focus group discussions using purposely selected healthcare experts working as directly observed treatment short course providers in multidrug resistant tuberculosis treatment initiation centers, program managers, and focal persons. Verbatim transcripts were translated to English and exported to open code 4.02 for line-by-line coding and categorization of meanings into same emergent themes. Thematic analysis was conducted based on predefined themes for multidrug resistant tuberculosis prevention and management and core findings under each theme were supported by domain summaries in our final interpretation of the results. To maintain the rigors, Lincoln and Guba’s parallel quality criteria of trustworthiness was used particularly, credibility, dependability, transferability, confirmability and reflexivity.
Total of 26 service providers, program managers, and focal persons were participated through four focus group discussion and five key informant interviews. The study explored factors for engagement of health care providers in the prevention and management of multidrug resistant tuberculosis in five emergent themes such as patients’ causes, perceived susceptibility, seeking support, professional incompetence and poor linkage of the health care facilities. Our findings also suggest that service providers require additional training, particularly in programmatic management of drug-resistant tuberculosis.
The study explored five emergent themes: patient’s underlying causes, seeking support, perceived susceptibility, professionals’ incompetence and health facilities poor linkage. Community awareness creation to avoid fear of discrimination through provision of support for those with multidrug resistant tuberculosis is expected from health care providers using social behavioral change communication strategies. Furthermore, program managers need to follow the recommendations of World Health Organization for engaging healthcare professionals in the prevention and management of multidrug resistant tuberculosis and cascade trainings in clinical programmatic management of the disease for healthcare professionals.
Peer Review reports
Introduction
Mycobacterium tuberculosis, the infectious agent that causes multi-drug resistant tuberculosis (MDR-TB), is resistant to at least rifampicin and isoniazid. Direct infection can cause the disease to spread, or it can develop secondary to improper management of tuberculosis among drug susceptible tuberculosis cases and associated poor adherence [ 1 ].
Multidrug-resistant strains of mycobacterium tuberculosis have recently emerged, which makes achieving “End TB Strategy” more difficult [ 2 ]. Multi drug resistant tuberculosis (MDR-TB) has been found to increasingly pose a serious threat to global and Ethiopian public health sector. Despite the fact that a number of risk factors for MDR-TB have been identified through various research designs, the epidemiology of this disease is complex, contextual, and multifaceted [ 1 ]. Quantitative studies demonstrate that prior treatment history [ 3 , 4 , 5 , 6 , 7 ], interrupted drug supply [ 8 ], inappropriate treatments and poor patient compliance [ 3 , 7 , 9 ], poor quality directly observed treatment short course (DOTS), poor treatment adherence [ 10 ], age [ 5 ], and malnutrition [ 11 ] were factors associated with multi drug resistant TB.
Globally, an estimated 20% of previously treated cases and 3.3% of new cases are thought to have MDR-TB; these levels have essentially not changed in recent years. Globally, 160,684 cases of multidrug-resistant TB and rifampicin-resistant TB (MDR/RR-TB) were notified in 2017, and 139,114 cases were enrolled into treatment in 2017 [ 12 ]. A systematic review in Ethiopia reported 2% prevalence of MDR-TB [ 3 ] that is higher than what is observed in Sub-Saharan Africa, 1.5% [ 13 ]. The prevalence of MDR-TB, according to the national drug-resistant tuberculosis (DR-TB) sentinel report, was 2.3% among newly diagnosed cases of TB and 17.8% among cases of TB who had already received treatment,. This suggests a rising trend in the prevalence of TB drug resistance compared to the results of the initial drug-resistant TB survey carried out in Ethiopia from 2003 to 2005 [ 14 ].
Ethiopia has placed strategies into place that emphasize political commitment, case finding, appropriate treatment, a continuous supply of second-line anti-TB medications of high quality, and a recording system. Due to other competing health priorities, the nation is having difficulty accelerating the scale-up of the detection, enrollment and treatment of drug-resistant TB patients [ 15 , 16 ]. To address these issues, the nation switched from a hospital-based to a clinic-based ambulatory model of care, which has allowed MDR-TB services to quickly decentralize and become more accessible. Accordingly, the nation has set up health facilities to act as either treatment initiating centers (TIC) or treatment follow-up centers (TFC) or both for improved referral and communication methods [ 15 ].
One of the key components of the “End TB strategy” is engagement of health care professionals in the prevention and management of multidrug resistant tuberculosis [ 17 ]. Inadequate engagement of healthcare providers is one aspect of the healthcare system that negatively influences MDR-TB prevention and control efforts [ 17 ]. This may be manifested in a number of ways, including inadequate understanding of drug-resistant tuberculosis, improper case identification, failure to initiate treatment again, placement of the wrong regimens, improper management of side effects and poor infection prevention [ 1 ]. These contributing factors are currently being observed in Ethiopia [ 18 ], Nigeria [ 7 , 19 , 20 ] and other countries [ 21 , 22 ]. According to a study conducted in Ethiopia, MDR-TB was linked to drug side effects from first-line treatments, being not directly observed, stopping treatment for at least a day, and retreating with a category II regimen [ 17 ].
This may be the result of a synergy between previously investigated and other contextual factors that have not yet been fully explored, such as professional engagement, beliefs, and poor preventive practices. The engagement of health professionals in MDR-TB prevention and control is assessed using a number of composite indicators. Health professionals may interact primarily inside the healthcare facilities. Typically, they play a significant role in connecting healthcare services with neighborhood-based activities [ 17 ]. One of the main research areas that have not sufficiently addressed is evidence indicating the status of healthcare professionals’ engagement and contextual factors in MDR-TB prevention and management.
It is increasingly urgent to identify additional and existing factors operating in a particular context that contribute to the development of the disease in light of the epidemic of drug resistance, including multi-drug resistance (MDR-TB) and extensively drug resistant TB (XDR-TB) in both new and previously treated cases of the disease [ 23 ]. In order to develop and implement control measures, it is therefore essential to operationally identify a number of contextual factors operating at the individual, community, and health system level.
Therefore, the overall purpose of this study was to explore the level of engagement of health care providers and contextual factors hindering/enabling the prevention and provision of patient-centered care for MDR-TB in health facilities, DOTS services centers and MDR-TB treatment initiation center [TIC], in Hadiya Zone, Southern Ethiopia.
Qualitative approach and research paradigm
Descriptive phenomenological qualitative study design was employed to explore factors influencing engagement of health professionals in MDR-TB prevention and management and thematic technique was employed for the analysis of the data.
Researchers’ characteristics and reflexivity
Three Principal investigators conducted this study. Two of them had Masters of public health in Epidemiology and Reproductive health and PhD candidates and the third one had Bachelor’s degree in public health with clinical experience in the area of Tuberculosis prevention and management and MPH in Biostatistics. The principal investigators have research experience with published articles in different reputable journals. There were no prior contacts between researchers and participants before the study whereas researchers have built positive rapport with study participants during data collection to foster open communication and trust and had no any assumptions and presuppositions about the research topic and result.
Context/ study setting and period
The study was conducted between 2 and 9 May, 2019 in Hadiya Zone with more than 1.7 million people residing in the Zone. There are 300 health posts, 63 health centers, 3 functional primary hospitals and 1 comprehensive specialized hospital in the Zone. Also, there are more than 350 private clinics and 1 private hospital in the Zone. All of the public health facilities and some private health facilities provide directly observed short course treatment (DOTS) service for tuberculosis patients. There are more than eight treatment initiation centers (TICs) for MDR-TB patients in Hadiya Zone. MDR-TB (Multidrug-resistant tuberculosis) treatment initiation centers are specialized facilities that provide comprehensive care, diagnosis and treatment initiation, psychosocial support, and follow up services to individuals with MDR-TB. The linkage between MDR-TB treatment initiation centers and other healthcare facilities lies in the coordination of care, referral pathways, and collaboration to ensure comprehensive and integrated care for individuals with MDR-TB. Overall, healthcare providers play a crucial role in the management of MDR-TB by providing specialized care, ensuring treatment adherence, monitoring progress and outcomes, and supporting individuals in achieving successful treatment outcomes and improved health.
Units of study and sampling strategy
Our study participants were health care professionals working in MDR-TB TICs in both private and public health facilities, and providing DOTS services, MDR-TB program leaders in treatment initiation centers, as well as TB focal persons, disease prevention and health promotion focal person, and project partners from district health offices. The study involved four focus group discussion (FGDs) and five key informants’ interview (KII) with a total of 26 participants to gather the necessary information. Expert purposive sampling technique was employed and sample size was determined based on the saturation of idea required during data collection process.
Data collection methods and instruments
Focus group discussion and face to face key informants’ interviews were employed to collect the data. We conducted a total of four FGD and five key informants’ interviews with participants chosen from DOTS providing health facilities and MDR-TB program leaders in treatment initiation centers, as well as TB focal persons and project partners from district health offices and disease prevention and health promotion focal person. One of the FGDs was conducted among health professionals from the public MDR-TB treatment initiation centers. Three FGDs were conducted among disease prevention and health promotion focal persons, TB focal persons and DOTS providers in public health facilities (health centers).
An observation checklist was developed to assess the general infection prevention and control measures used by specific healthcare facilities in the study area. We used unstructured FGD guide, key informant interview guide, observation checklist and audio recorders to collect primary data and it was collected using local language called Amharic. Prior to data collection, three people who are not among principal investigators with at least a master’s degree in public health and prior experience with qualitative research were trained by principal investigators. Three of them acts as a tape recorder, a moderator, and as a note taker alternatively. The length of FGD ranged from 58 to 82 min and that of key informants’ interview lasted from 38 to 56 min.
Data processing and data analysis
Memos were written immediately after interviews followed by initial analysis. Transcription of audio records was performed by principal investigators. The audio recordings and notes were refined, cleaned and matched at the end of each data collection day to check for inconsistencies, correct errors, and modify the procedures in response to evolving study findings for subsequent data collection. Transcribed interviews, memos, and notes from investigator’s observation were translated to English and imported to Open Code 4.02 [ 2 ] for line by line coding of data, and categorizing important codes (sub theming). The pre-defined themes for MDR-TB prevention and control engagement were used to thematize the line-by-line codes, categories, and meanings using thematic analysis. Finally, the phenomenon being studied was explained by emerging categories and themes. Explanations in themes were substantiated by participants’ direct quotations when necessary.
Trustworthiness
Phone calls and face to face briefing were requested from study participants when some expressions in the audio seems confusing while transcripts were performed. To ensure the credibility of the study, prolonged engagement was conducted, including peer debriefing with colleagues of similar status during data analysis and inviting available study participants to review findings to ensure as it is in line with their view or not. Memos of interviews and observation were crosschecked while investigator was transcribing to ensure credibility of data as well as to triangulate investigator’s categorizing and theming procedures. For transferability, clear outlines of research design and processes were provided, along with a detailed study context for reader judgment. Dependability was ensured through careful recording and transcription of verbal and non-verbal data, and to minimize personal bias, scientific procedures were followed in all research stages. Conformability was maintained by conducting data transcription, translation, and interpretation using scientific methods. Researchers did all the best to show a range of realities, fairly and faithfully. Finally, an expert was invited to put sample of codes and categories to emerged corresponding categories and themes respectively.
Demographic characteristics of study participants
Four focus group discussions and five key informants’ interviews were conducted successfully. There were 26 participants in four focus group discussions, and key informants’ interview. Ages of participants ranges from 20 to 50 years with an average age of 33.4 ± 6.24 SD years. Participants have five to ten years of professional experience with DOTS services (Table 1 ).
Emergent themes and subthemes
The study explored how health care providers’ engagement in MDR-TB prevention and management was influenced. The investigation uncovered five major themes. These themes were the patient’s underlying causes, seeking support, perceived susceptibility, healthcare providers’ incompetence, and poor linkage between health facilities. Weak community TB prevention, health system support, and support from colleagues were identified subthemes in the search for help by health professionals whereas socioeconomic constraints, lack of awareness, and fear of discrimination were subthemes under patients underlying factors (Fig. 1 ).

Themes and subthemes emerged from the analysis of health professionals’ engagement in MDR-TB prevention and management study in Hadiya zone’s health facilities, 2019
The patient’s underlying causes
This revealed why TB/MDR-TB treatment providers believe health professionals are unable to provide standard MDR-TB services. The subthemes include TB/MDR-TB awareness, fear of discrimination, and patients’ socioeconomic constraints.
Socioeconomic constraints
According to our research, the majority of healthcare professionals who provided directly observed short-course treatment services mentioned socioeconomic constraints as barriers to engage per standard and provide MDR-TB prevention and management service. More than half of the participants stated that patients’ primary reasons include lack of money for house rental close to the treatment centers, inability to afford food and other expenses, and financial constraints to cover transportation costs.
In addition to this, patients might have additional responsibilities to provide food and cover other costs for their families’ need. The majority of health care professionals thought that these restrictions led to their poor engagement in MDR-TB prevention and management. One of the focus groups’ discussants provided description of the scenario in the following way:
“…. I have many conversations with my TB/MDR-TB patients. They fail to complete DOTS or treatment intensive care primarily as a result of the requirement of prolonged family separation. They might provide most of the family needs, including food and other expenses” (FGD-P01).
Lack of awareness about MDR-TB
This subtheme explains how MDR-TB patients’ knowledge of the illness can make it more difficult for health professionals to provide DOTS or TICs services. The majority of DOTS providers stated that few TB or MDR-TB patients were aware of how MDR-TB spreads, how it is treated, and how much medication is required. Additionally, despite the fact that they had been educated for the disease, majority of patients did not want to stop contact with their families or caregivers. A health care provider stated,
“…. I provided health education for MDR-TB patients on how the disease is transmitted and how they should care for their family members. They don’t care; however, give a damn about their families .” (FGD-P05).
Some healthcare professionals reported that some patients thought that MDR-TB could not be cured by modern medication. One medical professional described the circumstance as follows:
“…. I noticed an MDR-TB patient who was unwilling to be screened. He concluded that modern medication is not effective and he went to spiritual and traditional healers” (FGD-P02).
As a result, almost all participants agreed on the extent to which patient knowledge of TB and MDR-TB can influence a provider’s engagement to MDR-TB services. The majority suggested that in order to improve treatment outcomes and preventive measures, the media, community leaders, health development armies, one-to-five networks, non-governmental organizations, treatment supporters, and other bodies with access to information need to put a lot of efforts.
Fear of discrimination
According to our research, about a quarter of healthcare professionals recognized that patients’ fear of discrimination prevents them from offering MDR-TB patients the DOTS services they need, including counseling index cases and tracing contact histories.
HEWs, HDAs, and 1-to-5 network members allegedly failed to monitor and counsel the index cases after their immediate return to their homes, according to the opinions from eight out of twenty-six healthcare professionals. The patients began to engage in routine social and political activities with neighbors while hiding their disease status. A healthcare professional described this situation as follows:
“…. I understood from my MDR-TB patient’s words that he kept to himself and avoided social interaction. He made this decision as a result of stigmatization by locals, including health extension workers. As a result, the patient can’t attend social gatherings. …. In addition, medical professionals exclude MDR-TB patients due to fear of exposures. As a result, patients are unwilling to undergo early screening” (FGD-P04).
Professionals’ perceived risk of occupational exposure
This theme highlights the anxiety that healthcare workers experience because of MDR-TB exposure when providing patient care. Our research shows that the majority of health professionals viewed participation as “taking coupons of death.” They believed that regardless of how and where they engaged in most healthcare facilities, the risk of exposure would remain the same. According to our discussion and interview, lack of health facility’s readiness takes paramount shares for the providers’ risk of exposures and their susceptibility.
According to the opinion from the majority of FGD discussants and in-depth interviewees, participants’ self-judgment score and our observation, the majority of healthcare facilities that offer DOTS for DS-TB and MDR-TB did not create or uphold standards in infection prevention in the way that could promote better engagement. These include poor maintenance of care facilities, lack of personal protective equipment, unsuitable facility design for service provision, lack of patient knowledge regarding the method of MDR-TB transmission, and lack of dedication on the part of health care staff.
As one of our key informant interviewees [District Disease Prevention Head], described health professionals’ low engagement has been due to fear of perceived susceptibility. He shared with us what he learned from a community forum he moderated.
Community forum participant stated that “… There was a moment a health professional run-away from the TB unit when MDR-TB patient arrived. At least they must provide the necessary service, even though they are not willing to demonstrate respectful, compassionate, or caring attitude to MDR-TB patients” (KII-P01). Besides , one of the FGD discussants described the circumstance as follows:
“…. Emm…. Because most health facilities or MDR-TB TIC are not standardized, I am concerned about the risk of transmission. They are crammed together and poor ventilation is evident as well as their configuration is improper. Other medical services are causing the TICs to become overcrowded. Most patients and some medical professionals are unconcerned with disease prevention ” (FGD-P19).
Participants’ general fear of susceptibility may be a normal psychological reaction and may serve as a motivation for taking preventative actions. However, almost all participants were concerned that the main reasons for their fear were brought up by the improper application of programmatic management and MDR-TB treatment standards and infection prevention protocols in healthcare facilities.
Health care providers’ incompetence
This theme illustrates how professionalism and dedication impact participation in MDR-TB prevention and management. The use of DS-TB prevention and management by health professionals was also taken into account because it is a major factor in the development of MDR-TB. This theme includes the participants’ perspectives towards other healthcare workers involved in and connected to MDR-TB.
Nearly all of the participants were aware of the causes and danger signs of MDR-TB. The majority of the defined participants fit to the current guidelines. However, participants in focus groups and key informant interviews have brought up shortcomings in MDR-TB service delivery practice and attitude. We looked at gaps among healthcare professionals’ knowledge, how they use the national recommendations for programmatic management and prevention of MDR-TB, prevent infections, take part in community MDR-TB screenings, and collaborate with other healthcare professionals for better engagement.
More than half of the participants voiced concerns about their attitudes and skill sets when using MDR-TB prevention and management guideline. When asked about his prior experiences, one of the focus group participants said:
“…. Ok, let me tell you my experience, I was new before I attended a training on MDR-TB. I was unfamiliar with the MDR-TB definition given in the recommendations. When I was hired, the health center’s director assigned me in the TB unit. I faced difficulties until I received training” (FGD-P24). Furthermore , one of the key informant interview participants shared a story: “…. In my experience, the majority of newly graduated health professionals lack the required skill. I propose that pre-service education curricula to include TB/MDR-TB prevention and management guideline trainings” (KII-P01).
The majority of participants mentioned the skill gap that was seen among health extension workers and laboratory technicians in the majority of healthcare facilities. Some of the participants in the in-depth interviews and FGD described the gaps as follows:
“…. According to repeated quality assurance feedbacks, there are many discordant cases in our [ District TB Focal Person ] case. Laboratory technicians who received a discrepant result (KII-P01) are not given training which is augmented by shared story from FGD discussants, “According to the quality assurance system, laboratory technicians lack skill and inconsistent results are typical necessitating training for newly joining laboratory technicians” (FGD-P20).
Through our discussions, we explored the level of DOTS providers’ adherence to the current TB/MDR-TB guideline. As a result, the majority of participants pointed out ineffective anti-TB management and follow-up care. One of the participants remembered her practical experience as follows:
“…. In my experience, the majority of health professionals fail to inform patients about the drug’s side effects, follow-up procedures, and other techniques for managing the burden of treatment. Only the anti-TB drug is provided, and the patient is left alone. The national treatment recommendation is not properly implemented by them” (FGD-P04).
Many barriers have been cited as reasons that might have hindered competencies for better engagement of health professionals. Training shortage is one of the major reasons mentioned by many of the study participants. One of discussants from private health facility described the problem as
“…. We are incompetent, in my opinion. Considering that we don’t attend update trainings. Many patients who were diagnosed negative at private medical facilities turned out to be positive, and vice versa which would be risky for drug resistance” (FGD-P14) which was supported by idea from a participant in our in-depth interview: “…. We [Program managers] are running short of training for our health care providers at different health centers and revealed that four out of every five healthcare professionals who work in various health centers are unaware of the TB/MDR-TB new guideline” (KII-P02).
Seeking support
This theme focuses on the significance and effects of workplace support in the engagement of MDR-TB prevention and control. This also explains the enabling and impeding elements in the engagement condition of health professionals. Three elements make up the theme: coworkers (other health professionals) in the workplace, support from community TB prevention actors, and a healthcare system.
Support from community TB prevention actors
This subtheme includes the assistance provided to study participants by important parties such as community leaders, the health development army, and other stakeholders who were involved in a community-based TB case notification, treatment adherence, and improved patient outcomes.
Many of the study participants reported that health extension workers have been poorly participating in MDR-TB and TB-related community-based activities like contact tracing, defaulter tracing, community forums, health promotion, and treatment support. One study participant described their gap as follows:
“…. I understood that people in the community were unaware of MDR-TB. The majority of health extension workers do not prioritize raising community awareness of MDR-TB” (FGD-P13). This was supported by idea from a district disease prevention head and stated as: “…. There is no active system for contacts tracing. Health educators send us information if they find suspected cases. However, some patients might not show up as expected. We have data on three family members who tested positive for MDR-TB” (KII-P3).
Support from a health system
The prime focus of this subtheme is on the enabling elements that DOTS providers require assistance from the current healthcare system for better engagement. All study participants expressed at least two needs to be met from the health system in order for them to effectively participate in MDR-TB prevention, treatment, and management. All study participants agreed that issues with the health system had a negative impact on their engagement in the prevention, treatment, diagnosis, and management of MDR-TB in almost all healthcare facilities. Poor conditions in infrastructure, resources (supplies, equipment, guidelines, and other logistics), capacity building (training), supportive supervision, establishment of public-private partnerships, and assignment of motivated and trained health professionals are some of the barriers that needs to be worked out in order to make them engage better. One of the participants pronounces supplies and logistics problems as:
“…. The health center I worked in is listed as a DOTS provider. However, it lacks constant electricity, a working microscope, lab supplies, medications, etc, and we refer suspected cases to nearby health centers or district hospitals for AFB-examination and, “Sometimes we use a single kit for many patients and wait for the medication supply for three or more weeks and patients stops a course of therapy that might induce drug resistance” (FGD-PI04) which was augmented by statement from FGD participant who works at a treatment initiation center: “…. We faced critical shortage of supplies and hospital administrators don’t care about funding essential supplies for patient care. For instance, this hospital (the hospital in which this FGD was conducted) can easily handle N-95 masks. Why then they (hospital administrators working in some TIC) can’t do it?” (FGD-P18).”
Regarding in-service training on MDR-TB, almost all participants pointed out shortage of on-job training mechanisms. One of our FGD participants said:
“…. I missed the new training on MDRTB programmatic management guidelines. I’ve heard that new updates are available. I still work using the old standard” (FGD-PI05). A health professional working in private clinic heightens the severity of training shortage as: “…. We have not participated in TB/MDR-TB guidelines training. You know, most of for-profit healthcare facilities do not provide any training for their staff. I’m not sure if I’m following the (TB/MDR-TB) guideline” (FGD-P14). One of our key informant interview participants; MDR-TB center focal person suggested the need for training as: “…. I’ve received training on the MDR-TB services and public-private partnership strategy. It was crucial in my opinion for better engagement. It is provided for our staff [MDRTB center focal person]. However, this has not yet been expanded to other health facilities” (KII-P04).
Concerning infrastructures, transportation problem was one of the frequently mentioned obstacles by many participants that hinder engagement in MDR-TB/TB service. This factor had a negative impact to both sides (health professionals and patients). One of discussants said:
“…. I face obstacles such as transport cost to perform effective TB/MDR-TB outreach activities like health education, tracing family contacts and defaulters and community mobilization. Rural kebeles are far apart from each other. How can I support 6 rural Kebeles?” (FGD-P01). One of the participants; MDR-TB treatment centers supervisor/program partner seconded the above idea as: “…. I suggest government must establish a system to support health professionals working in remote health care facilities in addition to MDR-TB centers. I guess there are more than 30 government health centers and additional private clinics. We can’t reach them all due to transportation challenges” (KII-P05). One of the participants , a district disease prevention head added: “…. Our laboratory technicians take sample from MDR-TB suspects to the post office and then, the post office sends to MDR-TB site. Sometimes, feedback may not reach timely. There is no any system to cover transportation cost. That would make case detection challenging” (FGD-P02).
Support from colleagues
Study participants stated the importance of having coworker with whom they could interconnect. However, eight participants reported that they were discriminated by their workmates for various reasons, such as their perceived fear of exposure to infection and their perception as if health professionals working in TB/MDR-TB unit get more training opportunities and other incentives. One of the focus group discussants said:
“…. My colleagues [health professional working out of MDR-TB TICs] stigmatize us only due to our work assignment in MDR-TB clinic. I remember that one of my friends who borrowed my headscarf preferred to throw it through a window than handing-over it back safely. Look, how much other health professionals are scared of working in MDR-TB unit. This makes me very upset. I am asking myself that why have I received such training on MDR-TB?” (FGD-P04).
Some of the participants also perceived that, health professionals working in MDR-TB/TB unit are the only responsible experts regarding MDR-TB care and treatment. Because, other health professionals consider training as if it is an incentive to work in such units. One of the FGD discussants described:
“… Health professionals who work in other service units are not volunteer to provide DOTS if TB focal person/previously trained staffs are not available. Patients wait for longer time” (FGD-P11).
Health facilities’ poor linkage
This theme demonstrates how various healthcare facilities, including private and public healthcare facilities such as, health posts, health care centers and hospitals, and healthcare professionals working at various levels of the healthcare system in relation to TB/MDR-TB service, are inter-linked or communicating with one another.
Many study participants noted a lack of coordination between higher referral hospitals, TB clinics, health posts, and health centers. Additionally, the majority of the assigned healthcare professionals had trouble communicating with patients and their coworkers. A focus group discussant also supported this idea as
“…. There is a lack of communication between us [DOTS providers at treatment initiation centers] and health posts, health centers, and private clinics. We are expected to support about 30 public health facilities. It’s of too much number, you know. They are out of our reach. We only took action when a problem arose” (FGD-P16).
Significant number of participants had raised the problem of poor communication between health facilities and treatment initiation centers. One of the interviewees [program manager] said:
“…. I see that one of our challenges is the weak referral connections between treatment initiation centers and health centers. As a result, improper sample transfer to Gene- Xpert sites and irregular postal delivery are frequent” . “Our; DOTS staff at the MDR-TB center, DOTS staff at the health center, and health extension workers are not well connected to one another. Many patients I encountered came to this center [MDR-TB center] after bypassing both health post and health center. Poor linkage and communication, in my opinion, could be one of the causes. The same holds true for medical facilities that are both public and private ” (KII-P02).
Engagement of individual healthcare providers is one of the peculiar interventions to achieve the goal of universal access to drug resistance tuberculosis care and services [ 17 ]. Healthcare providers engagement in detecting cases, treating and caring for multidrug resistant tuberculosis (MDR-TB) may be influenced by various intrinsic (individual provider factors) and extrinsic (peer, health system, political and other factors) [ 15 ]. Our study explored engagement of individual DOTS providers and factors that influence their engagement in MDR-TB prevention and management service. This is addressed through five emergent themes and subthemes as clearly specified in our results section.
The findings showed patients’ socioeconomic constraints were important challenges that influence health professionals’ engagement, and provision of MDR-TB prevention and management services. Although approaches differ, studies in Ethiopia [ 24 ], South Africa [ 25 ] and India [ 26 , 27 ] documented that such factors influence health providers’ engagement in the prevention and management of multi drug resistant tuberculosis. Again, the alleviation of these factors demands the effort from patients, stakeholders working on TB, others sectors, and the healthcare system so that healthcare providers can deliver the service more effectively in their day-to-day activities and will be more receptive to the other key factors.
We explored participants’ experiences on how patients’ awareness about drug sensitive or multi drug resistant tuberculosis influenced their engagement. Accordingly, participants encountered numerous gaps that restricted their interactions with TB/MDR-TB patients. In fact, our study design and purposes vary, studies [ 28 , 29 , 30 ] indicated that patients awareness influenced providers decision in relation to MDR-TB services and patients’ awareness status is among factors influencing healthcare providers’ decision making about the care the MDR-TB patient receives. As to our knowledge, patients’ perceived fear of discrimination was not documented whether it had direct negative impact on reducing providers’ engagement. Therefore, patients’ awareness creation is an important responsibility that needs to be addressed by the community health development army, health extension workers, all other healthcare providers and stakeholder for better MDR-TB services and patient outcomes.
Our study indicates that healthcare providers perceived that they would be exposed to MDR-TB while they are engaged. Some of the participants were more concerned about the disadvantages of engagement in providing care to MDR-TB patients which were predominantly psychological and physical pressure. In this context, the participants emphasized that engagement in MDR-TB patient care is “always being at risk” and expressed a negative attitude. This finding is similar to what has been demonstrated in a cross-sectional study conducted in South Africa in which majority of healthcare providers believed their engagement in MDR-TB services would risk their health [ 21 ].
However, majority of the healthcare providers demonstrated perceived fear of exposures mainly due to poor infection prevention practices and substandard organization of work environment in most TB/MDR-TB units. This is essentially reasonable fear, and needs urgent intervention to protect healthcare providers from worsening/reducing their effective engagement in MDR-TB patient care. On the other side of the coin, perceived risk of occupational exposure to infection could be source for taking care of oneself to combat the spread of the infection.
In our study, healthcare provider’s capability (competence) also had an impact on their ability to engage in prevention and management of MDR-TB. Here, participants had frequently raised their and other healthcare providers’ experience regarding skill gaps, negative attitude towards the service unit they were working in, ineffective use of MDR-TB guideline, poor infection prevention practices and commitment. In addition, many health professionals report serious problems regarding case identification and screening, drug administration, and side effect management. These findings were supported by other studies in Ethiopia [ 7 ] and in Nigeria [ 19 , 20 ]. This implies an urgent need for training of health care worker on how to engage in prevention and management of multidrug resistant TB.
Moreover, our findings provide insights into the role of community TB prevention actors, currently functioning health system, and colleagues and other stakeholders’ regarding healthcare providers’ engagement. Participants emphasized that support from community TB prevention actors is a key motivation to effectively engage on management and prevention roles towards MDR-TB. Evidence shows that community TB prevention is one of the prominent interventions that study participants would expect in DOTS provision as community is the closest source of information regarding the patients [ 31 , 32 ].
Similarly, all participants had pointed out the importance of support from a health system directly or indirectly influence their engagement in the prevention, diagnosis, treatment, and management of MDR-TB. Researches indicated that health system supports are enabling factors for healthcare providers in decision making regarding TB/MDR-TB prevention and treatment [ 33 ]. This problem is documented by the study done in Ethiopia [ 22 ]. In addition, support from colleagues and other stakeholders was also a felt need to engage in MDR-TB which was supported by the World Health Organization guideline which put engagement in preventing MDR-TB and providing patients centered care needs collaborative endeavor among healthcare providers, patients, and other stakeholders [ 17 ].
Participants showed that there were poor linkage among/within DOTS providers working in health post (extension workers), health centers, hospitals and MDRTB treatment initiation centers. Our finding is consistent with a research in South Africa which shows poor health care attitude is linked to poor treatment adherence [ 34 ]. Our study implies the need for further familiarization especially on clinical programmatic management of drug resistant tuberculosis. Moreover, program managers need to follow health professionals’ engagement approaches recommended by the World Health Organization: End TB strategy [ 17 ].
Limitations of the study
There are some limitations that must be explicitly acknowledged. First, participants from private health facilities were very few, which might have restricted the acquisition and incorporation of perspectives from health care providers from private health care facilities. Second, healthcare providers’ engagement was not measured from patient side given that factors for engagement may differ from what has been said by the healthcare provides. Third, power relationships especially among focus group discussant in MDR-TB treatment initiation centers might have influenced open disclosures of some sensitive issues.
The study showed how healthcare provider’s engagement in MDR-TB management and prevention was influenced. Accordingly, patient’s underlying causes, seeking support, perceived occupational exposure, healthcare provider’s incompetence and health facilities poor linkage were identified from the analysis. Weak community TB prevention efforts, poor health system support and support from colleagues, health care providers’ incompetence and health facilities poor linkage were among identified factors influencing engagement in MDR – TB prevention and management. Therefore, measures need to be in place that avert the observed obstacles to health professionals’ engagement including further quantitative studies to determine the effects of the identified reasons and potential factors in their engagement status.
Furthermore, our findings pointed out the need for additional training of service providers, particularly in clinical programmatic management of drug-resistant tuberculosis. Besides, program managers must adhere to the World Health Organization’s recommendations for health professional engagement. Higher officials in the health sector needs to strengthen the linkage between health facilities and service providers at different levels. Community awareness creation to avoid fear of discrimination including provision of support for those with MDR-TB is expected from health experts through implementation of social behavioral change communication activities.
Abbreviations
Directly observed treatment short-course
Drug susceptible tuberculosis
Millennium development goals
Multidrug resistant tuberculosis
Sustainable development goals
Tuberculosis
Treatment initiation center
World Health Organization
Extensively drug resistant TB
WHO. Companion handbook to the WHO guidelines for the programmatic management of drug-resistant tuberculosis. WHO; Geneva, Switherland. 2014.
WHO. Implementing the end TB Strategy: The Essentials. WHO, Geneva. Switherland; 2015.
Eshetie S, Gizaw M, Dagnew M, Kumera G, Woldie H, Fikadu A. et.al. Multidrug-resistant tuberculosis in Ethiopian settings and its association with previous history of anti-tuberculosis treatment: a systematic review and meta-analysis Ethiopia: efforts to expand diagnostic services, treatment and care. BMC Antimicrobial Resist Infect Control. 2014;3:31.
Biadglegne F, Sack U, Rodloff AC. Multidrug-resistant tuberculosis in Ethiopia: efforts to expand diagnostic services, treatment and care. BMC Antimicro Resist Infect Control. 2014;3:31.
Lema NA, Majigo M, Mbelele PM, Abade AMIM. Risk factors associated with multidrug resistant tuberculosis among patients referred to Kibong’oto Infectious Disease Hospital in northern Tanzania. Tanzania J Health Res. 2016;18:4.
Mekonnen F, Tessema B, Moges F, Gelaw A, Eshetie S. G. K. Multidrug resistant tuberculosis: prevalence and risk factors in districts of metema and west armachiho, Northwest Ethiopia. BMC Infect Dis. 2015;15:461.
Selamawit H, Girmay M, Belaineh G, Muluken M, Alemayehu M, et al. PS. Determinants of multidrug-resistant tuberculosis in patients who underwent first-line treatment in Addis Ababa: a case control study. BMC Public Health 2013. 2013;13:782.
Google Scholar
Safwat TM, Elmasry AA, Mohamed A. Prevalence of multi-drug resistant tuberculosis in abbassia Chest hospital from july 2006 to december 2009. Egyptian J Bronchol. 2011;5(2):124–30.
World Health Organization. WHO Global tuberculosis report 2015. Geneva: WHO. 2015.
Rifat M, Hall J, Oldmeadow C, Husain A, Hinderaker SG. AH. M. Factors related to previous tuberculosis treatment of patients with multidrug resistant tuberculosis in Bangladesh. BMJ Open. 2015;5.
Gupta KB, Gupta R, Atreja A, Verma MSV. Tuberculosis and nutrition. Lung India: Offic Organ of Indian Chest Soc. 2009;26(1):9–16. https://doi.org/10.4103/0970-2113.45198 . 2009.
World Health Organization. WHO Global tuberculosis report 2018. Geneva: WHO. 2018.
Deus L, Willy S, Kenneth M, George WK, Frank JCMJ. et al. Variation and risk factors of drug resistant tuberculosis in sub-Saharan Africa: a systematic review and meta-analysis. BMC Public Health 2015;15.
Federal Ministry of Health. Guidelines for Clinical and Programmatic Management of TB, TB/HIV and Leprosy in Ethiopia. Fifth Edition. Addis Ababa. March, 2013.
FDRE/MOH. Guidelines on programmatic management of drug resistant tuberculosis in Ethiopia. 2ND ED.2014 ADDIS ABABA. 2014.
CSIS. Center for Strategic and International Studies. As Ethiopia moves toward tuberculosis elimination, success requires higher investment: A report of CSIS global health policy center. CSIS, Washinton DC, America. 2016.
World Health organization. Framework for the engagement of all health care providers in the management of drug resistant tuberculosis. Geneva; Switherland. WHO 2015.
Vries G, Tsolova S, Anderson LF, Gebhard AC, Helda E, Hollo V. Health system factors influencing management of multidrug-resistant tuberculosis in four European Union countries - learning from country experiences. BMC Public Health. 2017;17:334.
Isara AR, Akpodiete A. Concerns about the knowledge and attitude of multidrug resistant tuberculosis among health care workers and patients in Delta State, Nigeria. Nigerian J Clin Pract. 2015;18:5.
Luka MI, Idris SH, Patrick N, Ndadilnasiya EW, Moses OA, Phillip P., et al. Health care workers’ knowledge and attitude towards TB patients under Direct Observation of Treatment in Plateau state Nigeria, 2011. Pan Afr Med J. 2014;18 (Supp1):8.
Malangu N, Adebanjo OD. Knowledge and practices about multidrug-resistant tuberculosis amongst healthcare workers in Maseru. Afr J Prm Health Care Fam Med. 2015;7:1.
Molla Y, Jerene D, Jema I, Nigussie G, Kebede T, Kassie Y. et.al. The experience of scaling up a decentralized, ambulatory model of care for management of multidrug-resistant tuberculosis in two regions of Ethiopia. J Clinic Tubercul Other Mycobacter Dis. 2017;7:28–33.
Merza MA, Farnia P, Tabarsi P, Khazampour M, Masjedi MR. AA. V. Anti-tuberculosis drug resistance and associated risk factors in a tertiary level TB centre in Iran: a retrospective analysis. J Infect Dev Ctries. 2011;5(7):511–19.
Gebremariam MK, Bjune GA. FJ. Barriers and facilitators of adherence to TB treatment in patients on concomitant TB and HIV treatment: a qualitative study. BMC Public Health. 2010;10:651.
Suri AGK. S. C. Voices from the Field: Perspectives from Community Health Workers on Health Care Delivery in Rural KwaZulu-Natal, South Africa. J Infect Dis. 2007;196:S505–11.
Deshmukh RD, Dhande DJ, Sachdeva KS, Sreenivas AN, Kumar AMV. M. P. Social support a key factor for adherence to multidrug-resistant tuberculosis treatment. Indian J Tubercul. 2017.
Samuel B, Volkmann T, Cornelius S, Mukhopadhay S, Mitra K, Kumar AM., et al. Relationship between Nutritional Support and Tuberculosis Treatment Outcomes in West Bengal, India. J Tuberc Res. 2016;4(4):213–19.
NC. E. The making of a public health problem: multi-drug resistant tuberculosis in India. Health Policy Plan 2013;28:375–85.
Gler MT, Podewils LJ, Munez N, Galipot M, Quelapio MID, Tupasi TE. Impact of patient and program factors on default during treatment of multidrug-resistant tuberculosis. Int J Tuberc Lung Dis. 2012;16(7):955–60. https://doi.org/10.5588/ijtld.11.0502 .
Article CAS Google Scholar
Horter S, Stringer B, Greig J, Amangeldiev A, Tillashaikhov MN, Parpieva N., et al. Where there is hope: a qualitative study examining patients’ adherence to multidrug resistant tuberculosis treatment in Karakalpakstan, Uzbekistan. BMC Infect Dis. 2016;16:362.
Naidoo P, Niekerk MV, Toit ED, Beyers N, Leon N. Pathways to multidrug-resistant tuberculosis diagnosis and treatment initiation: a qualitative comparison of patients’ experiences in the era of rapid molecular diagnostic tests. BMC Health Serv Res. 2015;15:488.
WHO. ENGAGE-TB. Training of community health workers and community volunteers. Integrating community-based tuberculosis activities into the work of nongovernmental and other civil society organizations. 2015.
Gerard de Vries S, Tsolova FL, Anderson AC, Gebhard E, Heldal et al. Health system factors influencing management of multidrug-resistant tuberculosis in four European Union countries - learning from country experiences BMC Public Health. 2017;17:334. https://doi.org/10.1186/s12889-017-4216-9 .
Finlay A, Lancaster JHT, Weyer K, Miranda A. M. W. Patient- and Provider level risk factors associated with default from tuberculosis treatment, South Africa: a case control study. BMC Publich Health. 2012;12:56.
Download references
Acknowledgements
We would like to acknowledge Hosanna College of Health Sciences Research and community service directorate for providing us the opportunity and necessary fund to conduct this research. Our appreciation also goes to heads of various health centers, hospitals, district health and Hadiya Zone Health office for unreserved cooperation throughout data collection.
The authors declare that this study received funding from Hosanna College of Health Sciences. The funder was not involved in the study design, collection, analysis, interpretation of data, the writing of this article or the decision to submit it for publication.
Author information
Bereket Aberham Lajore & Menen Ayele
Present address: Hossana College of Health Sciences, Hosanna, SNNPR, Ethiopia
Yitagesu Habtu Aweke
Present address: College of Health Sciences, School of Public Health, Addis Ababa University, Addis Ababa, Ethiopia
Samuel Yohannes Ayanto
Present address: College of Health Sciences, Institute of Public Health, Department of -Population and Family Health, Jimma University, Jimma, Ethiopia
Bereket Aberham Lajore, Yitagesu Habtu Aweke and Samuel Yohannes Ayanto contributed equally to this work.
Authors and Affiliations
Department of Family Health, Hossana College of health sciences, Hossana, Ethiopia
Bereket Aberham Lajore
Department of Health informatics, Hossana College of Health Sciences, Hossana, Ethiopia
Department of Midwifery, Hossana College of Health Sciences, Hossana, Ethiopia
Department of Clinical Nursing, Hossana College of Health Sciences, Hossana, Ethiopia
Menen Ayele
You can also search for this author in PubMed Google Scholar
Contributions
Bereket Aberham Lajore, Yitagesu Habtu Aweke, and Samuel Yohannes Ayanto conceived the idea and wrote the proposal, participated in data management, analyzed the data and drafted the paper and revised the analysis and subsequent draft of the paper. Menen Ayele revised and approved the proposal, revised the analysis and subsequent draft of the paper. Yitagesu Habtu and Bereket Aberham Lajore wrote the main manuscript text and prepared all tables. All authors reviewed and approved the final manuscript.
Corresponding author
Correspondence to Bereket Aberham Lajore .
Ethics declarations
All methods and report contents were performed in accordance with the standards for reporting qualitative research.
Ethics approval and consent to participate
Ethical approval was obtained from Institutional review board [IRB] of Hossana College of health sciences after reviewing the protocol for ethical issues and provided a formal letter of permission to concerned bodies in the health system. Accordingly, permission to conduct this study was granted by respective health facilities in Hadiya zone. Confidentiality of the information was assured and participants’ autonomy not to participate or to opt-out at any stage of the interview were addressed. Finally, informed consent was obtained from the study participants after detailed information.
Competing interests
The authors declare no competing interests.
Additional information
Publisher’s note.
Springer Nature remains neutral with regard to jurisdictional claims in published maps and institutional affiliations.
Electronic supplementary material
Below is the link to the electronic supplementary material.
Supplementary Material 1
Rights and permissions.
Open Access This article is licensed under a Creative Commons Attribution 4.0 International License, which permits use, sharing, adaptation, distribution and reproduction in any medium or format, as long as you give appropriate credit to the original author(s) and the source, provide a link to the Creative Commons licence, and indicate if changes were made. The images or other third party material in this article are included in the article’s Creative Commons licence, unless indicated otherwise in a credit line to the material. If material is not included in the article’s Creative Commons licence and your intended use is not permitted by statutory regulation or exceeds the permitted use, you will need to obtain permission directly from the copyright holder. To view a copy of this licence, visit http://creativecommons.org/licenses/by/4.0/ . The Creative Commons Public Domain Dedication waiver ( http://creativecommons.org/publicdomain/zero/1.0/ ) applies to the data made available in this article, unless otherwise stated in a credit line to the data.
Reprints and permissions
About this article
Cite this article.
Lajore, B.A., Aweke, Y.H., Ayanto, S.Y. et al. Exploring health care providers’ engagement in prevention and management of multidrug resistant Tuberculosis and its factors in Hadiya Zone health care facilities: qualitative study. BMC Health Serv Res 24 , 542 (2024). https://doi.org/10.1186/s12913-024-10911-6
Download citation
Received : 27 February 2023
Accepted : 27 March 2024
Published : 27 April 2024
DOI : https://doi.org/10.1186/s12913-024-10911-6
Share this article
Anyone you share the following link with will be able to read this content:
Sorry, a shareable link is not currently available for this article.
Provided by the Springer Nature SharedIt content-sharing initiative
- Healthcare providers
BMC Health Services Research
ISSN: 1472-6963
- General enquiries: [email protected]
This paper is in the following e-collection/theme issue:
Published on 29.4.2024 in Vol 26 (2024)
Exploring the Impact of In Basket Metrics on the Adoption of a New Electronic Health Record System Among Specialists in a Tertiary Hospital in Alberta: Descriptive Study
Authors of this article:
Original Paper
- Melita Avdagovska 1 , PhD ;
- Craig Kuziemsky 2 , PhD ;
- Helia Koosha 1 , MSc ;
- Maliheh Hadizadeh 1 , PhD ;
- Robert P Pauly 3 , MSc, MD ;
- Timothy Graham 4 , MSc, MD, CCFP, CHE ;
- Tania Stafinski 1 , PhD ;
- David Bigam 5 , MD ;
- Narmin Kassam 3 , MD ;
- Devidas Menon 1 , PhD
1 School of Public Health, University of Alberta, Edmonton, AB, Canada
2 Office of Research Services and School of Business, MacEwan University, Edmonton, AB, Canada
3 Medicine Department, Faculty of Medicine & Dentistry, University of Alberta, Edmonton, AB, Canada
4 Department of Emergency Medicine, Faculty of Medicine & Dentistry, University of Alberta, Edmonton, AB, Canada
5 Surgery Department, Faculty of Medicine & Dentistry, University of Alberta, Edmonton, AB, Canada
Corresponding Author:
Melita Avdagovska, PhD
School of Public Health
University of Alberta
11405 87 Avenue
Edmonton Clinic Health Academy
Edmonton, AB, T6G 1C9
Phone: 1 780 908 3334
Email: [email protected]
Background: Health care organizations implement electronic health record (EHR) systems with the expectation of improved patient care and enhanced provider performance. However, while these technologies hold the potential to create improved care and system efficiencies, they can also lead to unintended negative consequences, such as patient safety issues, communication problems, and provider burnout.
Objective: This study aims to document metrics related to the In Basket communication hub ( time in In Basket per day, time in In Basket per appointment, In Basket messages received per day, and turnaround time ) of the EHR system implemented by Alberta Health Services, the province-wide health delivery system called Connect Care (Epic Systems). The objective was to identify how a newly implemented EHR system was used, the timing of its use, and the duration of use specifically related to In Basket activities.
Methods: A descriptive study was conducted. Due to the diversity of specialties, the providers were grouped into medical and surgical based on previous similar studies. The participants were further subgrouped based on their self-reported clinical full-time equivalent (FTE ) measure. This resulted in 3 subgroups for analysis: medical FTE <0.5 , medical FTE >0.5 , and surgical (all of whom reported FTE >0.5 ). The analysis was limited to outpatient clinical interactions and explicitly excluded inpatient activities.
Results: A total of 72 participants from 19 different specialties enrolled in this study. The providers had, on average, 8.31 appointments per day during the reporting periods. The providers received, on average, 21.93 messages per day, and they spent 7.61 minutes on average in the time in In Basket per day metric and 1.84 minutes on average in the time in In Basket per appointment metric. The time for the providers to mark messages as done ( turnaround time ) was on average 11.45 days during the reporting period. Although the surgical group had, on average, approximately twice as many appointments per scheduled day, they spent considerably less connected time (based on almost all time metrics) than the medical group. However, the surgical group took much longer than the medical group to mark messages as done ( turnaround time).
Conclusions: We observed a range of patterns with no consistent direction. There does not seem to be evidence of a “learning curve,” which would have shown a consistent reduction in time spent on the system over time due to familiarity and experience. While this study does not show how the included metrics could be used as predictors of providers’ satisfaction or feelings of burnout, the use trends could be used to start discussions about future Canadian studies needed in this area.
Introduction
Electronic health record (EHR) systems have been implemented with many goals including streamlining information sharing among providers, empowering patients to be active partners in their care, supporting evidence-based individualized care, and monitoring population health. Health care organizations implement EHR systems with the expectation of improved patient care and enhanced provider performance [ 1 , 2 ].
EHR systems are not new in Canada [ 3 ]; however, their implementation has been faced with delays, changes in vendors, and reluctant adoption by users [ 4 ]. Canada continues to see activity in EHR implementation including in British Columbia [ 5 ], Saskatchewan [ 6 ], Ontario [ 7 ], Alberta (Connect Care; Epic Systems) [ 8 ], and Nova Scotia [ 9 ].
While EHR systems hold the potential to improve care delivery, they can also contribute to unintended negative consequences, such as patient safety issues, communication problems, and provider burnout [ 10 - 13 ]. Rather than implementing EHR systems and waiting to identify unintended consequences, we should proactively identify metrics to measure the impact of these EHR systems on the work of health care providers and enable ways to improve the diffusion and the subsequent adoption of EHR systems in Canada [ 9 - 12 ].
Advantages of the EHR System
EHRs are systems designed “to collect patient data in real time to enhance care by providing data at the provider’s fingertips and enabling decision-making where it needs to occur” [ 14 ]. These systems provide functions such as viewing (eg, laboratory or test results); documenting (eg, entering data and notes); ordering (eg, referrals, prescriptions, and tests); web-based messaging (eg, notifying patients of test results); care management (eg, disease-specific tools and allergy alerts); analysis and reporting; and patient-directed engagement capabilities (eg, access to own laboratory values and web-based messaging care providers) [ 15 - 20 ]. EHRs can provide benefits such as easy access to accurate and timely point-of-care data, easy navigation to enhance workflow, automation of mundane tasks, evidence-based management pathways to individualize care, convenient sharing of data across organizations, and population health monitoring [ 13 , 19 , 21 ]. Furthermore, when fully implemented, in some instances, EHRs have resulted in the comprehensive replacement of traditional paper charts [ 13 ].
Burden of EHR System
Although EHR systems are designed to deliver positive outcomes, unintended and technology-specific negative outcomes have also been described related to the workflow, patient-provider interactions (technology seen as impersonal), and the challenges of implementing these technologies within current health care systems [ 10 ]. There is increasing awareness that physician well-being has an important impact on the health system, and concerns exist over increasing rates of burnout [ 11 ], job dissatisfaction, intention to leave practice, and job turnover [ 22 ]. Among the consistently reported drivers of burnout and job dissatisfaction are adverse clinician interactions with EHRs. While EHRs are intended to streamline workflows, they are cited as increasing the inefficiency of clinical work, adding to user frustration [ 23 ].
Studies suggest that in clinical environments that include an integrated EHR system, physicians spend an additional 1.5 hours [ 16 ] of time using the EHR system for every 1 hour of direct patient interaction, with an additional 6 to 30 hours [ 17 , 24 ] per month of cumulative time spent on EHR documentation and inbox management outside routine working hours [ 25 ]. Furthermore, studies have demonstrated a negative impact on providers’ time due to managing test results and communications within In Basket, the EHR system’s communication hub [ 24 , 26 ] for administrative, clerical, and documentation functions and after-hour activities related to accomplishing required tasks [ 23 ]. In Basket is where health care providers receive and manage various tasks; web-based messages; and notifications such as appointment requests, medication refill requests, laboratory or imaging results, consultation requests, and web-based messages from other health care team members [ 27 ]. Many of these tasks, previously performed by administrative staff, have been increasingly offloaded to providers.
In a primary care setting, a health care provider may receive anywhere from a few to several dozen In Basket messages per day [ 28 ]. In specialized settings, such as a hospital or specialized clinic, the volume of In Basket messages can be higher, especially for providers who are involved in complex cases or have a larger patient population [ 29 , 30 ]. Specialists may receive additional types of web-based messages, such as interdepartmental consult requests or referrals from primary care providers. Due to these challenges, the time spent in In Basket activities can vary depending on factors such as the volume of web-based messages, complexity of tasks, and individual work practices [ 26 ]. The number of In Basket messages received per day can vary significantly depending on several factors, such as the size of the health care organization, the specialty or department, and the individual provider’s practice [ 31 ]. Managing In Basket time requires a balance between efficiency, prioritization, and effective communication to ensure timely and appropriate handling of tasks while delivering quality patient care [ 26 ]. Health care organizations have attempted to manage these challenges with one-on-one provider training, optimization and upgrade of processes, increased availability of technical support, added or expanded use of scribes, voice recognition, and improved EHR governance [ 32 , 33 ].
While physician burnout and distress, more broadly, are prevalent issues in Canada [ 34 ], to our knowledge, research on EHR use and physician well-being in a Canadian context has been limited, so the relationship of EHRs to surrogate outcomes of well-being (eg, burnout) in the Canadian context is unknown. This knowledge gap is significant, given the substantial disparities between the Canadian and American health care systems, particularly concerning documentation requirements for billing, insurance, and medicolegal purposes, which EHR systems are designed to streamline [ 32 ]. Notably, while EHR system implementation is underway in Canadian hospitals, most US hospitals have already adopted these EHR systems [ 35 , 36 ].
Canada operates under a federated system where health governance is federal, but health care delivery and associated tasks such as EHR implementation are managed provincially. Moreover, unlike in the United States, where much of the charting is focused on billing, the Canadian health care landscape differs substantially, as billing is not part of the need for implementing EHR systems [ 35 , 36 ]. These contextual distinctions between the 2 health care systems mean that research findings from one setting cannot simply be extrapolated to the other [ 13 , 21 , 23 , 24 , 26 , 37 ].
The extent to which EHRs contribute to physician dissatisfaction in Canada, akin to their presumed impact in the United States, remains uncertain. This study lays the groundwork for addressing this gap in knowledge by studying the use metrics of an EHR system implementation in Alberta. This study provides essential insights that not only pave the way for future investigations into the correlation between clinician well-being and EHRs in Canadian contexts but also inform interventional studies aimed at enhancing the user experience. In addition, our findings contribute to the development of best practices for EHR system implementation and use.
This study documented In Basket metrics of an EHR system implemented by Alberta Health Services (AHS), the province-wide health delivery system in Alberta branded as Connect Care. Understanding and documenting granular use metrics of Connect Care in Alberta is foundational for future studies examining the relationship between clinician wellness and EHRs in a Canadian setting, for example, understanding how the EHR-clinician interface contributes to adverse unintended consequences such as burnout. Through gaining an in-depth understanding of how the EHR system in Alberta captures In Basket metrics, this study was designed as a precursor to forthcoming studies examining the association between provider wellness and EHR systems in Canadian settings and to studies focused on improving the EHR system’s user experiences and developing best practices for the EHR system rollout and subsequent use.
Study Design
This was a descriptive study of a volunteer cohort of multidisciplinary specialists working at the University of Alberta Hospital (UAH) [ 38 ]. As the goal of the study was to measure the trends in In Basket use in the EHR system from the launch of Connect Care by specialists at the UAH over 33 months of use, this study design allowed us to commence the identification of how the EHR was used, when it was used, and for how long it was used related to the In Basket activities. To the best of our knowledge, this study is the first to explore the In Basket use of Connect Care by specialists in Alberta.
Explored In Basket Domain Measures (Metrics)
In Basket metrics refer to performance indicators that assess the efficiency and effectiveness of managing tasks, web-based messages, or alerts within the EHR system. These metrics assess various aspects of workflow management and communication within the EHR environment. In this study, we used the following In Basket metrics to capture the use of the In Basket toolbar by study participants: time spent in the In Basket per day , time spent in the In Basket per appointment , number of In Basket messages received per day , and turnaround Time . The time in In Basket per day metric is defined as the average number of minutes a provider spends in In Basket per day. The time in In Basket per appointment metric is the average number of minutes a provider spends in In Basket per scheduled appointment. The In Basket messages received per day metric is the average number of In Basket messages a provider receives per day. The turnaround time metric is the average number of days a provider takes to mark a message of a specific type as done. Furthermore, In Basket metrics included appointments per day, which is the average number of appointments per day within the reporting period for comparison purposes (workload vs use) between the participating specialists.
Ethics Approval
Ethics approval was received from the University of Alberta Health Research Ethics Board (study ID Pro00119194), and operational approval was received from AHS (OA60778, OA60779, and OA60780).
Connect Care is a comprehensive EHR system that allows users to access, generate, and manage documents, laboratory results, text reports, radiology images, notes, prescriptions, referrals, and web-based messages. Furthermore, Connect Care contains advanced auditing capabilities that record the actions of users when accessing the EHR system.
Study Setting
AHS is Canada’s largest integrated provincial health system and is responsible for delivering health services to >4.3 million people. Health care programs and services are offered at >900 facilities throughout the province (eg, hospitals, clinics, continuing care facilities, cancer centers, mental health facilities, and community health sites) [ 39 ]. The UAH is a quaternary care research and teaching hospital in Edmonton, Alberta. This hospital provides a wide range of inpatient and outpatient diagnostic and treatment services [ 40 ]. Study sites within the UAH were selected based on the length of time that they had been using the EHR system. The departments of medicine and surgery at the UAH were part of the first wave of the AHS Connect Care implementation. The specialists in these departments were considered to have used Connect Care for a time period that would provide sufficient use data required for this study.
Study Sample Recruitment
We decided on the following inclusion criteria for potential study participants: (1) any specialist located at the UAH and (2) ≥7 months of Connect Care use.
We used a purposive sampling method to recruit specialists. The clinical coinvestigators (RPP, DB, and NK) introduced and explained the project at departmental meetings. RPP developed a PowerPoint (Microsoft Corp) presentation, which was adapted by DB and NK to fit the context of their respective departments. During these presentations, the coinvestigators started by describing the potential impact of EHRs on provider well-being, the lack of Canadian use data, the need to understand the user experience, and the opportunity for EHR improvement driven by users. Furthermore, potential participants were informed that their individual results from the study would be shared with them. The clinical leads emailed all attending specialists asking them to complete the consent form (using REDCap [Research Electronic Data Capture]; Vanderbilt University) and provide the required information (eg, department, EHR login ID, clinical workload defined by the self-reported fraction of a full-time equivalent [FTE] measure, and work position) for data access.
Data Source
The raw In Basket data source was from Signal (an analytical platform developed by Epic Systems Corporation) using EHR user action log data (Epic Systems Corporation, unpublished data, April 2023). The user action log measures the time that the user interacted with the EHR system. The metrics captured in Signal are defined, and quantifiable measurements are used in reports to summarize information about processes or outcomes (Epic Systems Corporation, unpublished data, September 2020). Information about time spent in particular ambulatory (outpatient) In Basket activities (user action logs) was obtained for each participant from their first login to the EHR system. The analysis was limited to outpatient clinical interactions and explicitly excluded inpatient activities.
Once a specialist agreed to participate in the study, their name, login ID, and study ID were stored in a zipped and encrypted file and sent to the AHS Connect Care and Epic data team through REDCap to retrieve the required event logs data. REDCap is a secure web-based platform hosted by the Women and Children’s Health Research Institute in collaboration with the Northern Alberta Clinical Trials and Research Centre at the University of Alberta. Once the Epic data team reviewed the requested information, data were pulled and transferred to the AHS Connect Care team. The anonymized data were zipped and encrypted before being transferred to the principal investigator for analysis.
Data Description
Participants.
A total of 72 participants from 19 different specialties enrolled in this study. Of the 72 providers, 1 (1%) provider was excluded due to an absence of In Basket outpatient ambulatory Signal data. Due to the diversity of specialties, the providers were grouped into a medical group and a surgical group based on previous similar studies and the fact that these categories have similar EHR workflows [ 41 , 42 ].
The participants were further subgrouped based on their self-reported clinical FTE measure. Clinical FTE is a measure used in health care to quantify the work hours of health care providers or clinical staff in relation to a full-time position. This resulted in 3 subgroups for analysis: medical FTE <0.5 , medical FTE >0.5 , and surgical (all of whom reported FTE >0.5) groups.
In this study, providers in each group are independent of each other (ie, each provider contributes to the weighted means of only 1 group). However, for each In Basket metric, various subsets of providers in the group (ie, medical FTE <0.5, medical FTE >0.5, or surgical group) contribute to the weighted mean of various reporting periods.
Missing Values
Once the EHR data for each of the 72 providers was received, we identified missing values. As this study is one of the first to explore the provider’s use of Connect Care in the Alberta context, we wanted to gain an in-depth understanding of the missing In Basket outpatient ambulatory provider-related Signal data.
On the basis of discussions with the Epic team, the study team identified 3 reasons for missing values in the data. The first reason was that a participant must be “registered” with Connect Care (AHS), be active, and must have logged in to the EHR system and seen at least 1 patient in the reporting period [ 38 ]. Second, for the time in In Basket per appointment metric, there was an additional inclusion criterion where the provider needed at least 5 appointments scheduled per week within the reporting period for Signal to capture user interactions in the EHR system [ 2 ]. We identified this as an issue as many part-time specialists might have ≤4 appointments per week; for example, if they were on ward duties, they would be managing only inpatients during that time. Although they interacted with the EHR system, no data would be recorded for these metrics. Since inpatient data were not studied, the true impact of EHR system use might be underestimated. The third reason for missing data is that the EHR system did not capture any data for certain metrics for all participating providers during certain months such as the In Basket messages received per day (missing data for all providers during April 2021, May 2021, July 2021, August 2021, and September 2021) and time in In Basket per appointment (April 2021) metrics. Neither we nor the analysts from Epic Systems could determine the root cause of the missing data.
On the basis of these findings, we used a complete case analysis to address missing values [ 29 ]. The observations with denominator=0 were excluded. The weighted averages did not capture the missing values data. As each In Basket metric was considered individually, a provider had to have at least 1 month of data for a particular In Basket metric to be included in the metric analysis.
Data Ranges
The start date was November 1, 2019 (the date of launch of Connect Care), and the end date was July 30, 2022, for the In Basket metrics.
Depending on the available data for the metrics, the monthly reporting periods included in the analysis ranged between 14 and 33 months. The overall amount of data varied between 1528 (15.92%) observations for the time in In Basket per appointment metric and 2203 (22.95%) observations for the time in In Basket per day metric. The total number of observations for all included metrics was 9598.
Statistical Analysis
Data aggregation, analysis, and visualization were performed using SAS (version 9.4; SAS Institute) and Tableau (version 2021.4.3; Tableau Software, LLC) [ 43 , 44 ]. The numerator and denominator from each metric were used to calculate the weighted daily means of all participants and each group.
A 2-sample t test (2-tailed) was used to compare the weighted daily mean of every metric for the medical FTE >0.5 group with the medical FTE ≤0.5 group and compare those of the medical FTE >0.5 group with the surgical FTE >0.5 group. A weighted average calculates the mean of a data set while considering the varying importance or significance of each number within the set. This approach is commonly used in statistical analysis. It is a critical tool for addressing fluctuations, managing uneven or distorted data, and ensuring fair representation of similar data points based on their respective weights.
In time-series analysis, such as the one we have conducted, time-weighted averages were used because the time series was not evenly sampled. Ideally, data points in a time series are evenly spaced, such as hourly, daily, or monthly intervals, where each point carries equal weight. However, in our data set, reporting periods were irregular, with varying lengths ranging from 27 to 35 days. Consequently, these reporting periods had different weights. To address this, we converted the reporting periods to a daily scale, ensuring each data point carried equal weight. In summary, a time-weighted average assigns weight to each value based on its duration relative to surrounding points, leading to significantly improved accuracy in the final calculation.
Trend analysis was used to evaluate the use trends over time to determine changes in Connect Care use by the participating providers. A simple moving average (SMA) curve was used to explore the learning curves (changes over time) for each metric [ 45 , 46 ]. A linear trend line was fitted to the SMA curve for each group (ie, medical FTE <0.5, medical FTE >0.5, and surgical groups) based on each included metric to determine the changes in trends (ie, whether the slope increased, decreased, or remained unchanged).
In all these analyses, a P value of <.05 was considered statistically significant.
Participant Characteristics
In total, 71 providers were included in the analysis. Of the 71 providers, 29 (40%) were women providers and 43 (60%) were men providers. The analysis did not compare results by age or gender because the numbers were small. The largest specialty group was internal medicine (n=14, 20%), followed by nephrology (n=10, 14%) and general surgery (n=9, 13%). The least represented specialties were dermatology, intensive care, neurosurgery, and cardiac surgery, at about 1% (n=1) each. Due to the diversity of specialties, the providers were grouped into a medical group (n=53, 75%) and a surgical group (n=18, 25%) based on previous similar studies ( Multimedia Appendix 1 ) [ 41 , 42 ].
Furthermore, the self-reported FTE was used to further subgroup participants. Of the 53 participants in the medical group, 27 (51%) participants reported FTE <0.5 and 26 (49%) participants reported FTE >0.5. All 18 (100%) surgical specialists reported FTE >0.5. This resulted in 3 subgroups: medical FTE <0.5, medical FTE >0.5, and surgical (all FTE >0.5) groups.
Overall Results
Table 1 shows the weighted daily means for all participating providers (including weighted daily means for the medical and surgery groups) for each metric in this study. The use of weighted daily means indicates a more precise method for determining the average appointments per day compared to a simple average based solely on the number of providers and reporting periods. In this study, because the reporting periods varied in duration, they were assigned different weights based on the number of days within each period. This adjustment ensured a more accurate representation of daily appointment averages.
On the basis of the weighted daily means adjustment, each provider had, on average, 8.31 appointments per day during the entire reporting period. The providers received, on average, 21.93 web-based messages per day and spent 7.61 minutes on average in the time in In Basket per day metric and 1.84 minutes on average in the time in In Basket per appointment metric. The time for the providers to mark messages as “done” (meaning that they had completed tasks associated with them; Turnaround Time) was, on average, 11.45 days during the reporting period. Although the surgical group had, on average, approximately twice as many appointments per scheduled day, they spent considerably less “connected time” (based on almost all time metrics) than the medical group. However, the surgical group took much longer than the medical group to mark messages as done (Turnaround Time; Table 1 ).
Table 2 shows the weighted daily means per provider group (ie, medical FTE <0.5, medical FTE >0.5, and surgical groups) for each metric in this study. According to the raw data, the medical FTE <0.5 and the surgical groups had, on average, more appointments per day during the reporting period than the medical FTE >0.5 group. In addition, all the time metrics indicate that the medical FTE <0.5 group had less time on Connect Care than the medical group FTE >0.5. The same was observed between the medical FTE >0.5 and the surgical groups, except for the turnaround time metric ( Table 2 ).
a Surgical group versus medical FTE >0.5 group comparison: P value=.07.
Trend Analysis
Table 3 presents the results of the trend analysis. All 3 groups had a statistically significant increase in the appointments per day and turnaround time metrics over the study period.
As presented in Table 3 , for the medical FTE ≤0.5 group, the appointments per day , In Basket messages received per day , time in In Basket per appointment , and turnaround time metrics showed statistically significant changing slopes (increasing trends over time), while the time in In Basket per day metric remained unchanged. The largest slope for this group was observed for the turnaround time metric with a value of 0.0055.
For the medical FTE >0.5 group, all metrics showed statistically significant changes ( Table 3 ). This group showed the largest number of statistically significant trend changes among the 3 studied groups. A total of 3 metrics (ie, appointments per day , In Basket messages received per day , and time in In Basket per day ) that showed statistically significant changes had increasing trends, while the time in In Basket per appointment metric showed statistically significant changes with a negative slope (decreasing trend).
a Increasing: positive slope and P value is statistically significant.
b Unchanged: P value is not statistically significant.
c Decreasing: negative slope and P value is statistically significant.
For the surgical group, the appointments per day and turnaround time metrics showed a statistically significant increasing trend, while the time in In Basket per day and time in In Basket per appointment metrics showed a statistically significant decreasing trend.
Although there were increasing and decreasing patterns among the included metrics, there were no obvious patterns across metrics and among groups. Therefore, there does not seem to be evidence of a “learning curve,” which would have shown a consistent reduction in time spent in the EHR system over time due to familiarity and experience.
Findings by Metric
The following sections describe the findings for each metric.
Appointments Per Day
During the reporting period, the weighted daily average number of appointments per day was 8.31 (95% CI 8.27-8.35) for all providers. For the medical group, the daily weighted average was 6.41 (95% CI 6.39-6.44), while for the surgical group, this number was 14.01 (95% CI 13.93-14.10) appointments per day. The weighted daily mean for the medical FTE ≤0.5 group (mean 6.47, 95% CI 6.44-6.49), compared to the mean for the medical FTE >0.5 group (mean 6.36, 95% CI 6.33-6.39), was significantly different ( Multimedia Appendix 2 ).
Although the slope changes were subtle, the SMA trends for the appointments per day metric for all 3 groups were statistically increasing over time ( Multimedia Appendix 2 ).
In Basket Messages Received Per Day
The weighted daily mean of web-based messages received was 21.93 (95% CI 21.64-22.22) messages for all 71 providers. The weighted daily mean for the medical FTE >0.5 group was significantly larger than that for the medical FTE ≤0.5 group. Furthermore, the difference between the weighted daily mean values of the medical FTE >0.5 group (mean 23.29, 95% CI 22.70-23.57) and the surgical group (mean 21.70, 95% CI 21.45, 21.94; P <.001) was statistically significant ( Multimedia Appendix 2 ).
In June 2021, Signal data recorded that 1 particular specialist received an unusually large number of In Basket messages. After an examination, it was determined that this was due to the EHR system sending a batch of all laboratory results from many patients to this particular medical specialist, who was probably on call. The spike from this individual’s data is reflected in the 2 graphs related to the medical group (FTE >0.5) and the graph for all providers ( Multimedia Appendix 2 ). While this particular case may be seen as an outlier, it serves as an illustration of what can potentially happen within an EHR system. Instances like this one may not be uncommon.
According to the SMA trend analysis, both medical groups experienced statistically significant increasing trends in this metric, while the surgery group’s trend remained statistically unchanged. The trend change was much more pronounced for the medical FTE >0.5 group (slope=0.0194) than that of the medical FTE ≤0.5 group (slope=0.0047). Notably, for the medical FTE >0.5 group, this metric had the largest slope and was the fastest changing over time ( Multimedia Appendix 2 ). This might have been because of the “anomaly” of a single physician in the medical FTE >0.5 group receiving a very large number of emails, as described in the previous paragraph. Furthermore, these results show the situations that are possible within the EHR system and need to be recognized.
Time in In Basket Per Day
The weighted daily mean for all providers was 7.61 (95% CI 7.59-7.64) minutes in In Basket per day. The weighted daily mean for the medical group was 8.86 (95% CI 8.84-8.89) minutes in In Basket per day, while that for the surgical group was 3.95 (95% CI 3.92-3.97) minutes per day. The medical FTE ≤0.5 group’s weighted daily mean was 7.98 (95% CI 7.95-8.02) minutes in In Basket per day, and the weighted daily mean for the medical FTE >0.5 group ( P <.001) was 9.73 (95% CI 9.68-9.77) minutes per day. The surgical group spent less time in In Basket per day than the medical FTE >0.5 group (mean 3.95, 95% CI 3.92-3.97, vs mean 9.73, 95% CI 9.68-9.77; P <.001; Multimedia Appendix 2 ).
On the basis of the trend analysis, the medical FTE >0.5 group showed a statistically significant increasing trend for this metric, while the surgery group showed a statistically significant decreasing trend and the medical FTE ≤0.5 group’s trend stayed statistically unchanged. While the result of trend analysis for this metric is different for each group, it is important to note that the slopes for each group were very small and clinically insignificant ( Multimedia Appendix 2 ).
Time in In Basket Per Appointment
After analyzing 1528 observations related to the time that providers spent in the In Basket per appointment, the total average time for both surgical and medical groups was 1.84 (95% CI 1.83-1.85) minutes. The surgical groups spent 0.60 (95% CI 0.59-0.61) minutes, while the medical group spent 2.78 (95% CI 2.77-2.79) minutes. The weighted daily mean for the medical FTE ≤0.5 group was significantly different compared to the mean for the medical FTE >0.5 group (mean 2.69, 95% CI 2.68-2.71, vs mean 2.88, 95% CI 2.86-2.90; P <.001). Furthermore, a significant difference was observed when comparing the medical FTE >0.5 group (mean 2.88, 95% CI 2.86-2.90) and the surgical group (mean 0.60, 95% CI 0.59, 0.61; P <.001; Multimedia Appendix 2 ).
For the time in In Basket per appointment metric, the medical FTE ≤0.5 group was the only group that saw a statistical increase in their use over time. The other 2 groups showed a statistical decrease in their use over time for this metric ( Multimedia Appendix 2 ).
Turnaround Time
Turnaround time is a metric group under the In Basket category within Signal. It reports the average number of days a provider takes to mark a message of a specific type as “done.” According to the data, the surgical group spent 16.22 (95% CI 14.69-17.76) days on average to mark messages as done. The medical group spent, on average, 9.72 (95% CI 9.21-10.23) days to mark messages as done ( Multimedia Appendix 2 ). For this metric, a significant difference was observed when comparing the 2 medical groups and between the medical FTE >0.5 and the surgical group. The study team was unable to identify the reasons for the delays.
For this metric, spikes in recorded data were observed ( Multimedia Appendix 2 ) for 2 study participants (1 medical and 1 surgical specialist) over several months, indicating extremely long delays in marking received messages as “done.” An explanation for these anomalies in data capture within the turnaround time metric remains elusive. Once more, we encounter an outlier; nonetheless, it serves as an example of potential EHR system use scenarios.
On the basis of the SMA trend analysis, all 3 groups experienced statistically increasing trends over time for their turnaround time metric ( Multimedia Appendix 2 ). The largest slope (0.0175) belonged to the surgical group and the smallest slope (0.0055) belonged to the medical FTE ≤0.5 group for this metric.
Principal Findings
Implementing Connect Care by AHS has transformed how providers capture and share information by establishing changes to workflows, processes, and charting approaches [ 47 ]. While the overall objective is to establish uniformity in the EHR system’s use, this study has revealed disparities in the timing of task completion within the EHR system. Furthermore, in certain cases, outliers have emerged whose use patterns are not easily explained with the existing data. This study revealed significant gaps in our understanding of EHRs and In Basket management, highlighting the need for further exploration and comprehension in these areas.
Khairat et al [ 48 ] evaluated the time spent by general and specialist pediatricians performing clinical documentation and In Basket tasks outside work hours. Specialists spent more time in the EHR system, and “this may be because specialists see more complex patients and, therefore, need more time to review the patient chart and to respond to In Basket messages” [ 48 ]. Although in our study, we cannot say what percentage of workload the providers spent on In Basket activities, we identified that they spent 7.61 minutes in the time in In Basket per day metric and 1.84 minutes in the time in In Basket per appointment metric . According to the raw data, the medical FTE <0.5 group and the surgical group had, on average, more appointments per day during the reporting period than the medical FTE >0.5 group. It would be valuable to explore the main workflow drivers of In Basket time and try to optimize efficiency in this area for all specialties.
The proportion of time spent in the EHR system based on the included metrics between the providers within the medical groups (FTE ≤0.5 and FTE >0.5) was similar; however, little can be concluded about the similarities or differences in use due to the high variability within the specialties. Although data analysis showed statistical significance for all metrics, it is apparent that FTE made no difference to the workload between providers working (FTE ≤0.5 or FTE >0.5). Before comparing part-time medical providers with full-time ones, we could not definitively attribute the observed differences between the medical and surgical groups to the fact that some medical providers worked part time or to the fact that all surgical providers worked full time. Our study did not reveal important differences in In Basket metrics among medical specialists regardless of the clinical FTE . Significant differences were observed between medical and surgical colleagues. Presumably, these differences relate to broad differences in medical versus surgical consultation and their associated workflows.
When comparing the 3 groups, the medical FTE >0.5 group was more “connected” than the medical FTE <0.5 group and the surgical group when considering the time in In Basket per day and time in In Basket per appointment metrics. Although the surgical group treated more patients (on average, 14.01 appointments during the reporting period), they spent less time in In Basket per day and per appointment, so they were “less connected” than the 2 medical groups. Nonetheless, while the data do not provide a direct explanation for these differences, they do provide insight into the structuring of workloads. This insight is crucial for comprehending how various professionals use the EHR system and identifying areas where workflow enhancements could prove beneficial.
We identified several providers’ data that were outliers in terms of their EHR use. For example, 2 providers took inordinately long times to mark received web-based messages as done ( turnaround time ), which impacted the data on between-group differences. Furthermore, there was a medical provider who received an extremely high number of web-based messages in June 2021. Such outliers demonstrate that certain scenarios can significantly influence the averages of various metrics, leading to skewed results. It underscores the possibility that data generated by the EHR system may not always be accurate, emphasizing the need for discussions and considerations with EHR system vendors regarding EHR functionality and measures to reduce outlier occurrences. Future research with a more robust statistical approach should be conducted to delve deeper into addressing and mitigating anomalies in the data.
One factor that we identified in our study is that Connect Care did not capture all interactions due to various vendor-imposed rules (eg, 5 appointments per reporting period). Similarly, Cohen et al [ 49 ] identified issues with vendor-derived metrics and how different vendors calculated the same activities in different ways and identified that not all EHRs (vendors) drew information from audit log data, which led to the inability to provide the whole picture of provider’s interaction with the EHR system [ 49 ]. Therefore, using only vendor-derived metrics may miss important aspects of the true impact of the EHR system on users. In the study by Cohen et al [ 49 ], 1 participant stated that “if different EHR (vendors) are attacking the issue differently, you will get variations not related to burden but just how the math is done.” Documentation time for In Basket use must be captured completely with the intent to understand how In Basket contributes to the overall workload of providers. If EHR systems are being associated with burnout, In Basket messages could be a starting point for common ground around the discussion of how web-based messages should be delivered and managed [ 50 ].
Future Directions
On the basis of the results from this study, we identified several future studies that can build upon this study. This study was descriptive and did not explore the correlation between the included metrics and provider satisfaction and burnout due to EHR system use. The next step would be to conduct a study exploring the circumstances around the individual EHR data. It would be valuable to explore the main workflow drivers of In Basket use time and try to optimize efficiency in this area for all specialties. A qualitative study should be conducted to explore the variances between actual and perceived EHR system use. While data from this study do not provide a direct explanation for these differences, they do provide insight into the structuring of workloads.
Furthermore, future studies should focus on the difference between providers with part-time and full-time clinical schedules and how that translates into EHR use. This insight is key for understanding how various professions use the EHR system in order to identify areas where workflow enhancements could prove beneficial. Moreover, future research should explore EHR use between different specialties and whether these specialties impact EHR use habits. In addition, studies should explore the association between other metrics and quality outcomes. Finally, future studies need to work on developing strategies for EHR data quality appraisal. In our study, we identified that the data generated by the EHR system may not always be accurate, emphasizing the need for discussions and considerations with EHR vendors regarding EHR functionality. In future studies with a more robust statistical approach, there may be an opportunity to delve deeper into addressing and mitigating anomalies in the data.
Limitations
This study has several limitations. The analyzed data were only the participating providers’ ambulatory (outpatient) data. Inpatient data were not included, which might have provided additional information on some of the metrics (inpatient data were unavailable for all included metrics in this study). Another limitation is the underestimation of some metrics based on how Epic defines and captures activity (eg, a provider needs at least 5 appointments scheduled per week within the reporting period and inbox activities related to phone calls or chart review). Furthermore, to address some In Basket issues, a person may need to access other parts of the EHR system to gather more information or complete some other task (eg, write a prescription) and only then go back into the In Basket to sign off on it. Therefore, the actual time in the In Basket is a systematic underestimation of the actual time it took to complete a task.
Due to the high variability of specialties (19 in total) and the low number of recruited providers for each specialty (ranging between 1 and 14 providers), we were unable to explore and compare the differences in EHR use between the specialties. The small number of participants might have created a bias regarding the reasons for participation. Another study limitation was that the FTE was self-reported, which might have led to providers over- or underestimating their clinical schedules. The final limitation is that we did not evaluate the types of web-based messages that the providers received in the In Basket. As this is one of the first studies evaluating Connect Care, we deemed that the focus should be on the overall metrics rather than the submetrics or categories.
Conclusions
This study demonstrated the enormous promise of the ability to harvest data from an EHR that describes system use and the potential impact that it has on the workflow of physicians. To take complete advantage of this, there must be an appropriate understanding of how EHR systems capture and measure the use by providers. This would be foundational to forthcoming studies examining the association between provider wellness and EHR systems in Canadian settings and studies focused on improving the EHR system’s user experiences, developing best practices for EHR systems rollout and subsequent use, and understanding how the interface of the user and the EHR systems interrelate. Although this study does not show how the included metrics could be used as predictors of providers’ satisfaction or feeling of burnout, the use trends could be used to start discussions about future Canadian studies needed in this area.
Acknowledgments
The authors would like to acknowledge and thank the providers who participated in this study. Without their help, this research would not have been possible. The authors would also like to thank the staff from Alberta Health Services and Epic Corporation for their willingness to provide the required data. Furthermore, the authors would like to thank the Canadian Institutes of Health Research (grant 180993) for providing funding for this work. Without this funding support, this study would have not been possible.
Conflicts of Interest
None declared.
Grouping of included providers according to specialties.
Findings by metric.
- Donnelly C, Janssen A, Vinod S, Stone E, Harnett P, Shaw T. A systematic review of electronic medical record driven quality measurement and feedback systems. Int J Environ Res Public Health. Dec 23, 2022;20(1):200. [ FREE Full text ] [ CrossRef ] [ Medline ]
- Negro-Calduch E, Azzopardi-Muscat N, Krishnamurthy RS, Novillo-Ortiz D. Technological progress in electronic health record system optimization: systematic review of systematic literature reviews. Int J Med Inform. Aug 2021;152:104507. [ FREE Full text ] [ CrossRef ] [ Medline ]
- Boothe C, Bhullar J, Chahal N, Chai A, Hayre K, Park M, et al. The history of technology in nursing: the implementation of electronic health records in Canadian healthcare settings. Can J Nurs Inform. Sep 23, 2023;18(3). [ FREE Full text ]
- Chang F, Gupta N. Progress in electronic medical record adoption in Canada. Can Fam Physician. Dec 2015;61(12):1076-1084. [ FREE Full text ] [ Medline ]
- Electronic medical and health records. HealthLink BC. URL: https://tinyurl.com/mrxyuky6 [accessed 2021-03-27]
- MySaskHealthRecord. eHealth Saskatchewan. URL: https://www.ehealthsask.ca/MySaskHealthRecord/MySaskHealthRecord [accessed 2021-03-27]
- What’s an EHR? eHealth Ontario. URL: https://ehealthontario.on.ca/en/patients-and-families/ehrs-explained [accessed 2021-10-08]
- Connect care. Alberta Health Services. URL: https://www.albertahealthservices.ca/cis/cis.aspx [accessed 2021-10-08]
- Primary health information management and electronic medical records. Government of Nova Scotia. URL: https://novascotia.ca/dhw/primaryhealthcare/PHIM-EMR.asp [accessed 2021-10-08]
- Buntin MB, Burke MF, Hoaglin MC, Blumenthal D. The benefits of health information technology: a review of the recent literature shows predominantly positive results. Health Aff (Millwood). Mar 2011;30(3):464-471. [ FREE Full text ] [ CrossRef ] [ Medline ]
- Rotenstein LS, Torre M, Ramos MA, Rosales RC, Guille C, Sen S, et al. Prevalence of burnout among physicians: a systematic review. JAMA. Sep 18, 2018;320(11):1131-1150. [ FREE Full text ] [ CrossRef ] [ Medline ]
- Physician burnout. Agency for Healthcare Research and Quality. URL: https://www.ahrq.gov/prevention/clinician/ahrq-works/burnout/index.html [accessed 2022-01-13]
- National Academies of Sciences, Engineering, and Medicine, Committee on Systems Approaches to Improve Patient Care by Supporting Clinician Well-Being, National Academy of Medicine. Taking Action Against Clinician Burnout: A Systems Approach to Professional Well-being. Washington, DC. National Academies Press; 2019.
- McGonigle D, Mastrian K. Nursing Informatics and the Foundation of Knowledge. Burlington, MA. Jones & Bartlett Learning; 2017.
- Ouyang D, Chen JH, Hom J, Chi J. Internal medicine resident computer usage: an electronic audit of an inpatient service. JAMA Intern Med. Feb 2016;176(2):252-254. [ FREE Full text ] [ CrossRef ] [ Medline ]
- Sinsky C, Colligan L, Li L, Prgomet M, Reynolds S, Goeders L, et al. Allocation of physician time in ambulatory practice: a time and motion study in 4 specialties. Ann Intern Med. Dec 06, 2016;165(11):753-760. [ CrossRef ] [ Medline ]
- Arndt BG, Beasley JW, Watkinson MD, Temte JL, Tuan WJ, Sinsky CA, et al. Tethered to the EHR: primary care physician workload assessment using EHR event log data and time-motion observations. Ann Fam Med. Sep 2017;15(5):419-426. [ FREE Full text ] [ CrossRef ] [ Medline ]
- Islam MM, Poly TN, Li YC. Recent advancement of clinical information systems: opportunities and challenges. Yearb Med Inform. Aug 2018;27(1):83-90. [ FREE Full text ] [ CrossRef ] [ Medline ]
- Piscotty RJ, Tzeng HM. Exploring the clinical information system implementation readiness activities to support nursing in hospital settings. Comput Inform Nurs. Nov 2011;29(11):648-656. [ CrossRef ] [ Medline ]
- Sheikh A, Sood HS, Bates DW. Leveraging health information technology to achieve the "triple aim" of healthcare reform. J Am Med Inform Assoc. Jul 2015;22(4):849-856. [ FREE Full text ] [ CrossRef ] [ Medline ]
- Menachemi N, Collum TH. Benefits and drawbacks of electronic health record systems. Risk Manag Healthc Policy. 2011;4:47-55. [ FREE Full text ] [ CrossRef ] [ Medline ]
- Degen C, Li J, Angerer P. Physicians' intention to leave direct patient care: an integrative review. Hum Resour Health. Sep 08, 2015;13:74. [ FREE Full text ] [ CrossRef ] [ Medline ]
- Eschenroeder HC, Manzione LC, Adler-Milstein J, Bice C, Cash R, Duda C, et al. Associations of physician burnout with organizational electronic health record support and after-hours charting. J Am Med Inform Assoc. Apr 23, 2021;28(5):960-966. [ FREE Full text ] [ CrossRef ] [ Medline ]
- Akbar F, Mark G, Warton EM, Reed ME, Prausnitz S, East JA, et al. Physicians' electronic inbox work patterns and factors associated with high inbox work duration. J Am Med Inform Assoc. Apr 23, 2021;28(5):923-930. [ FREE Full text ] [ CrossRef ] [ Medline ]
- Berg S. Family doctors spend 86 minutes of “pajama time” with EHRs nightly. American Medical Association. Sep 11, 2017. URL: https://www.ama-assn.org/practice-management/digital/family-doctors-spend-86-minutes-pajama-time-ehrs-nightly [accessed 2021-10-12]
- Tai-Seale M, Dillon E, Yang Y, Nordgren R, Steinberg R, Nauenberg T, et al. Physicians' well-being linked to in-basket messages generated by algorithms in electronic health records. Health Aff (Millwood). Jul 2019;38(7):1073-1078. [ FREE Full text ] [ CrossRef ] [ Medline ]
- Baxter SL, Saseendrakumar BR, Cheung M, Savides TJ, Longhurst CA, Sinsky CA, et al. Association of electronic health record Inbasket message characteristics with physician burnout. JAMA Netw Open. Nov 01, 2022;5(11):e2244363. [ FREE Full text ] [ CrossRef ] [ Medline ]
- Lieu TA, Altschuler A, Weiner JZ, East JA, Moeller MF, Prausnitz S, et al. Primary care physicians' experiences with and strategies for managing electronic messages. JAMA Netw Open. Dec 02, 2019;2(12):e1918287. [ FREE Full text ] [ CrossRef ] [ Medline ]
- Nguyen OT, Turner K, Apathy NC, Magoc T, Hanna K, Merlo LJ, et al. Primary care physicians' electronic health record proficiency and efficiency behaviors and time interacting with electronic health records: a quantile regression analysis. J Am Med Inform Assoc. Jan 29, 2022;29(3):461-471. [ FREE Full text ] [ CrossRef ] [ Medline ]
- Cutrona SL, Fouayzi H, Burns L, Sadasivam RS, Mazor KM, Gurwitz JH, et al. Primary care providers' opening of time-sensitive alerts sent to commercial electronic health record InBaskets. J Gen Intern Med. Nov 14, 2017;32(11):1210-1219. [ FREE Full text ] [ CrossRef ] [ Medline ]
- Akbar F, Mark G, Prausnitz S, Warton EM, East JA, Moeller MF, et al. Physician stress during electronic health record inbox work: in situ measurement with wearable sensors. JMIR Med Inform. Apr 28, 2021;9(4):e24014. [ FREE Full text ] [ CrossRef ] [ Medline ]
- Brunken M, Bice C. Achieving EHR satisfaction in any specialty: impact report. KLAS Research. 2019. URL: https://klasresearch.com/archcollaborative/report/achieving-ehr-satisfaction-in-any-specialty/310 [accessed 2024-04-08]
- Kroth PJ, Morioka-Douglas N, Veres S, Babbott S, Poplau S, Qeadan F, et al. Association of electronic health record design and use factors with clinician stress and burnout. JAMA Netw Open. Aug 02, 2019;2(8):e199609. [ FREE Full text ] [ CrossRef ] [ Medline ]
- CMA national physician health survey: a national snapshot. Canadian Medical Association. 2018. URL: https://www.cma.ca/cma-national-physician-health-survey-national-snapshot [accessed 2024-04-08]
- Holmgren AJ, Downing NL, Bates DW, Shanafelt TD, Milstein A, Sharp CD, et al. Assessment of electronic health record use between US and non-US health systems. JAMA Intern Med. Feb 01, 2021;181(2):251-259. [ FREE Full text ] [ CrossRef ] [ Medline ]
- Essén A, Stern AD, Haase CB, Car J, Greaves F, Paparova D, et al. Health app policy: international comparison of nine countries' approaches. NPJ Digit Med. Mar 18, 2022;5(1):31. [ FREE Full text ] [ CrossRef ] [ Medline ]
- Moy AJ, Schwartz JM, Chen R, Sadri S, Lucas E, Cato KD, et al. Measurement of clinical documentation burden among physicians and nurses using electronic health records: a scoping review. J Am Med Inform Assoc. Apr 23, 2021;28(5):998-1008. [ FREE Full text ] [ CrossRef ] [ Medline ]
- Aggarwal R, Ranganathan P. Study designs: part 2 – descriptive studies. Perspect Clin Res. 2019;10(1):34-36. [ CrossRef ]
- About AHS. Alberta Health Services. URL: https://www.albertahealthservices.ca/about/about.aspx [accessed 2020-08-19]
- University of Alberta Hospital. University Hospital Foundation. URL: https://givetouhf.ca/university-of-alberta-hospital/ [accessed 2023-01-16]
- Nath B, Williams B, Jeffery MM, O'Connell R, Goldstein R, Sinsky CA, et al. Trends in electronic health record inbox messaging during the COVID-19 pandemic in an ambulatory practice network in New England. JAMA Netw Open. Oct 01, 2021;4(10):e2131490. [ FREE Full text ] [ CrossRef ] [ Medline ]
- Saag HS, Shah K, Jones SA, Testa PA, Horwitz LI. Pajama time: working after work in the electronic health record. J Gen Intern Med. Sep 9, 2019;34(9):1695-1696. [ FREE Full text ] [ CrossRef ] [ Medline ]
- SAS/STAT® 14.3 user’s guide high-performance procedures. SAS Institute Inc. 2017. URL: https://support.sas.com/documentation/onlinedoc/stat/143/stathpug.pdf [accessed 2024-04-08]
- What is tableau? Tableau. URL: https://www.tableau.com/why-tableau/what-is-tableau [accessed 2023-01-16]
- Dulku K, Toll E, Kwun J, van der Meer G. The learning curve of BiZact™ tonsillectomy. Int J Pediatr Otorhinolaryngol. Jul 2022;158:111155. [ CrossRef ] [ Medline ]
- Zou YM, Ma Y, Liu JH, Shi J, Fan T, Shan YY, et al. Trends and correlation of antibacterial usage and bacterial resistance: time series analysis for antibacterial stewardship in a Chinese teaching hospital (2009-2013). Eur J Clin Microbiol Infect Dis. Apr 10, 2015;34(4):795-803. [ CrossRef ] [ Medline ]
- Frequently asked questions. Alberta Health Services. URL: https://www.albertahealthservices.ca/info/Page15938.aspx [accessed 2024-04-08]
- Khairat S, Zalla L, Gartland A, Seashore C. Association between proficiency and efficiency in electronic health records among pediatricians at a major academic health system. Front Digit Health. Sep 6, 2021;3:689646. [ FREE Full text ] [ CrossRef ] [ Medline ]
- Cohen GR, Boi J, Johnson C, Brown L, Patel V. Measuring time clinicians spend using EHRs in the inpatient setting: a national, mixed-methods study. J Am Med Inform Assoc. Jul 30, 2021;28(8):1676-1682. [ FREE Full text ] [ CrossRef ] [ Medline ]
- Tai-Seale M, Olson CW, Li J, Chan AS, Morikawa C, Durbin M, et al. Electronic health record logs indicate that physicians split time evenly between seeing patients and desktop medicine. Health Aff (Millwood). Apr 01, 2017;36(4):655-662. [ FREE Full text ] [ CrossRef ] [ Medline ]
Abbreviations
Edited by K Williams; submitted 10.10.23; peer-reviewed by M Zaidi, N Shaw; comments to author 26.01.24; revised version received 12.03.24; accepted 19.03.24; published 29.04.24.
©Melita Avdagovska, Craig Kuziemsky, Helia Koosha, Maliheh Hadizadeh, Robert P Pauly, Timothy Graham, Tania Stafinski, David Bigam, Narmin Kassam, Devidas Menon. Originally published in the Journal of Medical Internet Research (https://www.jmir.org), 29.04.2024.
This is an open-access article distributed under the terms of the Creative Commons Attribution License (https://creativecommons.org/licenses/by/4.0/), which permits unrestricted use, distribution, and reproduction in any medium, provided the original work, first published in the Journal of Medical Internet Research, is properly cited. The complete bibliographic information, a link to the original publication on https://www.jmir.org/, as well as this copyright and license information must be included.
IMAGES
VIDEO
COMMENTS
Descriptive research aims to accurately and systematically describe a population, situation or phenomenon. It can answer what, where, when and how questions, but not why questions. Learn about the when, how and what of descriptive research, as well as the different types of methods and examples.
Box 1. Descriptive Analysis Is a Critical Component of Research Box 2. Examples of Using Descriptive Analyses to Diagnose Need and Target Intervention on the Topic of "Summer Melt" Box 3. An Example of Using Descriptive Analysis to Evaluate Plausible Causes and Generate Hypotheses Box 4.
Learn what descriptive analysis is, how it helps summarize and describe data, and what techniques and measures are used for it. Explore the types of descriptive analysis, such as frequency, central tendency, dispersion, and position, with examples and charts.
Learn how descriptive analytics can help researchers summarize, interpret, and visualize historical data. Explore the techniques, tools, and applications of descriptive analytics in research and business.
Learn what descriptive analysis is, why it is useful, and how to do it with four types of statistical methods. See examples of descriptive analysis in business and research contexts.
Descriptive analysis is a sort of data research that aids in describing, demonstrating, or helpfully summarizing data points so those patterns may develop that satisfy all of the conditions of the data. It is the technique of identifying patterns and links by utilizing recent and historical data. Because it identifies patterns and associations ...
Descriptive statistics, although relatively simple, are a critically important part of any quantitative data analysis. Measures of central tendency include the mean (average), median and mode. Skewness indicates whether a dataset leans to one side or another. Measures of dispersion include the range, variance and standard deviation.
Descriptive statistics summarise and organise characteristics of a data set. A data set is a collection of responses or observations from a sample or entire population . In quantitative research , after collecting data, the first step of statistical analysis is to describe characteristics of the responses, such as the average of one variable (e ...
Descriptive analysis identifies patterns in data to answer questions about who, what, where, when, and to what extent. This guide describes how to more effectively approach, conduct, and communicate quantitative descriptive analysis. The primary audience for this guide includes members of the research community who conduct and publish both ...
Descriptive research is a common investigatory model used by researchers in various fields, including social sciences, linguistics, and academia. ... The absence of statistical and in-depth analysis and the rather superficial character of the investigative procedure are drawbacks of this research approach.
Learn what descriptive research design is, how it differs from other types of research, and how to conduct it. Find out the types, methods, applications, and examples of descriptive research design in various fields.
Reflect on the QCI research scenario and the associated data set discussed in Chap. 10.1007/978-981-15-2537-7_4. Consider the following questions that Maree might wish to address with respect to decision accuracy and speed scores: ... Analysis Descriptive Statistics Descriptive Statistics then select the reports and plots that you want to see ...
Some distinctive characteristics of descriptive research are: Quantitative research: It is a quantitative research method that attempts to collect quantifiable information for statistical analysis of the population sample. It is a popular market research tool that allows us to collect and describe the demographic segment's nature.
5 Examples of Descriptive Analytics. 1. Traffic and Engagement Reports. One example of descriptive analytics is reporting. If your organization tracks engagement in the form of social media analytics or web traffic, you're already using descriptive analytics. These reports are created by taking raw data—generated when users interact with ...
Numeric data collected in a research project can be analysed quantitatively using statistical tools in two different ways. Descriptive analysis refers to statistically describing, aggregating, and presenting the constructs of interest or associations between these constructs.Inferential analysis refers to the statistical testing of hypotheses (theory testing).
Descriptive statistics are fundamental in the field of data analysis and interpretation, as they provide the first step in understanding a dataset. ... Presenting Research Findings: Descriptive statistics can be used to present research findings in a clear and understandable way, often using visual aids like graphs or charts.
Descriptive research typically involves the collection of both qualitative and quantitative data through methods such as surveys, observational studies, case studies, or focus groups. 4. Data Analysis. Descriptive research data is analyzed to identify patterns, relationships, and trends within the data.
Qualitative research collects data qualitatively, and the method of analysis is also primarily qualitative. This often involves an inductive exploration of the data to identify recurring themes, patterns, or concepts and then describing and interpreting those categories. Of course, in qualitative research, the data collected qualitatively can ...
Descriptive statistics can help in summarizing data in the form of simple quantitative measures such as percentages or means or in the form of visual summaries such as histograms and box plots. Descriptive statistics can be used to describe a single variable (univariate analysis) or more than one variable (bivariate/multivariate analysis).
Abstract and Figures. Descriptive statistics is the initial stage of analysis used to describe and summarize data. The availability of a large amount of data and very efficient computational ...
Introduction. Qualitative descriptive approaches to nursing and healthcare research provide a broad insight into particular phenomena and can be used in a variety of ways including as a standalone research design, as a precursor to larger qualitative studies and commonly as the qualitative component in mixed-methods studies.
This research aims to analyze the past literature on blended learning in higher education and investigate the research trends on this subject. Thus, it aims to present a roadmap for future studies. In this context, bibliometric and descriptive analysis methods were used in the study carried out with the descriptive survey model. 1970 studies were accessed using the Web of Science (WoS ...
Qualitative approach and research paradigm. Descriptive phenomenological qualitative study design was employed to explore factors influencing engagement of health professionals in MDR-TB prevention and management and thematic technique was employed for the analysis of the data. Researchers' characteristics and reflexivity
Methods: A descriptive study was conducted. Due to the diversity of specialties, the providers were grouped into medical and surgical based on previous similar studies. ... medical FTE >0.5, and surgical (all of whom reported FTE >0.5). The analysis was limited to outpatient clinical interactions and explicitly excluded inpatient activities ...
Qualitative description (QD) is a label used in qualitative research for studies which are descriptive in nature, particularly for examining health care and nursing-related phenomena (Polit & Beck, 2009, 2014).QD is a widely cited research tradition and has been identified as important and appropriate for research questions focused on discovering the who, what, and where of events or ...
We discuss examples of the most common metadata errors and compare results with findings of previous research. Empirical data obtained in this study allows assessing preparedness of information professionals to create metadata that is functional in supporting resource discovery.
Feature papers represent the most advanced research with significant potential for high impact in the field. A Feature Paper should be a substantial original Article that involves several techniques or approaches, provides an outlook for future research directions and describes possible research applications.