- Skip to main content
- Skip to primary sidebar
Political Science Research
iResearchNet

Qualitative vs Quantitative Research
For decades, there has been a raging debate among scholars regarding the differences between and advantages of qualitative and quantitative methods. In fact, this has probably been one of the largest and longest methodological debates in all of social science research. Perhaps it can be briefly summarized by the following two famous and opposing quotations: Donald Campbell says, “All research ultimately has a qualitative grounding”; and Fred Kerlinger says, “There’s no such thing as qualitative data. Everything is either 1 or 0” (in Miles & Huberman, 1994, p. 40). Although it is not necessarily critical to determine which—if either—of these approaches can be described as the better one, it is imperative to have a thorough understanding of these methods in order to be able to conduct sound political science research. After all, for a study to be of value to scholars and other individuals interested in the topic, it is necessary for one to choose the correct research approach, ask suitable questions, use appropriate research methods and statistical analyses, correctly deduce or induce inferences, and have suitable general goals driving the research.
The questions under consideration and the answers obtained by any particular study will depend on whether the study uses quantitative or qualitative approaches. The purpose of this article is to differentiate between these two types of research. First, the literature available on this topic is briefly summarized, focusing specifically on how qualitative and quantitative research is defined, as well as the different assumptions on which these types of research are based. Next, a summary of the similarities and differences in each stage of the research process is provided. Then, the different methods that these two types of approaches use are discussed. Next, since this is a book examining political science in the 21st century, current and future research directions are examined. In particular, the use of what are called mixed methods approaches is discussed. The article ends with a brief summary and conclusion of the information that has been presented. Finally, suggested books and articles for further reading are provided, including some material for individuals interested in conducting advanced statistical studies, which are beyond the scope of this article.
Definition of Quantitative Research
Assumptions of quantitative research, definition of qualitative research, assumptions of qualitative research, the research question, research design, data collection, data analysis, reporting of results, limitations of quantitative methods, limitations of qualitative methods, future directions, quantitative and qualitative research.
The following section introduces the definitions and assumptions of quantitative and qualitative research. First, however, it is worth briefly discussing two types of political analysis in order to understand the origins of quantitative and qualitative methods. Political scientists distinguish between empirical analysis—obtaining and dealing with knowledge and information—and normative analysis— determining how to use that knowledge. Normative analysis relies on the development of subjective goals and values to apply what has been learned to reality. Empirical analysis, however, focuses on using common terms to explain and describe political reality and can be either quantitative or qualitative in nature. If something is empirical, it is verifiable through observations or experiments. Empirical analysis is the focus of this article.
As a first step, it is necessary to define these two methods of research and examine their goals. Quantitative research can be defined as a process of inquiry examining an identified problem that is based on testing a theory measured by numbers and analyzed with statistical techniques. Thus, quantitative research involves the analysis of numerical data. A more technical definition is provided by Brady and Collier (2004), who define mainstream quantitative methods as “an approach to methodology strongly oriented toward regression analysis, econometric refinements on regression, and the search for statistical alternatives to regression models in contexts where specific regression assumptions are not met” (p. 294). The econometric refinements and statistical alternatives referred to by the authors are beyond the scope of this article but include logit and probit models, time-series analysis, and a variety of techniques to circumvent problems that can occur in regression analysis, such as heteroskedasticity and autocorrelation. Essentially, quantitative methods have played a major role in improving on commonly used research tools within the structure of regression models that are frequently used in the field of political science.
The goal of quantitative research is to examine particular instances or aspects of phenomena to determine if predictive generalizations of a theory hold true or to test causal hypotheses. As a result, there are several key assumptions underlying quantitative research methods, which are briefly outlined here. These include the following:
- Reality can be studied objectively.
- Research must remain independent of the researcher through the use of experiments, questionnaires, machines, or inventories.
- Research is value free, and the researcher does not become a part of or interfere with the research.
- Theories and hypotheses are tested in a cause effect order with research based primarily on deductive forms of logic identified a priori by the researcher.
- The purpose of research is to develop generalizations that contribute to theory and allow the researcher to predict, explain, and understand a particular phenomenon.
Qualitative research can be defined as a process of inquiry that builds a complex and holistic picture of a particular phenomenon of interest by using a natural setting. Thus, qualitative research involves the analysis of words, pictures, videos, or objects in the context in which they occur.
The goal of qualitative research is to understand social issues from multiple perspectives to have a comprehensive understanding of a particular event, person, or group. As with quantitative research, there are several key assumptions underlying qualitative research methods:
- Reality is socially constructed, and there are multiple realities.
- The researcher interacts and often works closely with the individuals or groups under study and serves as the primary instrument for data collection and analysis.
- The research is value laden, and the researchers become a part of the research, attempting to understand the lives and experiences of the people they study.
- Research is context bound and based on inductive forms of logic that emerge as a study progresses.
- The purpose of research is to find theories that help explain a particular phenomenon.
Comparing and Contrasting Quantitative and Qualitative Research Methods
The following section examines how quantitative and qualitative methods are similar to and different from each other throughout the research process, beginning with the creation of a research question and up to the reporting of the results. Although examining quantitative and qualitative methods as two separate categories is necessary for the sake of clarification throughout this section, it is important to realize that these two methods are not mutually exclusive, a topic that will be discussed in more detail shortly. As Manheim, Rich, Willnat, and Brians (2007) note, when examining the differences between quantitative and qualitative methods, “The distinctions discussed are generally more matters of degree than absolutes. The two types of methods often require only different forms of work, but are working toward similar objectives” (p. 323). This is important to keep in mind while reading this article.
The first step in conducting sound political science research is selecting a research question. An appropriate research question should fulfill either a scientific need or a societal need by helping to provide an answer to an important problem. Both quantitative and qualitative forms of research begin by creating a research question that is intended to produce knowledge of the empirical world. In terms of the research questions, the main difference between quantitative and qualitative methods typically exists in the type of questions that are being posed.
A theory is a potential explanation for events and is composed of a set of logically related propositions and assumptions. Theorizing is the actual process of stating these conceptual explanations for events that take place in the real world by proclaiming relationships among the concepts. Theories are created to help people understand phenomena. There are several characteristics that make a theory particularly useful in explaining observations. Theories should be (a) testable, (b) logically sound, (c) communicable, (d) general, and (e) parsimonious.
Theorizing is a critical phase of the research process for quantitative and qualitative researchers. However, quantitative researchers are more likely than qualitative researchers to focus on testing performed theories. Quantitative researchers base their studies on a theory that relates to their subject in an attempt to develop generalizations that contribute to theory. Thus, in quantitative research, theorizing occurs prior to the collection of data. Qualitative researchers, on the other hand, are more likely than quantitative researchers to elaborate on theories while making observations of a particular phenomenon. Many qualitative researchers argue that, as a result of this, their theories are far more grounded in reality than are those of quantitative researchers. However, quantitative researchers argue that the formulation of theory during the observation-making process can easily lead to the creation of a theory designed around those specific observations. As a result, these theories would be polluted and not testable. Furthermore, if a theory is based on observation of one particular group, the usefulness of the theory is quite limited.
Simply defined, a research design is the plan of a study. It organizes observations in a manner that establishes a logical basis for causal inference. Essentially, the research design can be viewed as the blueprint for a study. There are three main types of research designs in political science: exploratory, descriptive, and explanatory. Exploratory research attempts to discover which factors should be included when theorizing about and researching a particular subject. Descriptive research attempts to measure some aspect of reality for its own sake and not for the purpose of developing or testing some theory. Explanatory research uses observations of reality to test hypotheses and help develop an understanding of patterns of behavior in the context of a specific theory.
Regardless of the purpose of a study, every research design should have the same basic elements, which are outlined by Manheim et al. (2007): (a) a statement outlining the purpose of the research; (b) a review of the theory and any hypotheses that are going to be tested, if applicable; (c) a statement explaining the variables that will be used; (d) an explanation of the operationalization and measurement of the variables; (e) a statement of how observations will be organized, as well as conducted; and (f) a discussion of how the data that are collected will be analyzed.
Although both quantitative and qualitative researchers produce research designs for their studies, quantitative researchers are much more likely than their counterparts to base their designs on the logic of experiments. For instance, quantitative researchers often emphasize control groups, pretests, and other elements that provide them with the opportunity to hold some factor(s) constant in their attempt to make causal inferences. Qualitative research designs, on the other hand, typically focus more on who or what is being observed, where the observation will take place, how observations will be conducted, and how the data will be recorded. For qualitative researchers, more emphasis is placed on viewing people and events as they naturally occur, while for quantitative researchers there is a greater focus on establishing cause-and-effect relationships.
A sample is a small group of cases drawn from and used to represent a larger population under consideration. A representative sample is a sample in which each major attribute of the larger population occurs in approximately the same proportion or frequency as in the larger population. “In other words, a truly representative sample is a microcosm—a smaller, but accurate model—of the larger population from which it is taken” (Manheim et al., 2007, p. 119). When a sample is representative, the conclusions drawn from it are generalizable to the entire population.
In quantitative studies, sampling is based on the logic of probability to produce statistical representativeness. Additionally, in quantitative research, sampling is done before the data are collected. Qualitative researchers, on the other hand, usually create their sample once their study is already in progress. After observing, learning about, and gaining understanding from an initial case, qualitative researchers are then able to determine what they will observe next. Additionally, whereas generalizability is a chief concern for quantitative researchers, this is not the case for qualitative researchers, who are far more concerned with finding the specific information that they are looking for from their sample. Since this method is very time-consuming, qualitative findings are often based on fewer cases than quantitative findings.
Data are observations or information about reality that represent attributes of variables and result from the research process. Although data collection is an integral part of both types of research methods, data are composed of words in qualitative research and numbers in quantitative research, which results in a data collection process that differs significantly for quantitative and qualitative research. Furthermore, the data collection process is different: Although quantitative researchers have the ability to administer a previously prepared questionnaire or watch an experiment unfold behind blind glass, qualitative researchers are engaged—sometimes for long periods of time—with the people or groups under study.
As can likely be seen by now, quantitative researchers frequently have a detailed plan of action that is thought out prior to the beginning of a study’s taking place. Qualitative researchers, on the other hand, tend to take a more fluid approach to their studies. This holds true for the analysis of data, as well. Whereas in quantitative studies, the data analysis methods are planned out in advance and then occur after the data are collected, data analysis typically takes place at the same time as data collection in qualitative studies. To make appropriate future observations, analyses must often begin after studying one to several initial cases. As a result, quantitative researchers are not usually afforded the opportunity to modify their methods of data collection during a project, while qualitative researchers can do so at any point in a project after conducting the initial data analysis.
Additionally, although qualitative data are more subjective and sometimes difficult to interpret, quantitative data are easily coded into numerical formats. As a result, it is much easier to enter quantitative data into computer programs, such as Excel and SPSS, than it is to enter qualitative data. Furthermore, there are a number of programs that analyze the statistical data, such as SPSS and Stata. Although programs do exist for the interpretation of qualitative data, they are not used nearly as extensively as those used for quantitative data analysis.
Finally, whereas quantitative researchers have a variety of means to test the statistical significance and validity of the data that they are analyzing, this is not the case for qualitative researchers. Instead, qualitative researchers must do their best to present a clear, accurate, and convincing analysis of their data. As a result, a topic of much debate between quantitative and qualitative researchers is the validity and reliability of findings produced in studies. Validity is the extent to which measures correspond to the concepts they are intended to reflect. Reliability is the consistency with which a measuring instrument allows assignment of values to cases when repeated over time. Although a measure can be reliable without being valid, it cannot be valid without being reliable.
Additionally, since one of the main points of conducting quantitative research is to study causal relationships, part of the process involves manipulating various factors that could potentially influence a phenomenon of interest while at the same time controlling for other variables that could affect the outcome. For instance, if a researcher were examining if gender played a role in whether a person received a job, it would be important to control for other variables, such as education or previous work experience, since these factors may also determine why an individual would receive an employment offer. In quantitative analysis, empirical relationships and associations are typically examined by using general linear models, nonlinear models, or factor analysis to understand important information about the relationship between variables, such as the direction of a relationship. However, despite the results that may be produced by these models, it is important to note that a major tenet of quantitative research is that correlation does not imply causation. In other words, a spurious relationship is always a possible result of the data analysis.
When presenting the results of a study, qualitative researchers often have an arduous task in front of them. Since their reports typically rely on the interpretation of observations, it is necessary for them to be very careful in the selection of what stories, quotations, pictures, and so on, they will share in order to avoid bias. The reports produced by quantitative researchers tend to be more straightforward since they rely mostly on the interpretation of statistics. But here, too, it is important to make sure that bias was avoided in the sample and that appropriate data analysis methods were used in order to avoid bias in quantitative analysis.
To sum up, there are a lot of similarities among quantitative and qualitative research methods. Irrespective of which method is used, it is still necessary to create an appropriate research question, understand the theory behind what will be observed, create a research design, collect and analyze data, and create a report of the results. However, there are several key differences between quantitative and qualitative research methods. These methods differ in (a) the types of questions that they pose, (b) their analytical objectives, (c) the amount of flexibility allowed in the research design, (d) the data collection instruments that are used, and (e) the type of data that are ultimately produced. According to Mack, Woodsong, MacQueen, Guest, and Namey (2005), the fifth difference is the biggest. The authors argue that quantitative methods are generally inflexible since categories are typically closed-ended or fixed, while qualitative methods are more flexible, with a large amount of spontaneity and adaptation occurring during interaction with other people, especially in the form of open-ended questions.
To decide which research approach should be used, several things should be taken into account, including the problem of interest, the resources available, the skills and training of the researcher(s), and the audience for the research. Since there are considerable differences in the assumptions that underlie these two research approaches, as well as the collection and analysis of data, these considerations are important. The following sections provide a more detailed examination of the various types of quantitative and qualitative research methods, as well as the limitations of these methods in general.
Quantitative Methods in Political Science
Quantitative methods are essentially a variety of research techniques that are used to gather quantitative data. There are a variety of different types of quantitative methods, which are briefly outlined in this section: experiments, quasi experiments, content analysis, and surveys. First, in experiments, participants are randomly assigned to experimental conditions, as well as experimental controls. The individuals who are assigned to experimental controls are testing the independent variable. The difference between experiments and quasi experiments is the way that subjects are selected. In quasi experiments, participants are assigned to experimental conditions in a nonrandom fashion.
Next, content analysis is a systematic means of counting and assessing information in order to interpret it. For instance, scholars may count the number of times that personal characteristics, such as dress or hairstyle, are mentioned in newspaper articles to determine whether media coverage of male and female candidates differs. Finally, surveys are used to estimate the characteristics of a population based on responses to questionnaires and interviews from a sample of the population. Surveys provide five types of information: (1) facts, (2) opinions, (3) perceptions, (4) attitudes, and (5) behavioral reports. Essentially, questionnaires and surveys can serve as a means for helping scholars understand why people feel or act the way that they do, as well as measure their attitudes and assess their behaviors.
There are three key criticisms of quantitative research that are discussed here. First, since quantitative research methods were adopted from the physical sciences, critics argue that all cases are treated as though they are alike. Complex concepts are turned into numbers, and their unique elements are dissipated as a result. Furthermore, people can easily attribute different meanings to something even when they are experiencing the same phenomena. Second, and related to the first criticism, some people argue that quantitative methods are inherently biased. Since they are adopted from the physical sciences, critics argue that quantitative methods fail to take into account the unique cultural roots and other critical aspects of marginalized groups of people. Thus, according to critics, when it comes to populations that have been politically excluded, the usage of quantitative methods may not be appropriate, according to critics. Third, critics argue that quantitative research methods result in taking individuals out of their natural settings to examine very limited aspects of what a person thinks or believes. To these critics, context is very important, and by taking actions out of context, it is impossible to understand the true meaning of events or responses.
Qualitative Methods in Political Science
Just as quantitative research methods have a variety of research techniques that are used to gather data, there are also a variety of qualitative methods. This section focuses on several of these: ethnographic studies, phenomenological studies, case studies, focus groups, and intense interviews. First, in ethnographic studies, researchers examine cultural groups in their natural setting. Examples of cultural groups can include students in a dormitory, women in a crisis center, or people from a village in Asia. This type of study can provide rich, detailed information about the individuals in various groups, since it involves first-hand observation.
Second, in phenomenological studies, a small group of people is studied intensively over a long period to understand the life experience of the individuals being studied. Phenomenological studies can involve direct or indirect observation. Additionally, depending on the study, the individuals being observed may or may not know the purpose of the study or what exactly is being observed. Sometimes the researcher relies on building a trusting relationship with the subjects so the subjects act as naturally as possible even though they are being observed. As a result of this closeness, the researcher can often tell when a person is modifying his or her behavior. However, it is not always possible to establish this kind of relationship. As a result, some researchers conceal the purpose of their studies from those being observed to avoid the modifying of behavior by the subject. This process of behavior modification by the respondent is called reactivity and can greatly affect the results of a study.
Third, in a case study, a case is studied by a researcher, and detailed information about the entity or phenomenon is recorded. Sometimes information that is found in a case study can lend itself to the content analytical techniques discussed in the previous quantitative research section. Other times, newspapers, books, interviews, or other sources may be used. In content analysis, researchers are looking for specific words, phrases, or general ideas that are relevant to their study. The researchers will then count the instances of these items to learn more about a particular subject. For instance, some political scientists are interested in learning about gender bias in the media. By examining how often a female versus a male candidate is mentioned in an article or the type of coverage the candidate receives, these scholars are able to draw conclusions about gender bias in the media.
Finally, there are two other ways to collect and analyze qualitative data that are of relevance in this section—focus groups and intense interviewing. Focus groups are in-depth studies composed of small groups of people who have guided discussions. For instance, a focus group may be shown a political advertisement that a political campaign hopes to air on television. After watching the advertisement, members of the group are asked questions, and a discussion is prompted in which they can discuss their feelings about the ad, such as what they liked and did not like, as well as whether they were swayed by the ad and found it to be credible. These responses allow the advertisement’s producers to make changes that make the ad more effective.
Intense interviews are similar to survey questionnaires in that the interviewer generally has some thoughts in mind about what the respondent will be asked. However, although survey questions are planned out in their entirety in advance, this is often not the case in intense interviews where the interviewee has the ability to ask follow-up questions or a variety of other questions related to an answer provided by the respondent. Additionally, whereas survey questionnaire responses tend to be closed-ended (a particular response can be chosen from those available), intense interview responses are typically open-ended (no response categories) and can be very detailed. Thus, researchers have more flexibility when conducting an intense interview than they would if they were administering a questionnaire; however, their results are typically not quantifiable.
Just as quantitative methods have their detractors, so too do qualitative methods. Some of the biggest criticisms of qualitative methods are outlined in this section. First, some critics argue that qualitative methods focus too much on particular individuals, sometimes at the expense of seeing the bigger picture, and they fail to make their results generalizable to a larger population. Second, critics note that the quality of the results and analysis that are produced are highly dependent on the skill of the researcher. It is necessary for the researcher to have remained unbiased and provide a clear assessment of the subjects under study, or the results are essentially meaningless. Third, it is very time-consuming to conduct qualitative research studies. The amount of time spent conducting interviews and making observations is just the beginning. After these take place, the researchers still have to figure out a way to analyze the vast amounts of information that they have collected to produce results.
As can be seen from the information provided throughout this article, there has been a raging decades-long debate as to whether qualitative or quantitative research is better. Many scholars focus on qualitative versus quantitative techniques, automatically framing these methods and approaches in opposition to each other. Although it may appear that qualitative and quantitative data exist in opposition to each other, this is not necessarily the case. As King, Keohane, and Verba (1994) argue, “The two traditions appear quite different; indeed they sometimes seem to be at war. Our view is that these differences are mainly ones of style and specific technique. The same underlying logic provides the framework for each research approach” (p. 3). As a result, research does not typically fit into one particular category or another.
Additionally, King et al. (1994) note that we live in a world that changes rapidly, and to fully understand the changes that occur around us, it is necessary to be able to take into account information that can be quantified, as well as information that cannot. Furthermore, since social science requires comparison, it is important to examine both quantitative differences (such as which phenomena are more or less alike in degree) and qualitative differences (such as which phenomena are more or less alike in kind).
In recent years, scholars have been focusing a lot more on triangulation. Triangulation is essentially the idea that more than one research technique can be used to examine a research question to further verify the findings. Triangulation can help improve confidence about the results produced from a study. Quantitative and qualitative research can frequently be integrated, creating mixed-methods research that can depict a clearer picture of a social science phenomenon than one single method on its own.
Another way that quantitative and qualitative methods can exist together is by coding qualitative data into quantitative data. Just about any type of qualitative data can be assigned meaningful numerical values that can be manipulated to help condense the information and gain a different and more generalizable understanding of the data. One frequently used example is open-ended questions. Although more detailed insight is gained from an open-ended question than a categorical question, open-ended questions can typically be broken down into simple numerical categories allowing for a quantitative analysis of the data.
The Research Network on Gender Politics and the State (RNGS) serves as another good example. The researchers in RNGS had been conducting a crossnational, longitudinal, qualitative research project that explored changes in public policy processes dating back to the 1960s. Starting in 2000, however, the researchers began to code their vast qualitative data into a large quantitative data file. By using quantitative coding, additional useful information may be garnered, and a new form of data analysis is possible. As can be seen here, sometimes the line between quantitative and qualitative analysis may not be so clear after all.
On the other hand, quantitative data is inherently based on qualitative judgment because it is impossible to interpret numbers without understanding the assumptions underlying the numbers. When a person provides a numerical response to a survey question, for instance, many assumptions and judgments are present. For instance, if a person, when asked, “How satisfied are you with your life?” responds, “Very satisfied” (denoted by a value of 1), a variety of other questions could be asked. What does satisfaction mean to this respondent? Was he or she thinking only of the economic climate? Job? Family? Relationships? How does he or she define satisfaction, and how does this differ from how the next person defines satisfaction? Did the respondent even pay attention to or think about the question, or was he or she just offering quick responses? When and in what context was this question presented? The list goes on. As can be seen from this brief example, what appeared to be a simple numerical piece of information actually involved numerous judgments about the meaning of each response.
Quantitative and qualitative analysis are two general approaches to the analysis of data. Both seek to explain trends but have different means of doing this. Additionally, quantitative and qualitative research methods are each based on a basic set of assumptions. Both forms of research carefully follow each step in the research process, from formulating a research question to reporting the results of the data analysis. However, the order and ways in which this process is completed differ between quantitative and qualitative methods because of the different goals that researchers using these methods have for their studies. Essentially, though, at some level, quantitative and qualitative data are inseparable and do not exist in complete opposition to each other. Thus, it is almost self-defeating to claim that one method is better than the other. There are times when one is more appropriate to use in a given situation than another, but often, they can both be used together, whether at the same time or in different stages. As research progresses through the 21st century, it is highly probable that more scholars will use mixed-methods approaches.
References:
- Achen, C. H. (1982). Interpreting and using regression. Beverly Hills, CA: Sage.
- Adcock, R., & Collier, D. (2001). Measurement validity: A shared standard for qualitative and quantitative research. American Political Science Review, 95, 529-546.
- Agresti, A., & Finlay, B. (1997). Statistical methods for the social sciences (3rd ed.). Englewood Cliffs, NJ: Prentice Hall.
- Berg, B. L. (2003). Qualitative research methods for the social sciences (5th ed.). Boston: Allyn & Bacon.
- Box Steffensmeier, J.M., Brady, H. E., & Collier, D. (Eds.). (2008). The Oxford handbook of political methodology. New York: Oxford University Press.
- Brady, H., & Collier, D. (Eds.). (2004). Rethinking social inquiry: Diverse tools, shared standards. Lanham, MD: Rowman & Littlefield.
- Creswell, J. W. (2009). Research design: Qualitative and quantitative approaches (3rd ed.). Thousand Oaks, CA: Sage.
- Denzin, N. K., & Lincoln, Y. (2005). The SAGE handbook of qualitative research. Thousand Oaks, CA: Sage.
- Fink, A. (2005). How to conduct surveys: A step by step guide (3rd ed.). Thousand Oaks, CA: Sage.
- Frankfort Nachmias, C., & Nachmias, D. (1999). Research methods in the social sciences (6th ed.). New York: St. Martin’s.
- Frey, J. H., & Oishi, S. M. (2004). How to conduct interviews by telephone and in person. Thousand Oaks, CA: Sage.
- Gerring, J. (2001). Social science methodology: A critical frame work. Cambridge, UK: Cambridge University Press.
- Goodin, R. E., & Klingemann, H. D. (Eds.). (1996). A new hand book of political science. New York: Oxford University Press.
- Greene, J. C., Caracelli, V. J., & Graham, W. F. (1989). Towards a conceptual framework for mixed method evaluation designs. Education Evaluation and Policy Analysis, 11, 255-274.
- Gujarati, D. N. (2002). Basic econometrics (4th ed.). New York: McGraw Hill.
- Hewson, C., Yule, P., Laurent, D., & Vogel, C. (2002). Internet research methods: A practical guide for the social and behavioural sciences. Thousand Oaks, CA: Sage.
- Hoover, K., & Donovan, T. (2004). The elements of social scientific thinking (8th ed.). Belmont, CA: Wadsworth.
- Isaak, A. C. (1975). Scope and methods of political science: An introduction to the methodology of political inquiry. Homewood, IL: Dorsey Press.
- Johnson, J. B., Reynolds, H. T., & Mycoff, J. D. (2007). Political science research methods (6th ed.). Washington, DC: CQ Press.
- Kinder, D. R., & Palfrey, T. R. (1993). Experimental foundations of political science. Ann Arbor: University of Michigan Press.
- King, G., Keohane, R. O., & Verba, S. (1994). Designing social inquiry: Scientific inference in qualitative research. Princeton, NJ: Princeton University Press.
- Leege, D. C., & Francis, W. L. (1974). Political research: Design, measurement, and analysis. New York: Basic Books.
- Levy, P. S., & Lemeshow, S. (2003). Sampling of populations: Methods and applications (3rd ed.). New York: Wiley.
- Lohr, S. L. (1998). Sampling: Design and analysis. Pacific Grove, CA: Duxbury Press.
- Mack, N., Woodsong, C., MacQueen, K. M., Guest, G., & Namey, E. (2005). Qualitative research methods: A data collector’s field guide. Research Triangle Park, NC: Family Health International.
- Manheim, J. B., Rich, R. C., Willnat, L., & Brians, C. L. (2007). Empirical political analysis: Quantitative and qualitative research methods (7th ed.). Essex, UK: Longman.
- Marshall, C., & Rossman, G. B. (1999). Designing qualitative research (3rd ed.). Thousand Oaks, CA: Sage.
- McNabb, D. E. (2009). Research methods for political science: Quantitative and qualitative methods (2nd ed.). Armonk, NY: M. E. Sharpe.
- Miles, M. B., & Huberman, M. (1994). Qualitative data analysis: An expanded sourcebook (2nd ed.). Thousand Oaks, CA: Sage.
- Miller, D. C., & Salkind, N. J. (2002). Handbook of research design and social measurement (6th ed.). Thousand Oaks, CA: Sage.
- Ott, L. R., & Longnecker, M. T. (2001). An introduction to statistical methods and data analysis. Pacific Grove, CA: Brooks/Cole.
- Pollock, P., III. (2008). The essentials of political analysis. Washington, DC: CQ Press.
- Salmon, W. (1998). Causality and explanation. New York: Oxford University Press.
- Shiveley, W. P. (1990). The craft of political research. Englewood Cliffs, NJ: Prentice Hall.
- Silverman, D. (2001). Interpreting qualitative data: Methods for analyzing talk, text, and interaction (2nd ed.). Thousand Oaks, CA: Sage.
- Singleton, R. A., Jr., & Straits, B. C. (2004). Approaches to social research. New York: Oxford University Press.
- Weisberg, H. F., Krosnick, J. A., & Bowen, B. D. (1996). An introduction to survey research, polling, and data analysis (3rd ed.). Thousand Oaks, CA: Sage.
Reader Interactions
Breadcrumbs Section. Click here to navigate to respective pages.

Research Methods for Political Science
DOI link for Research Methods for Political Science
Get Citation
Thoroughly updated, more concise than the previous edition, and available for the first time in paperback, "Research Methods for Political Science" is designed to help students learn what to research, why to research, and how to research. The text integrates both quantitative and qualitative approaches to research in one volume, and includes the most comprehensive coverage of qualitative methods currently available. It covers such important topics as research design, specifying research problems, designing questionnaries and writing questions, designing and carrying out qualitative research, and analyzing both quantitative and qualitative research data. Heavily illustrated, classroom tested, and exceptionally readable and engaging, the text also provides specific instructions on the use of available statistical software programs such as Excel and SPSS.
TABLE OF CONTENTS
Part | 2 pages, part 1 foundations of political science research, chapter 1 | 12 pages, research fundamentals, chapter 2 | 14 pages, research approaches and methods, chapter 3 | 11 pages, understanding the research process, chapter 4 | 17 pages, selecting a research design and choosing a research topic, chapter 5 | 9 pages, preparing a research proposal, chapter 6 | 11 pages, the legal and ethical environment of research, part 2 quantitative research approaches and methods, chapter 7 | 17 pages, introduction to quantitative methods, chapter 8 | 13 pages, exploratory research: the probing approach, chapter 9 | 16 pages, descriptive research: the survey approach, chapter 10 | 16 pages, causal research: the experimental approach, chapter 11 | 16 pages, interpreting exploratory and descriptive statistics, chapter 12 | 19 pages, testing research hypotheses, chapter 13 | 16 pages, introduction to nonparametric statistics, chapter 14 | 15 pages, correlation and regression analysis in political science, chapter 15 | 16 pages, exploring multivariate statistics, part 3 qualitative research approaches and methods, chapter 16 | 11 pages, introduction to qualitative research methods, chapter 17 | 15 pages, explanatory research: case and historical methods, chapter 18 | 13 pages, the interpretive approach i: grounded theory methods, chapter 19 | 12 pages, the interpretive approach ii: ethnographic research methods, chapter 20 | 11 pages, the critical approach: feminist and empowerment research, chapter 21 | 16 pages, analysis methods for qualitative data, chapter 22 | 24 pages, analyzing texts, documents, and artifacts, part 4 preparing and presenting research findings, chapter 23 | 15 pages, organizing information in tables, charts, and graphs, chapter 24 | 20 pages, organizing and writing a research report, chapter 25 | 19 pages, introduction to statistical software.
- Privacy Policy
- Terms & Conditions
- Cookie Policy
- Taylor & Francis Online
- Taylor & Francis Group
- Students/Researchers
- Librarians/Institutions
Connect with us
Registered in England & Wales No. 3099067 5 Howick Place | London | SW1P 1WG © 2024 Informa UK Limited

Want to create or adapt books like this? Learn more about how Pressbooks supports open publishing practices.
8 Chapter 10: Methods
Understanding political methodology requires us to return to a few key concepts from previous chapters. The basics of social science inquiry is to explain causation—what causes what—in political, social, or economic phenomena.
There are two variables in this causal relationship: the dependent and independent variables. The dependent variable is the outcome we seek to isolate and study in order to determine what caused it. Independent variables are the potential causes of the dependent variable in question. Once we determine the dependent variable as the focus of the study and a number of independent variables that could potentially be the cause, we need tools, or methods, to observe and draw conclusions. Key to this inquiry is determining the right methods that best explain the phenomenon in question. Once we establish the methods then we can begin the process of data collection, observation, analysis, and inference.
A fundamental divide in methods for political science is the distinction between quantitative and qualitative methods. Quantitative methods principally combines statistics, mathematics, and formal theory as tools for positive research in political science. It is a data-driven approach in which collection, analysis, interpretation, and presentation of numerical data provides inferences and insights into key political questions. Positive research, as previously mentioned, seeks to describe and explain what is, and is in contrast with normative research that seeks prescriptions of what ought to be. Qualitative methods entail a set of tools for explaining political phenomena that are not numerical or statistical and does not seek to count or measure data. Instead, a qualitative approach uses description and observation of non-numerical data to draw inferences. Not all data can be quantified in a way that is useful, particularly human-related data such as behavior or belief, and qualitative methods help us fill the gap. As a sub-field in political science, political methodology is principally the study of how methods are used in the discipline. It is a practical, hands on sub-discipline that gives students direct access to the tools of political inquiry.
Let’s review a few key concepts and approaches in political methodology. First, we will consider some terms and approaches in quantitative methods. Second, we will look at some core principles and dominant approaches to qualitative methods. Lastly, we will discuss the basics of developing a research project that will serve as a template for students to create their own research agenda.
Correlations
Statistical correlations are the most common tool in quantitative methods. Correlations measure the relationship between two variables. A positive correlation implies a relationship in which an increase or decrease in numerical value of one variable corresponds to a similar increase or decrease in the other variable. As an example, let’s look at the relationship between wealth and voting participation: several studies have found a positive correlation between these variables such that higher levels of wealth correspond to a higher likelihood of voting. [1] Moreover, lower levels of wealth tend to correspond to a lesser likelihood of voting. A negative correlation implies a relationship in which one variable increases when the other variable decreases, or vice versa. Let’s consider the variable of voter turnout—what are some variables that can be negatively correlated to voter turnout? We may think of a number of variables that could be tested, such as bad weather, a more stringent registration process, high levels of poverty, or low levels of education. We can test these variables and hopefully gain some insight into what drives higher voter turnout and what obstacles there are to voting.
A correlation, it has often be said, does not necessarily imply causation, but correlations are an indication that there may be causation or some meaningful relationship that can provide insight into political inquiry. Suppose we just collected and analyzed data, maybe for years, gathering mountains of information. Assume further that we organize this information and present it in an accessible and attractive way. What’s missing in this research project? Data can be collected, organized, analyzed, and presented, but at the end of the day the political scientist must ask, “okay, what does all this mean ?” What conclusions can be drawn from the analysis of data? What questions remain? The methodological work of a political scientist is not done once a statistical regression is run and a correlation between two variables is determined. An important next step is the task of inference—drawing conclusions based on the correlation and perhaps other observations and correlations as well. Drawing inferences is an essential scientific activity that directly probes the meaning of data and analysis.
Let’s return to the example of a positive correlation between wealth and voting participation. What does this really mean? We may logically infer one thing it does not mean: that voting makes you more wealthy. Voter turnout is the dependent variable in this analysis—an outcome for which we seek causal explanation. It may be that individuals who are wealthy are more likely to volunteer, participate in other civic and political endeavors, run for office, and the like. In this case, wealth may not be such a powerful explanation for voter turnout, but rather a variable that increases the likelihood of many different forms of political participation. On the other hand, wealth may be a more direct cause of voter turnout: the correlation between these two variables may be noticeably higher than between wealth and volunteerism or wealth and running for office. Additionally, we may draw an inference that voting participation increases with wealth because individuals may feel as though they have a larger stake in the political process or are at risk of paying more taxes, etc. This inference suggests a tighter link between wealth and voter participation.
Here is an example of a correlation represented with a scatter plot:
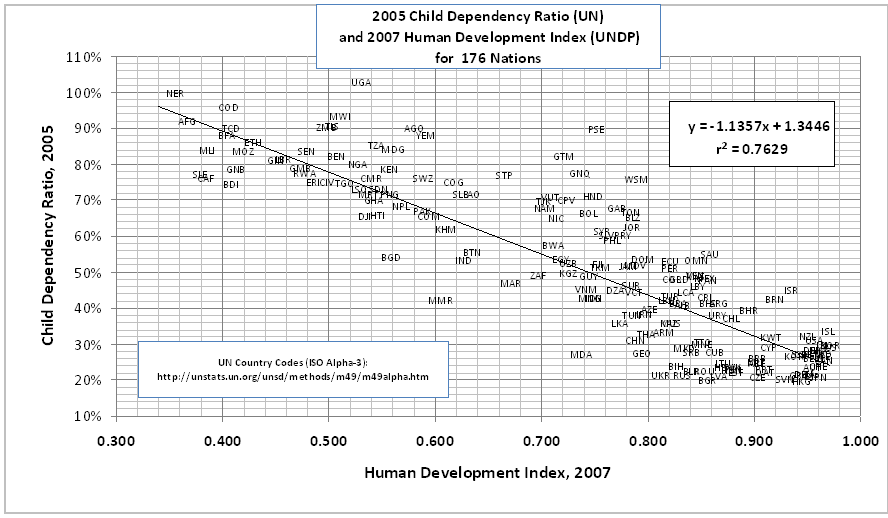
This scatter plot shows the correlation between child-dependency ratio and the UN Human Development Index. A child-dependency ratio is derived by taking the number of dependents (14 years of age and younger and 65 years of age and older) and dividing it by the total population. The N in this statistic is 176: the number of nations in the study. What this statistic suggests is that there is a negative correlation between these values—higher child-dependency ratios correspond to lower human development.
Key Terms in Mathematical Modeling
Doing the work of political science often involves statistics to gather, observe, and organize data, and so it is necessary to understand some basic elements of statistical work. Typically, one begins with a population , the universe of event numbers associated with your study. Out of this population, a researcher can derive a sample that can be observed. Random samples have the advantage of being free from any presumptions a researcher might have and are thus likely to be unbiased. The overall number in a sample is referred to as N. If you survey a random sample of 1,500 people asking them whether they approve or disapprove of a particular politician, the N in this survey is 1,500. A statistic, a numerical measure that describes some property of the population, can be pulled from this sample and analyzed. This statistic will include some form of numerical, or quantitative, data.
There are broadly two types of quantitative data: discrete data, which are typically integers which cannot be divided further or be made more precise, and continuous data, which can be divided into smaller and more precise measurements. An example of discreet data would be the number of representatives in Congress who voted for a particular bill. This will be a whole number that cannot be divided—you cannot have a half or quarter of a representative who voted, the number may be 212 or 213, but cannot be 212.5. An example of continuous data would be the average number of representatives in Congress who voted for appropriations bills over a 10-year period of time. This number could be 212 or 213, but it could also be 212.5 or 212.275.
Data can also be derived from surveys or experiments. Surveys derive data from responses by a group of participants. This group is a sample from the overall population. Survey results can be generalized to the larger population but they are less than precise in predicting causation. Experiments are controlled observations of a particular phenomena and provide experimental data that is not easily generalized but can more precisely predict causation. In political science, conducting experiments can sometimes be impossible, whereas researchers often rely on surveys. The result is that causation is harder to predict in political science, as well as the other social sciences, compared to the natural or so-called hard sciences, where experiments are much more common.
A particular statistic may give us a probability—the likelihood of an event or outcome happening. Further, we may get a probability distribution, which indicates a scale of possible outcomes based on the likelihood of occurring. Probability distributions may be discrete (only certain values, such as whole numbers) or continuous (a range of possible values), along the lines described above. The distribution of data across a scale will provide a mean, median, and mode. A mean is a measure of central tendency, the average of the numbers on the scale, which can be achieved by adding up the value of all the numbers and dividing by how many numbers there are. The median is not an average but the central value on a scale. The mode is the value that occurs most frequently in the scale. If your data scale is the following: 2, 4, 5, 9, and 9, then the mean would be (2+4+5+9+9=29/5=) 5.8, whereas the median would be the value in the middle of this scale (5), and the mode would be 9, the most frequently occurring number.
Lastly, we may present data in a number of ways that will be helpful for analysis and drawing inferences. A bar and whisker plot is a representation of groups of numerical data based on quartiles. The box in a box and whisker plot is the area of the inner two quartiles, whereas the whiskers (lines extended out from the boxes) are the highest and lowest quartiles respectively. A bar chart will show the frequency in each value by the height of a bar that represents that value and typically shows the relationship between two variables. A histogram will represent the frequency of values in intervals or “bins” which should be adjacent to one another but do not have to be equal. Histograms typically represent only one variable. A pie chart is a circular graph that shows portions of the total with wedges that represent the size of that proportion. A pareto chart contains both bars and a line graph, the bars representing descending frequency for each value and the line graph representing the cumulative total of frequencies. Finally, a scatter plot locates values (represented as points) along a plot typically determined by two variables, one along the X axis and the other along the Y axis, and can contain a third variable if the points are coded (by color or size, for example).
Qualitative methods
As previously mentioned, not all data can be numeric. Typically, human-related data that is subjective cannot be meaningfully quantified but may nonetheless be important to your research. The meaning of why or the description of how may be essential for answering your research, particularly why and how questions related to the human experience. Quantitative approaches can only count and measure, not give us the why or the how. Qualitative methods seeks to fill in the gap by providing a set of tools that allows for data collection, analysis, organization, and presentation. The typical qualitative approach is the case study—a focused, in-depth account of a single individual, group, organization, action, or event. Researchers who seek more context, depth, and detail of a single case are best suited to the qualitative method, where the absence of large amounts of numerical data make quantitative data collection and analysis impossible. Case studies in themselves are not confined to qualitative data, however, and may employ a mix of both qualitative and quantitative methods and data. A qualitative case study will provide a “thick description” of the case, focusing on the why and how of various phenomena that occur. [2]
In selecting a case, typical or average cases often do not reveal rich detail of information or are meaningful in their context and characteristics. Unique or outlier cases often prove more interested to explain. Because of this, random-sampling of cases, while useful to the quantitative method, are less useful in the qualitative approach. Cases may be selected based on the inherent and unique characteristics of the case, the context that surrounds it, or because the researcher has the prior depth of knowledge of the characteristics or culture of the case that would allow them to immerse themselves in the environment and provide descriptions or accounts that are meaningful. A qualitative case study is therefore less generalizable than quantitative research—if you are providing a thick description of a single, unique case, it makes sense that this case will not tell you very much about other cases. In contrast, quantitative research that includes large amounts of numerical data affords researchers better opportunities to generalize and make claims across cases.
Qualitative research can collect data in a variety of ways, such as interviews, storytelling, analysis of narratives, participant observations, or focus groups, among others. Interviews are a common form of qualitative data collecting in which a researcher asks questions to subjects that are important to the case. Interviews may be highly structured, in which questions are determined beforehand and there is no deviation from the list of questions, or unstructured, in which the researcher and subject engage in open-ended dialog. Narratives and storytelling can be important to understanding a particular culture or community, since stories can form a kind of discursive foundation on which common knowledge is shared and common action is determined. Participant observations can be a good way for a researcher to collect data through simply observing a group interact with one another. Such observations can be passive in the sense that the researcher attempts to remove themselves from the dynamic as much as possible so as not to influence the outcomes, or it can be active, in which a researcher is part of the group interactions and makes observations from within the context of the dynamic. Finally, focus groups allow for more controlled observations of specific interactions and allow a researcher to gather more contextualized data (such as reactions, agreement, or disagreement) than would be possible in isolated interviews.
Field research is a broad term we use to describe data collection and observation on the ground, removed from the academic setting. It is in your field research that you would conduct interviews, focus groups, or participant observations. As discussed in the comparative politics context in Chapter 7, researchers should determine which case is best to study given practical considerations on the ground, the most appropriate form of data collection (interviews, etc.), how long the field research should be conducted (short stays may be more directed, long stays may yield more data), and what sort of resources and skills would be necessary to conduct the research successfully.
Research Design
Designing a research project can be daunting, but it is also an exciting, hands-on way for students to learn more about issues they care about, understand the work of political science and its relevance, and gain insight into how political action and change might make a better world. Outlined below are the basic elements required to begin a research project, a brief description of each of those elements, and a rubric for each element that can give teachers and students a guide as to how a research project assignment may be evaluated. Keep in mind, this outline is not the research itself, only a template. No data will actually be gathered, analyzed, and assessed, and no inferences are drawn.
- Research question (RQ).
- Identify your dependent variable (DV), ie, the focus of your study.
- Potential answers (IVs) to the RQ, ie, the explanation for your DV outcome.
- Why does this question matter (SFW)? What relevance does this have? Why is it important?
- Choose method of data collection and analysis: quantitative (QN), qualitative (QL) or both (BQ)
- Determine form of method for data collection and the ideal data (D). For QN, identify specific statistics and different representations of variables (scatter plot, pie chart, bar graph, etc). You do not actually have to find this data or compile it, so its best to think of this as the ideal data possible for you to answer your question. In the best possible world, what numerical data would I need to best answer the RQ? For QR, determine a unique or outlier case that makes for interesting study. Determine the basic framework of your field research (short or long stay, resources and skills needed, etc.), and identify at least two forms of data collection (interviews, participant observations, etc).
- Identify which political science sub-field is the best fit for this research project.
- An annotated bibliography (BIB) of at least 6 scholarly sources (books or articles, including online sources) that provide some overview or analysis of your topic and can serve as sources for a literary review or extensive background information. This BIB is not a list of your ideal data, but rather scholarly or reputable sources that pertain to the issues surrounding your RQ.
Political methodology is the tool box we use to put theory (ideas about our political world) into practice. Methods allow us test theories, ideas, and assumptions we have, refining our understanding of politics and drawing out meaningful insights and inferences. The vast majority of political inquiry is an inquiry into causation on one level or another, and so research in political science requires a structure that can explain the causes of political phenomena. The first step is designing a research question—developing a starting point of inquiry that is centered on change or variation of some kind. What explains this particular change we see? Why do we get x and not y? Why are two seemingly similar cases produced different outcomes? The explanations or causes are independent variables in social science inquiry, and the dependent variable is the outcome of this change. Typical research in political science will center their study on the dependent variable and seek to explain how this outcome came about by identifying and analyzing independent variables that have potentially caused this outcome. Methods are the tools used to collect and analyze data, scrutinize the independent variables in question, and draw inferences that best explain causes of the dependent variable in question.
Broadly, there are two approaches in political methodology, quantitative and qualitative. Quantitative research typically entails large amounts of numerical data that require mathematical modeling—statistics—to analyze the variables in question. Correlations are statistical indicators that measure the mutual dependence or association between two variables and are commonly used in political science research. These correlations may indicate causation, but not necessarily—the researcher must draw inferences and analyze the strength of the association in order to make claims of causation. Qualitative research entails the collection of non-numerical data, often human-related experiences that are difficult to quantify. Such qualitative data can include interviews, participant observations, and focus groups conducted in field research. Both quantitative and qualitative research should be driven by a research question—a precise, non-banal question that directly centers on explaining some kind of political phenomena we observe in the world.
Media Attributions
- Plot-of-Human-Development-Index-2007-and-Child-Dependency-Ratios-2005-for-176-countries © Fm122 is licensed under a CC BY-SA (Attribution ShareAlike) license
- CNH_Figure_2 © Conhegarty is licensed under a Public Domain license
- 1920px-Yale_climate_US_public_opinion_2018_bar_chart © Yale Program on Climate Change Communication is licensed under a All Rights Reserved license
- Labeled_Box_and_Whisker_Plot © KStrileckis
- Histogram_of_Palestinian_rocket_attacks_on_Israel_per_day,_2014 © Kozrty is licensed under a CC BY-SA (Attribution ShareAlike) license
- RootCauseParetoChart © KellyLawless is licensed under a CC BY-SA (Attribution ShareAlike) license
- World Economic Forum, "Link Between Voting in Elections and Income." 2018: https://www.weforum.org/agenda/2018/07/low-voter-turnout-increasing-household-income-may-help (accessed on July 28, 2019). ↵
- The phrase "thick description" comes from Clifford Geertz, "Thick Description: Towards an Interpretive Theory of Culture," in The Interpretation of Cultures. Basic Books: 1973 ↵
In statistics, a population is a universe of event numbers under study.
Politics, Power, and Purpose: An Orientation to Political Science Copyright © 2019 by Jay Steinmetz is licensed under a Creative Commons Attribution 4.0 International License , except where otherwise noted.
Share This Book
- A-Z Publications
Annual Review of Political Science
Volume 20, 2017, review article, qualitative methods.
- John Gerring 1
- View Affiliations Hide Affiliations Affiliations: Department of Government, University of Texas, Austin, Texas 78712; email: [email protected]
- Vol. 20:15-36 (Volume publication date May 2017) https://doi.org/10.1146/annurev-polisci-092415-024158
- First published as a Review in Advance on January 11, 2017
- © Annual Reviews
One might argue that political science has gone further than any other social science in developing a rigorous field of study devoted to qualitative methods. This review article begins by discussing the time-honored qualitative/quantitative distinction. What is qualitative data and analysis, and how does it differ from quantitative data and analysis? I propose a narrow definition of “qualitative” and explore its implications. I also explore in a speculative vein some of the factors underlying the ongoing Methodenstreit between scholars who identify with quantitative and qualitative approaches to social science. In the remainder of the article I discuss areas of qualitative research that have been especially fecund over the past decade. These include case selection, causal inference, and multimethod research.
Article metrics loading...
Full text loading...
Literature Cited
- Ahmed A , Sil R . 2012 . When multi-method research subverts methodological pluralism—or, why we still need single-method research. Perspect. Polit. 10 : 4 935– 53 [Google Scholar]
- Alesina A , Glaeser E , Sacerdote B . 2001 . Why doesn't the US have a European-style welfare state?. Brookings Pap. Econ. Act. 2 : 187– 277 [Google Scholar]
- Beach D , Pedersen RM . 2013 . Process-Tracing Methods: Foundations and Guidelines Ann Arbor: Univ. Mich. Press [Google Scholar]
- Beck N . 2006 . Is causal-process observation an oxymoron?. Polit. Anal. 14 : 3 347– 52 [Google Scholar]
- Beck N . 2010 . Causal process “observations”: oxymoron or (fine) old wine. Polit. Anal. 18 : 4 499– 505 [Google Scholar]
- Bennett A . 2008 . Process tracing: a Bayesian approach. See Box-Steffensmeier et al. 2008 702– 21
- Bennett A . 2015 . Disciplining our conjectures: systematizing process tracing with Bayesian analysis. See Bennett & Checkel 2015 276– 98
- Bennett A , Checkel JT . 2015 . Process Tracing: From Metaphor to Analytic Tool Cambridge, UK: Cambridge Univ. Press [Google Scholar]
- Bennett A , Elman C . 2006a . Complex causal relations and case study methods: the example of path dependence. Polit. Anal. 14 : 3 250– 67 [Google Scholar]
- Bennett A , Elman C . 2006b . Qualitative research: recent developments in case study methods. Annu. Rev. Polit. Sci. 9 : 455– 76 [Google Scholar]
- Blatter J , Haverland M . 2012 . Designing Case Studies: Explanatory Approaches in Small-N Research Basingstoke, UK: Palgrave Macmillan [Google Scholar]
- Boas TC . 2007 . Conceptualizing continuity and change: the composite-standard model of path dependence. J. Theor. Polit. 19 : 1 33– 54 [Google Scholar]
- Boix C . 1999 . Setting the rules of the game: the choice of electoral systems in advanced democracies. Am. Polit. Sci. Rev. 93 : 3 609– 24 [Google Scholar]
- Box-Steffensmeier J , Brady H , Collier D . 2008 . Oxford Handbook of Political Methodology Oxford, UK: Oxford Univ. Press [Google Scholar]
- Brady HE . 2010 . Data-set observations versus causal-process observations: the 2000 U.S. presidential election. See Brady & Collier 2010 237– 42
- Brady HE , Collier D . 2004 . Rethinking Social Inquiry: Diverse Tools, Shared Standards Lanham, MD: Rowman & Littlefield [Google Scholar]
- Brady HE , Collier D . 2010 . Rethinking Social Inquiry: Diverse Tools, Shared Standards Lanham, MD: Rowan & Littlefield, 2nd ed.. [Google Scholar]
- Brewer J , Hunter A . 2006 . Foundations of Multimethod Research: Synthesizing Styles Thousand Oaks, CA: Sage [Google Scholar]
- Caporaso J . 2009 . Is there a quantitative-qualitative divide in comparative politics. ? In The SAGE Handbook of Comparative Politics T Landman, N Robinson 67– 83 Thousand Oaks, CA: Sage [Google Scholar]
- Chattopadhyay R , Duflo E . 2004 . Women as policy makers: evidence from a randomized policy experiment in India. Econometrica 72 : 5 1409– 43 [Google Scholar]
- Collier D . 2011 . Understanding process tracing. PS Polit. Sci. Polit. 44 : 4 823– 30 [Google Scholar]
- Collier D , Elman C . 2008 . Qualitative and Multimethod Research: Organizations, Publications, and Reflections on Integration See Box-Steffensmeier et al. 2008 779– 95 [Google Scholar]
- Collier D , Gerring J . 2009 . Concepts and Method in Social Science: The Tradition of Giovanni Sartori New York: Routledge [Google Scholar]
- Collier D , LaPorte J , Seawright J . 2012 . Putting typologies to work: concept formation, measurement, and analytic rigor. Polit. Res. Q. 65 : 1 217– 32 [Google Scholar]
- Crandell JL , Voils CI , Chang YK , Sandelowski M . 2011 . Bayesian data augmentation methods for the synthesis of qualitative and quantitative research findings. Qual. Quant. 45 : 653– 69 [Google Scholar]
- Dunning T . 2012 . Natural Experiments in the Social Sciences: A Design-Based Approach Cambridge, UK: Cambridge Univ. Press [Google Scholar]
- Eckstein H . 1975 . Case studies and theory in political science. Handbook of Political Science. Political Science: Scope and Theory 7 FI Greenstein, NW Polsby 94– 137 Reading, MA: Addison-Wesley [Google Scholar]
- Elman C . 2005 . Explanatory typologies in qualitative studies of international politics. Int. Organ. 59 : 2 293– 326 [Google Scholar]
- Elman C , Kapiszewski D . 2014 . Data access and research transparency in the qualitative tradition. PS Polit. Sci. Polit. 47 : 1 43– 47 [Google Scholar]
- Elman C , Kapiszewski D , Vinuela L . 2010 . Qualitative data archiving: rewards and challenges. PS Polit. Sci. Polit. 43 : 1 23– 27 [Google Scholar]
- Epstein LD . 1964 . A comparative study of Canadian parties. Am. Polit. Sci. Rev. 58 : 46– 59 [Google Scholar]
- Fairfield T . 2013 . Going where the money is: strategies for taxing economic elites in unequal democracies. World Dev. 47 : 42– 57 [Google Scholar]
- Fairfield T . 2015 . Private Wealth and Public Revenue in Latin America: Business Power and Tax Politics Cambridge, UK: Cambridge Univ. Press [Google Scholar]
- Fenno RF Jr . 1977 . U.S. House members in their constituencies: an exploration. Am. Polit. Sci. Rev. 71 : 3 883– 917 [Google Scholar]
- Fenno RF Jr . 1978 . Home Style: House Members in Their Districts Boston, MA: Little, Brown [Google Scholar]
- Ferwerda J , Miller N . 2014 . Political devolution and resistance to foreign rule: a natural experiment. Am. Polit. Sci. Rev. 108 : 3 642– 60 [Google Scholar]
- Feyerabend P . 1975 . Against Method London: New Left Books [Google Scholar]
- Friedman M , Schwartz A . 1963 . A Monetary History of the United States, 1867–1960 Princeton, NJ: Princeton Univ. Press [Google Scholar]
- Garfinkel H . 1967 . Studies in Ethnomethodology Englewood Cliffs, NJ: Prentice-Hall [Google Scholar]
- George AL . 1979 . Case studies and theory development: the method of structured, focused comparison. Diplomacy: New Approaches in History, Theory, and Policy PG Lauren 3– 68 New York: Free Press [Google Scholar]
- George AL , Bennett A . 2005 . Case Studies and Theory Development Cambridge, MA: MIT Press [Google Scholar]
- George AL , McKeown TJ . 1985 . Case studies and theories of organizational decision-making. Advances in Information Processing in Organizations RF Coulam, RA Smith 21– 58 Greenwich, CT: JAI Press [Google Scholar]
- Gerring J . 2007 . Case Study Research: Principles and Practices Cambridge, UK: Cambridge Univ. Press [Google Scholar]
- Gerring J . 2012 . Mere description. Br. J. Polit. Sci. 42 : 4 721– 46 [Google Scholar]
- Gerring J . 2017 . Case Study Research: Principles and Practices Cambridge, UK: Cambridge Univ. Press, 2nd ed.. [Google Scholar]
- Gerring J , Cojocaru L . 2016 . Selecting cases for intensive analysis: a diversity of goals and methods. Sociol. Methods Res. 45 : 3 392– 423 [Google Scholar]
- Gerring J , McDermott R . 2007 . An experimental template for case-study research. Am. J. Polit. Sci. 51 : 3 688– 701 [Google Scholar]
- Gill CJ , Sabin L , Schmid CH . 2005 . Why clinicians are natural Bayesians. BMJ 330 : 1080– 83 [Google Scholar]
- Glassner B , Moreno JD . 1989 . The Qualitative-Quantitative Distinction in the Social Sciences Dordrecht, Neth.: Springer [Google Scholar]
- Goertz G . 2005 . Social Science Concepts: A User's Guide Princeton, NJ: Princeton Univ. Press [Google Scholar]
- Goertz G . 2017 . Multimethod Research, Causal Mechanisms, and Selecting Cases: The Research Triad Princeton, NJ: Princeton Univ. Press [Google Scholar]
- Goertz G , Mahoney J . 2012 . A Tale of Two Cultures: Qualitative and Quantitative Research in the Social Sciences Princeton, NJ: Princeton Univ. Press [Google Scholar]
- Grimmer J , Stewart BM . 2013 . Text as data: the promise and pitfalls of automatic content analysis methods for political texts. Polit. Anal. 21 : 3 267– 97 [Google Scholar]
- Hall PA . 2003 . Aligning ontology and methodology in comparative politics. Comparative Historical Analysis in the Social Sciences J Mahoney, D Rueschemeyer 373– 404 Cambridge, UK: Cambridge Univ. Press [Google Scholar]
- Hall PA . 2006 . Systematic process analysis: when and how to use it. Eur. Manag. Rev. 3 : 24– 31 [Google Scholar]
- Hammersley M . 1992 . Deconstructing the qualitative-quantitative divide. Mixing Methods: Qualitative and Quantitative Research J Brannen Aldershot, UK: Avebury [Google Scholar]
- Harrits GS . 2011 . More than method? A discussion of paradigm differences within mixed methods research. J. Mixed Methods Res. 5 : 2 150– 66 [Google Scholar]
- Herron MC , Quinn KM . 2016 . A careful look at modern case selection methods. Sociol. Methods Res. 45 : 3 458– 92 [Google Scholar]
- Humphreys M , Jacobs AM . 2015 . Mixing methods: a Bayesian approach. Am. Polit. Sci. Rev. 109 : 4 653– 73 [Google Scholar]
- Humphreys M , Jacobs AM . 2018 . Integrated Inferences: A Bayesian Integration of Qualitative and Quantitative Approaches to Causal Inference Cambridge, UK: Cambridge Univ. Press. In press [Google Scholar]
- Jacobs A . 2015 . Process tracing the effects of ideas. See Bennett & Checkel 2015 41– 73
- Kapiszewski D , MacLean LM , Read BL . 2015 . Field Research in Political Science: Practices and Principles Cambridge, UK: Cambridge Univ. Press [Google Scholar]
- Karl TL . 1997 . The Paradox of Plenty: Oil Booms and Petro-States Berkeley: Univ. Calif. Press [Google Scholar]
- King G , Keohane RO , Verba S . 1994 . Designing Social Inquiry: Scientific Inference in Qualitative Research Princeton, NJ: Princeton Univ. Press [Google Scholar]
- Kocher M , Monteiro N . 2015 . What's in a line? Natural experiments and the line of demarcation in WWII occupied France Work. Pap., Dep. Polit. Sci., Yale Univ. [Google Scholar]
- Kreuzer M . 2010 . Historical knowledge and quantitative analysis: the case of the origins of proportional representation. Am. Polit. Sci. Rev. 104 : 369– 92 [Google Scholar]
- Levy JS . 2007 . Qualitative methods and cross-method dialogue in political science. Comp. Polit. Stud. 40 : 2 196– 214 [Google Scholar]
- Levy JS . 2008 . Case studies: types, designs, and logics of inference. Confl. Manag. Peace Sci. 25 : 1– 18 [Google Scholar]
- Lieberman ES . 2005 . Nested analysis as a mixed-method strategy for comparative research. Am. Polit. Sci. Rev. 99 : 3 435– 52 [Google Scholar]
- Lieberman ES . 2010 . Bridging the qualitative-quantitative divide: best practices in the development of historically oriented replication databases. Annu. Rev. Polit. Sci. 13 : 37– 59 [Google Scholar]
- Lieberman ES . 2016 . Can the biomedical research cycle be a model for political science?. Perspect. Polit. 14 1054– 66 [Google Scholar]
- Lijphart A . 1971 . Comparative politics and the comparative method. Am. Polit. Sci. Rev. 65 : 682– 93 [Google Scholar]
- Lohmann S . 2007 . The trouble with multi-methodism. Newsl. APSA Organ. Sect. Qual. Methods 5 : 1 13– 17 [Google Scholar]
- Lynd RS , Lynd HM . 1956 (1929) . Middletown: A Study in American Culture. New York: Harcourt Brace [Google Scholar]
- Mahoney J . 2010 . After KKV: the new methodology of qualitative research. World Polit. 62 : 1 120– 47 [Google Scholar]
- Mahoney J . 2012 . The logic of process tracing tests in the social sciences. Sociol. Methods Res. 41 : 4 566– 90 [Google Scholar]
- Mahoney J , Goertz G . 2006 . A tale of two cultures: contrasting quantitative and qualitative research. Polit. Anal. 14 : 227– 49 [Google Scholar]
- Mahoney J , Sweet Vanderpoel R . 2015 . Set diagrams and qualitative research. Comp. Polit. Stud. 48 : 1 65– 100 [Google Scholar]
- Mahoney J , Thelen K . 2015 . Advances in Comparative-Historical Analysis Cambridge, UK: Cambridge Univ. Press [Google Scholar]
- Mansfield ED , Snyder J . 2005 . Electing to Fight: Why Emerging Democracies Go to War Cambridge, MA: MIT Press [Google Scholar]
- McKeown TJ . 1999 . Case studies and the statistical world view. Int. Organ. 53 : 161– 90 [Google Scholar]
- McLaughlin E . 1991 . Oppositional poverty: the quantitative/qualitative divide and other dichotomies. Sociol. Rev. 39 : 292– 308 [Google Scholar]
- Mill JS . 1843/1872 . A System of Logic. London: Longmans, Green, 8th ed.. [Google Scholar]
- Moore B Jr. . 1966 . Social Origins of Dictatorship and Democracy: Lord and Peasant in the Making of the Modern World. Boston, MA: Beacon Press [Google Scholar]
- Morgan M . 2012 . Case studies: one observation or many? Justification or discovery?. Philos. Sci. 79 : 5 655– 66 [Google Scholar]
- Page SE . 2006 . Essay: path dependence. Q. J. Polit. Sci. 1 : 87– 115 [Google Scholar]
- Paluck EL . 2010 . The promising integration of qualitative methods and field experiments. Ann. Am. Acad. Polit. Soc. Sci. 628 : 59– 71 [Google Scholar]
- Patton MQ . 2002 . Qualitative Research and Evaluation Methods Thousand Oaks, CA: Sage [Google Scholar]
- Pincus S . 2011 . 1688: The First Modern Revolution New Haven, CT: Yale Univ. Press [Google Scholar]
- Platt J . 1992 . “Case study” in American methodological thought. Curr. Sociol. 40 : 1 17– 48 [Google Scholar]
- Posner D . 2004 . The political salience of cultural difference: why Chewas and Tumbukas are allies in Zambia and adversaries in Malawi. Am. Polit. Sci. Rev. 98 : 4 529– 46 [Google Scholar]
- Ray JL . 1993 . Wars between democracies: rare or nonexistent?. Int. Interact. 18 : 251– 76 [Google Scholar]
- Reichenbach H . 1938 . Experience and Prediction: An Analysis of the Foundations and the Structure of Knowledge Chicago: Univ. Chicago Press [Google Scholar]
- Reiss J . 2009 . Causation in the social sciences: evidence, inference, and purpose. Philos. Soc. Sci. 39 : 1 20– 40 [Google Scholar]
- Rihoux B . 2013 . Qualitative Comparative Analysis (QCA), anno 2013: reframing the comparative method's seminal statements. Swiss Polit. Sci. Rev. 19 : 2 233– 45 [Google Scholar]
- Roberts C . 1996 . The Logic of Historical Explanation University Park: Pa. State Univ. Press [Google Scholar]
- Rohlfing I . 2012 . Case Studies and Causal Inference: An Integrative Framework London: Palgrave Macmillan [Google Scholar]
- Romer CD , Romer DH . 2010 . The macroeconomic effects of tax changes: estimates based on a new measure of fiscal shocks. Am. Econ. Rev. 100 : 763– 801 [Google Scholar]
- Rosenau PM . 1992 . Post-Modernism and the Social Sciences: Insights, Inroads, and Intrusions Princeton, NJ: Princeton Univ. Press [Google Scholar]
- Schatz E . 2009 . Political Ethnography: What Immersion Contributes to the Study of Power Chicago: Univ. Chicago Press [Google Scholar]
- Schimmelfennig F . 2015 . Efficient process tracing: analyzing the causal mechanisms of European integration. See Bennett & Checkel 2015 98– 125
- Schwartz H , Jacobs J . 1979 . Qualitative Sociology: A Method to the Madness New York: Free Press [Google Scholar]
- Seawright J . 2016a . The case for selecting cases that are deviant or extreme on the independent variable. Sociol. Methods Res. 45 : 3 493– 525 [Google Scholar]
- Seawright J . 2016b . Multi-Method Social Science: Combining Qualitative and Quantitative Tools Cambridge, UK: Cambridge Univ. Press [Google Scholar]
- Seawright J , Gerring J . 2008 . Case-selection techniques in case study research: a menu of qualitative and quantitative options. Polit. Res. Q. 61 : 2 294– 308 [Google Scholar]
- Shapiro I , Smith R , Masoud T . 2004 . Problems and Methods in the Study of Politics Cambridge, UK: Cambridge Univ. Press [Google Scholar]
- Shweder RA . 1996 . Quanta and qualia : What is the “object” of ethnographic method?. Ethnography and Human Development: Context and Meaning in Social Inquiry R Jessor, A Colby, RA Shweder 175– 82 Chicago: Univ. Chicago Press [Google Scholar]
- Sil R . 2000 . The division of labor in social science research: unified methodology or “organic solidarity”?. Polity 32 : 4 499– 531 [Google Scholar]
- Skocpol T . 1979 . States and Social Revolutions: A Comparative Analysis of France, Russia, and China Cambridge, UK: Cambridge Univ. Press [Google Scholar]
- Skocpol T , Somers M . 1980 . The uses of comparative history in macrosocial inquiry. Comp. Stud. Soc. Hist. 22 : 2 147– 97 [Google Scholar]
- Snow CP . 1993 (1959) . The Two Cultures Cambridge, UK: Cambridge Univ. Press [Google Scholar]
- Strauss A , Corbin J . 1998 . Basics of Qualitative Research: Techniques and Procedures for Developing Grounded Theory Thousand Oaks, CA: Sage [Google Scholar]
- Van Evera S . 1997 . Guide to Methods for Students of Political Science Ithaca, NY: Cornell Univ. Press [Google Scholar]
- Waldner D . 2012 . Process tracing and causal mechanisms. Oxford Handbook of Philosophy of Social Science H Kincaid 65– 84 Oxford, UK: Oxford Univ. Press [Google Scholar]
- Waldner D . 2015a . Process tracing and qualitative causal inference. Secur. Stud. 24 : 2 239– 50 [Google Scholar]
- Waldner D . 2015b . What makes process tracing good? Causal mechanisms, causal inference, and the completeness standard in comparative politics. See Bennett & Checkel 2015 126– 52
- Walter B . 2002 . Committing to Peace: The Successful Settlement of Civil Wars Princeton, NJ: Princeton Univ. Press [Google Scholar]
Data & Media loading...
- Article Type: Review Article
Most Read This Month
Most cited most cited rss feed, framing theory, discursive institutionalism: the explanatory power of ideas and discourse, historical institutionalism in comparative politics, the origins and consequences of affective polarization in the united states, political trust and trustworthiness, public attitudes toward immigration, what have we learned about the causes of corruption from ten years of cross-national empirical research, what do we know about democratization after twenty years, economic determinants of electoral outcomes, public deliberation, discursive participation, and citizen engagement: a review of the empirical literature.

Political Science
- Find Background Information
- Find Scholarly Sources
- Find News & Current Events
- Find Attitudes & Opinions
- Find Data & Statistics
- Find Law & Legal Resources This link opens in a new window
- Research Policy
- Find Government Documents
- Find Grey Literature
- Research Methods
- Cite Sources
- Research tutorials
Books on Research Methods in Political Science

- << Previous: Find Grey Literature
- Next: Cite Sources >>
- Last Updated: Jul 19, 2024 12:03 PM
- URL: https://guides.library.uwm.edu/PolSci

- Comprehensive Exams
- American Politics
- Political Theory
- International Relations
Research Methods and Formal Theory
- Comparative Politics
Michael Albertus John Brehm Cathy Cohen Michael Dawson Justin Grimmer Mark Hansen William Howell Monika Nalepa Eric Oliver John Padgett Robert Pape John Patty Maggie Penn Dan Slater Paul Staniland Lisa Wedeen
Graduate education in political science trains students to become professional social scientists. An essential aspect of graduate training – indeed, what most distinguishes graduate from undergraduate education in the social sciences – is the development of the research skills that enable students to become productive, original scholars. Formal theory, and quantitative and qualitative research methods provide a curriculum that helps students to develop the needed tools.
Training in research methods includes instruction in statistical methods, but quantitative methods are not exhaustive of the field. Political science has always encompassed a variety of approaches, from formal mathematical analysis to textual language analysis, and faculty and graduate students at Chicago employ a wide range of methodologies. The department offers coursework in both qualitative, and quantitative methodologies. Thus, students who are interested in qualitative methodologies should read on, because there is something here for you.
At the moment, the most developed curriculum in the field employs mathematical methods, which divides into two broad categories: formal theory and quantitative methods. Formal theory includes decision theory, game theory, social choice theory, stochastic processes, network analysis, and other kinds of mathematical modeling. It is logical, mathematical and theoretical: formal modelers construct mathematical representations of political behavior and logically consistent frameworks for evaluating politics. Quantitative methods in political science are a distinct mode of analysis and include elements of statistics, econometrics, and psychometrics. They are inferential, mathematical and empirical: methodologists develop investigative tools to guide theoretical inquiry and test propositions.
Statistical methods are widely used in the study of American and European politics, particularly in public opinion, elections, and party systems. In international relations, there is a large quantitative literature on the causes of war, the effects of regime types on trade, and political determinants of international financial flows. And in policy analysis and evaluation research, statistical methods have found common usage in studies of education, race, poverty, crime, and housing.
Formal theory has found many of its most fruitful applications in political theory, where it is used in the study of ethics, democratic theory, and many other topics. Formal models are also of major importance in international relations, notably in the theory of deterrence and in studies of international cooperation. American and comparative political studies employ formal theory in studies of elections, legislatures, bureaucracies, party systems, and regime transitions, just to name a few.
Students have found strong mathematical skills to be a substantial professional asset. Today, every field of political science is influenced by formal models and statistical methods, and no broad education in the discipline is complete without some understanding of their uses.
The department strongly recommends that all graduate students acquire the skill set necessary for successful progress as producers of research within the first year of coursework prior to beginning research on their M.A. thesis. The notion of a skill set will vary by the specific research interests of the students. The department privileges no particular method. Students will discuss with their advisors the skill set they will need and will agree on a program of study. The DGS will confirm that these conversations have taken place. For example, among those students whose research may involve quantitative approaches, the first year should include Mathematical Foundations of Political Methodology, Linear Models, and Causal Inference.
The normal expectation for first-year quantitatively-oriented graduate students will be that they follow this quantitative track. For students whose research may involve formal theory and mathematical modeling, the first year should include courses in game theory and social choice. For students who intend to pursue political theory and qualitative research, the skill set is less established but may entail language training, ethnography training, interpretive methods, archival research, or other methodological or substantive courses.
The following listing provides an overview of the department’s offerings in formal theory and research methods. Because faculty teaching schedules change, the precise offerings change from year to year, and because every student brings a unique background to the program, no document can cover all the possibilities. We urge students to consult members of the Methods Committee and other faculty advisors for personal advice.
Note: Inclusion on these lists indicates courses of interest to students who desire training in formal modeling, quantitative methods, and qualitative methods. It does not guarantee that the course will satisfy distribution requirements in these fields.
The quantitative methods sequence prepares students to conduct empirical research in political science and provides an introduction to the skills necessary to be a political methodologist. Political Science is an increasingly empirical and quantitative discipline that relies on a wide variety of data sources and strategies for learning about the political world. To engage with the increasingly large methodological literature in political science and across the social sciences requires competency in programming, research design, statistics, and data science.
The quantitative methods training is intended to help students develop core competencies across all four critical areas of data research. It also serves as an introduction to more advanced classes in the department and across the university. Students who complete our core sequence will be well prepared to do quantitative political science research, complete the quantitative methods preliminary exam, and ready to start the more advanced coursework necessary to become political methodologists. Students interested in doing primarily qualitative work or political theory are encouraged to take courses in the quantitative methods sequence. The skills taught in the course will be useful in their own research and empower the students to read (and critique!) empirical political science.
Students interested in taking the quantitative methods exam will be required to take the entire quantitative methods sequence with exceptions made sparingly and only with a formal application to members of the quantitative methods group. That sequence is as follows.
Introductory Math Camp (Offered at End of Summer) A brief (re)introduction to basic mathematical concepts and computing skills.
43401 Mathematical Foundations of Political Methodology Introduction to Mathematical and Probabilistic tools for doing formal and quantitative political science. Students are introduced to the R programming language.
30700 Introduction to Linear Regression Introduction to the linear model, the workhorse tool in quantitative political science research. Students continue development of their R programming skills.
30600 Causal Inference Introduction to the statistics causal inference literature. Topics include: potential outcomes, experimental methods, and research design for observational data.
43100 Maximum Likelihood (Model Based Inference) Analysis of choice-based models, counts, sequences, duration, proportions, and latent variables
43502 Machine Learning Introduction to advanced models for prediction and data compression. Students are introduced and use the Python programming language.
Once students complete the core sequence they are encouraged to take more advanced courses offered within the department and across the university. Please consult the methods group for more information about the courses.
42120 Bayesian Inference in Political Science (staff, currently not offered)
43200 Advanced Maximum Likelihood (Brehm) Coverage varies; topics to be drawn from truncated and censored data, hierarchical models, measurement theory, introduction to Bayesian inference (PQ: PLSC 43100).
43410 Introduction to Multilevel Modeling (staff, currently not offered; see SOCI 30012) Analysis of complex interaction and classification within the clustered data.
Please also see the section below on superb offerings in advanced methods in other departments at the University of Chicago.
Note: PLSC 30500, Introduction to Research Design, is required of all students in their first year, Additionally, the department strongly encourages students to take the Social Sciences Division’s math camp offered in the weeks prior to the Autumn Quarter.
The methods faculty will offer the quantitative methods exam each spring and typically students will take the exam at the end of their second year. Students should declare their intention to take the exam at the start of the second year to the methods faculty member chairing the exam for that year. There will be a meeting in October of each year with graduate students potentially interested in taking the exam to explain the exam further and to address any questions.
Students taking the quantitative methods exam when they plan to either be practicing methodologists or advanced users of recent methodological advances. To that end, students must engage in significant coursework before taking the exam. Within the department, students are expected to complete the five course methods sequence:
- Mathematical Foundations of Political Methodology
- Linear Models
- Causal Inference
- Maximum Likelihood
- Machine Learning
In addition, students are encouraged, but not required, to complete an advanced methodological course in the department (such as Advanced Maximum Likelihood, Bayesian Inference, Multi-level Modeling, Network Analysis) or an equivalent or higher level course offered at another department. We encourage students to consult with the methods group when choosing these additional courses.
A student may petition to waive these requirements, though these petitions will only be granted in extraordinary circumstances.
The methods exam will take place in two parts. The first part is a closed book exam that will test core concepts in statistics. The second is an open book exam that will be completed using a computer and will test data analysis skills. Both exams will take place on the same day. The closed book exam will run from 9am to 12 pm. Students will be given a one-hour break and then will take the open book portion from 1pm to 5pm.
The formal theory sequence prepares students to develop and analyze rigorous analytical social science theories. It provides the basic analytical skills required in formal political theory and political economy. Formal theories serve as the foundation of all empirical political science: precisely and reliably interpreting data and empirical relationships requires a coherent theoretical framework. When properly employed, formal methods ensure the logical coherence of theoretical assumptions and conclusions. Training in the formal theory field within the department is centered on a three-course sequence composed of two quarters of game theory (30901 & 31000) and one quarter of social choice theory (40801). As a whole, these courses cover the basic tools and concepts of formal political theory and prepare students for more advanced classes in the department and across the university.
Introductory Courses
30901 Game Theory I (Nalepa/Patty) Introduction to static and dynamic games of complete information, including the coverage of two basic solution concepts (Nash, SPE) (PQ: PLSC 30100, when offered).
31000 Game Theory II (Nalepa/Patty) Intermediate game theory focusing on games of incomplete information (PQ: PLSC 30901).
40801 Social Choice (Penn) Introduction to axiomatic choice, preference aggregation, and core existence.
Optional Courses
PLSC 40200 Stochastic Models of Social Processes (Padgett) Dynamic, probabilistic models for public opinion, learning, mobility, etc. (PQ: statistics course).
PLSC 35801 Formal Models in Comparative Politics (Nalepa) Newly published or still in press papers in Comparative Politics that employ formal modeling, including models of state-building, authoritarianism, regime change, corruption & clientelism (PQ: PLSC 30901 & 31000).
PPHA 42310 The Political Economy of Development (Robinson) Introduction for Ph.D. students to the research literature in the political economy of development.
ECON 36101 Economic Models of Politics (Myerson & van Weelden) Introduction to current research in political economics.
PLSC 40815 New Directions in Formal Theory (Penn) Survey of recent research in formal political theory. Topics include models of institutions, groups, and behavior, spanning American politics, comparative politics, and international relations. Tools include game theory, network analysis, simulation, axiomatic choice theory, and optimization theory.
Students wishing to take the formal theory exam must complete the three-course sequence composed of 30901, 31000, and 40801 and one additional course in formal political theory or political economy. Any student who has satisfied this requirement can take the field exam in Formal Theory.
The classes listed in this document automatically count for the fourth course requirement. Other courses may count as well. Offerings change annually, so students are advised to ask the formal theory faculty (Nalepa, Patty, and Penn) regarding whether an unlisted course satisfies the requirement and/or suggestions about other courses.
The formal theory exam will consist of a closed book, closed notes exam running from 9am to 5pm on a single day. A typical exam will consist of one question corresponding to each of the three required courses. Passing the exam will require mastery of the material in all three of the required introductory courses.
Qualitative approaches seek to describe, interpret, and/or explain political action and institutions through direct and systematic analysis of specific empirical contexts. The department frequently offers courses that encourage richer study of these areas. There is no comprehensive exam in qualitative methods.
33300 Interpretive Methods in the Social Sciences (Wedeen) Broad introduction to a wide variety of approaches to comparative research.
43700 Comparative Historical Analysis (Slater) A survey of best practices in the development of historically grounded causal explanations in comparative politics and sociology.
50900 Seminar on the Comparative Case Study Method (Mearsheimer, Pape)
The appropriate curriculum in formal theory and research methods clearly depends upon each student’s particular background, and we urge students to consult faculty advisors individually. For students who have prior experience or who wish to be first-rate producers of formal models or quantitative research, the best advice is to consult an advisor from the Committee on research methods and formal theory. Training in calculus and linear algebra is essential for advanced work in mathematical methods, and students who lack such training should plan to study these topics. The Mathematics Department offers calculus and linear algebra regularly. Students and faculty have occasionally organized study groups on their own to learn new material. The systematic nature of the curriculum, however, makes it possible to pursue training in these topics at several different levels.
Formal theory: 30901 (Game Theory I); 40801 (Social Choice).
Qualitative methods: 33300 (Interpretive Methods); 50900 (Comparative Case Study Method).
Quantitative methods: 43401 (Mathematical Foundations of Political Methodology); 30700 (Linear Models); 30600 (Causal Inference).
Students with a strong interest in formal models or research methods are encouraged to take courses outside the department, including courses on stochastic models, advanced probability, Bayesian inference, log-linear models, models for events data, network analysis, sociological inference, microeconomics, econometrics, international economics, the philosophy of science, and the logic of inquiry.
This Website Uses Cookies.
This website uses cookies to improve user experience. By using our website you consent to all cookies in accordance with our Cookie Policy.
Empirical Methods in Political Science: An Introduction
1 introduction, 1.1 what is political science.
This textbook focuses upon empirical methods used in political science. Before turning to the methods, it can be helpful to understand what political science is and what political science research can look like. Broadly, the discipline focuses on power and events throughout history. Some scholars focus on modern issues (e.g. Brexit) while others focus on historical ones (e.g. the New Deal in the U.S.). There are a variety of methods used and scholars are typically organized around the area/region they study. 1
1.1.1 Subfields in Political Science
There are four primary subfields in political science (although we can consider many subdivisions, additional groupings, and so on): comparative politics, American politics, international relations/world politics, and theory. For this text, we will focus on quantitative political science and so we will consider the first three subfields.
Comparative politics as a subfield focuses upon comparisons of countries or regions to one another. Typically, ‘comparativists’ have expertise that enables them to dig deeply into their region. However, the questions they ask are broadly relevant beyond the researcher’s region of expertise.
American politics focuses upon.…American politics. Here, scholars typically focus on behavior (e.g. voting), institutions (e.g. Congress), or history (American Political Development, a.k.a. ‘APD’). In other countries (e.g. Australia, Americanists are considered ‘comparativists’ ... so it’s all relative). Here, scholars typically focus on one of the approaches (e.g. institutions), but increasingly more scholars focus on both behavior and institutions, for example.
International relations , also known as IR or world politics, focuses on large-scale global questions. Questions here are often about trade, economic development, and/or political economy. There are different branches of IR. Focusing on the quantitative side, many IR scholars work with large datasets, perhaps only slightly more so than in other fields. Qualitative work, specifically, case studies, represents approximately 45% of the field as measured by ( Bennett, Barth, and Rutherford 2003 ) .
Methods Quantitative Methods is sometimes considered a subfield of political science and it is devoted to the development of quantitative methods, such as statistics, computational social science, and game theory. Methods scholars focus on tasks such as developing new methods for answering questions where previous ones had failed. For example, if you wanted to study something that either happens or doesn’t, then a regression wouldn’t be appropriate. You would need a new/different research method. Similarly, if you’re looking at something that unfolds over different stages, you might need to develop a strategic model to understand how the actors are incentivized to act.
1.2 Questions in Political Science
Questions in political science span the globe and often consider power: who has power, how that power is used and/or abused, and how power is specified. Here are a few questions that are or have been frequently studied: 2
Why are some countries democratic and others aren’t?
Does democratic rule make people better off? How?
What sort of political institutions lead to best outcomes?
What policies and institutions help diverse groups to live in peace?
What are causes of war? How can we prevent war?
What leads to cooperation between countries?
What are best ways to promote prosperity and avoid poverty?
Why do people vote and participate in politics as they do?
Is there a ‘resource curse’?
These are big questions. While progress has been made toward answering many of them, they are often so large and broad that a different interpretation can lead to a different finding: for example, what would be a best outcome for a political institution, Stability (and thus low turnover) or a responsive government?
As we go through the text, we’ll introduce different research questions and topics that span subfields and methods to demonstrate the range of political science research.
1.3 What are Empirical Political Science Methods?
In this textbook, we will focus on empirical research methods – meaning how political scientists use and think about quantitative data. These methods are how political scientists go from their initial question to being able to find an answer. They can be a regression/statistics, but they can also involve interviews, or mapping out social networks.
Political scientists use a range of methods to answer their research questions, with the key focus being whether the tool is appropriate for the job. Often, political scientists will specialize in one primary method, and receive training in a few others. This will shape how the researcher sees questions (for example, my own training is quantitatively-focused and so I tend to think about things from a quantitative mindset while a friend of mine has a qualitative background, so to her, she thinks about things like process as a key driver) and how that researcher is able to answer those questions.
1.3.1 Types of Methods
There are many types of methods used in political science. In the realm of quantitative political science, common methods include the following approaches listed below. There is one chapter that focuses upon techniques like interviews and participant observation, but the broad focus of the book is on quantitative data. Discussion about quantitative and qualitative methods is an important distinction within the discipline.
Surveys: Perhaps the most accessible or well-known approach. Surveys are questions asked of respondents. We will focus on how surveys are designed and how respondents are selected.
Experiments: Experiments are often described as the ‘gold standard’ for research and are common in many areas outside political science. In an experiment, there are frequently two groups that are identical to one another except that one group gets the ‘treatment’ and the other group does not. For example, one group might be exposed to a political ad of a certain type while the remaining group is not, to understand the connection between politics and emotions as in ( Karl 2019 ) .
Large N: In cases where there are a wealth of data, scholars may opt for statistical research. What this looks like can depend upon the size of the data.
Small N: Studies that have fewer observations or use approaches like interviews often focus on the mechanisms behind a process. For example, under what circumstances do institutions evolve and change? See: ( Mahoney and Thelen 2009 ; Ostrom 2015 ) .
Game Theory: In game theoretic approaches we represent the strategic choices actors make as a series of interdependent choices. There are frequently two key actors who must make decisions (such as cooperation or defection or the imposition of sanctions ( Pond 2017 ) ). These actions weigh the utility of certain choices dependent upon what and how their opponent(s) behave.
Social Networks: In social network research, it is the connections between individuals that become the items of interest. How do different actors relate to one another? How might information move around/through a community? These communities can be real (high school social networks, families) or virtual (who follows whom on twitter, whose work is cited by others).
Machine Learning: In this approach, very large datasets are used. Frequently, the aim is to discover patterns and connections in the data or to otherwise harness the power of many observations to discern the hidden order in the data.
1.3.2 Qualitative and Quantitative Political Science
Empirical research methods typically use quantitative data. These data are frequently numerical and can often show broad trends that are happening within the question of interest. Other scholars use qualitative methods. In a qualitative framework, the ‘data’ can be anything from noticing how spaces are shared by individuals at the Paris Climate Summit ( Marion Suiseeya and Zanotti 2019 ) to interviews ( Helmke 2005 ) . Often (but not always; see: Pearlman ( 2017 ) ) qualitative researchers work with fewer cases (small-n data) and quantitative researchers look at larger datasets (large-n data).
1.3.2.1 Multiple or Mixed Methods
Mixed or multiple methods refers to how many different approaches a scholar or scholars use in their analysis. Although they often specialize in one method, researchers may still combine methods – either through their own training and/or background – or through collaborating with others. For example, the use of experiments and surveys ( Teele, Kalla, and Rosenbluth 2018 ; Bonilla and Mo 2018 ) or interviews and observation ( Vargas 2016 ) ).
Both quantitative and qualitative approaches offer valuable insight into any given research question and there has been a bit of a divide that’s arisen within the discipline as technology evolves. With the increasing availability of quantitative data and low barriers to data gathering, it can be tempting to emphasize quantitative methods. Given the additional training often needed to hone and refine one’s skillset, individuals frequently rely on a primarily quantitative or qualitative approach. However, there is some movement toward what is termed a ‘mixed method’ or ‘multi-method’ approach in which both quantitative and qualitative data are used in a research project ( Seawright 2016 ) . As it will become clear at the end of the text, each method has advantages and disadvantages: combining methods can help leverage the strengths of each chosen method while minimizing the disadvantages when including a complementary method. Of course, this approach is not without a high cost – individuals must then be trained and proficient in multiple methods, something that can be challenging and time consuming.
Because of our (Clipperton et al) own background and training, we emphasize empirical approaches, but there are still many different ways to approach a question. A common trope regards advanced methodological training as equating to obtaining a hammer so that everything looks like a nail. Our hope is that you’ll develop an understanding of the different tools available in the political scientist’s tool kit so that you will be able to appreciate and interpret existing work while thinking critically about how to approach your own research questions. The research question itself can help you choose an appropriate method–rather than the reverse.
1.4 Scientific Method
Regardless of the question and the method, political scientists need a way to work through the evaluation of their question. For that, we will thank Karl Popper and his push not only for falsification but for urging that scholars have a method for their inquiry.
In this text, we rely on an adaptation of the scientific method. This is something we will use for each research article and every research proposal, so it’s important to understand each component fully. Below, we lay out the different elements of the scientific method. 3
Puzzle: This is the research question. It must be something that needs answered – often in the format, ‘research leads us to expect x, but we observe y’ or ‘here are two contradictory arguments, which is right?’ In any case, a puzzle is something that is not only unanswered, but interesting. It can somehow tell us about the world in a broader way, even if the question itself is quite narrow.
Theory: This is the explanation or answer to the question. Typically, you will have an outcome that you wish to explain with some important factor. In the following chapter, we’ll introduce theory more fully.
Hypotheses & Implications: while a theory is more broad and about the relationship of factors, hypotheses are often testable implications that stem directly from the theory.
Evidence/Test: evidence is how the authors support their theory and conclusions. It might be longitudinal data with a regression; it might be survey data with differences of means; it might be interview data. Here, you’ll explain how they are evaluating their argument.
Falsifiablity: Is it possible to disprove the theory? Sometimes articles might focus on a new paradigm for approaching a research area. These would not be falsifiable as they’re an approach or suggestion. Falsifiable questions can be proven wrong – for example, if I argue that voters prefer candicates who made a promise and kept it over those how made no promises or did not follow through, I could easily evaluate this with empirical evidence. Did voters elect someone who made promises over someone who did not? ( Bonilla 2022 ) .
Conclusions: This is what the study concludes – what are the major findings? Be specific about the findings and whether/how they generalize. For example, if the article is focusing on the 1980 Ugandan elections, what are the findings and what does that tell us overall?
Do I buy it?: This is where you’ll enter your critique of the article. You might wonder about the method they chose, how it was executed, or their particular case study. This is the point where you’ll describe your concerns and then evaluate whether the evidence presented is sufficient enough to overcome those objections.
Note that the scientific method is a helpful means to organize an article (minus the last element), but it’s an even more helpful way to organize your notes about an article. Using the scientific method can help provide a consistent, clear, organized structure that focuses on the essential elements of an article or book. In all but the last stage, you will want to be as objective as possible–laying out only the relevant elements/details. In the final portion, ‘do I buy it’, you will put down your critique. But to criticize something, you must first understand what is being argued.
1.5 What Can Research Tell Us?
When reading or conducting research, there are twin goals at play: the first is what relationships can be established in the research project/dataset itself; the second is how the question answered by the research project can speak about a broader population than just the data in the research project.
1.5.1 Support for hypotheses
This first component has to do with what can be established within the framework of the question and data. For example, suppose your research question has to do with political attitudes of young Americans. To answer this, you collect data from a random sample of Americans ( ch04 , ch05 ) your findings would pertain to your research question within your data. If you had a statistically significant relationship, you would find support for your hypotheses. If you failed to have a statistically significant relationship, you would not find support for your hypotheses. You would make conclusions about the individual data points within your dataset.
1.5.2 Generalizability
The second component has to do with how your research fits into a broader picture: what can your research tell us about young Americans and how does that fit into a larger context? Supposing you conducted your sample appropriately ( ch04 ), you would be able to speak to not only the individuals in your sample, but the population they are intended to represent. This is the important component of research and why we will spend a large amount of time discussing sampling approaches and appropriate methodology. While your sample of, say, 1600 data points may be interesting, it’s really only interesting in that it can tell us about the 327 million other data points we don’t know anything about.
1.6 Overview of the Textbook
The textbook proceeds with an introduction to theory and concept building, moves to an explanation of causal inference (how do we ‘know’ whether something is causal?), and then provides a quick introduction to data and hypothesis testing. Following that, each chapter is devoted to a particular research method used within political science: surveys, experiments, large N, small n, game theory, social network analysis, and machine learning. Each chapter follows a similar format and layout to help introduce the method, its advantages, disadvantages, and different applications.
A note about this textbook: in its creation, we have worked to balance our references across subfields (see next subsection) and the race and gender of cited scholars. Our aim is to provide a diverse look at political science, incorporating as many different perspectives as possible. We use a tool developed by Jane Sumner ( Sumner 2018 ) that came out of a project with ( Dion, Sumner, and Mitchell 2018 ) to evaluate the balance in each chapter in the textbook. ↩︎
thank you to Andrew Roberts whose original list has been adapted here ↩︎
These questions adapted from ( Clark, Golder, and Golder 2017 ) ↩︎
Academia.edu no longer supports Internet Explorer.
To browse Academia.edu and the wider internet faster and more securely, please take a few seconds to upgrade your browser .
Enter the email address you signed up with and we'll email you a reset link.
- We're Hiring!
- Help Center

2016. 'Qualitative Methods in Political Science', in: Handbook of Research Methods and Applications in Political Science, Edward Elgar Publishing, in press.

A qualitative method refers to the way of studying the social and political world that seeks to understand the meaning underlying an intention, action, object or phenomenon. In Political Science research, qualitative methods are usually contrasted with quantitative methods, which typically deal with large amount of data, using surveys and statistical methods, with the aim of establishing causal relationships between social phenomena. Given such differences, qualitative and quantitative methods have usually been conceived as two mutually exclusive modes of generating and analysing data. In this chapter, we challenge these assumptions, but argue that the most important distinction between different methods of analyses relates to the ontological and epistemological position they rely on, rather than the type of data they seek to analysis. We also outline examples of the use of qualitative methods in Political Science research to show that such methods cannot be associated with an 'anything goes approach'
Related Papers
American Journal of Qualitative Research
Kacper Grass
This essay reviews classic works on the philosophy of science and contemporary pedagogical guides to scientific inquiry in order to present a discussion of the three logics that underlie qualitative research in political science. The first logic, epistemology, relates to the essence of research as a scientific endeavor and is framed as a debate between positivist and interpretivist orientations within the discipline of political science. The second logic, ontology, relates to the approach that research takes to investigating the empirical world and is framed as a debate between positivist qualitative and quantitative orientations, which together constitute the vast majority of mainstream researchers within the discipline. The third logic, methodology, relates to the means by which research aspires to reach its scientific ends and is framed as a debate among positivist qualitative orientations. Additionally, the essay discusses the present state of qualitative research in the discipline of political science, reviews the various ways in which qualitative research is defined in the relevant literature, addresses the limitations and trade-offs that are inherently associated with the aforementioned logics of qualitative research, explores multimethod approaches to remedying these issues, and proposes avenues for acquiring further information on the topics discussed.
Qualitative Research in Political Science
Joachim Blatter
Stefania Kalogeraki
Marta Costa
David Collier
Shifting debates on what constitutes " science " reveal competing claims about methodology. 2 Of course, in its origin the term " science " means " knowledge, " and researchers obviously hold a wide spectrum of positions on how to produce viable knowledge. Within this spectrum, we compare two alternative meanings of science, advanced by scholars who seek to legitimate sharply contrasting views of qualitative methods. This comparison points to a sea change in political science methodology. 3 1 This article draws on the Introductions to Parts I and II of Brady and Collier, Rethinking Social Inquiry: Diverse Tools, Shared Standards, 2nd edn. (Lanham, MD.: Rowman & Littlefield, 2010). 2 Morgan (1996) provides a broad overview of rival views of science, encompassing the natural, biological, and social sciences. 3 For our own work, we share David Freedman's (2010a) view of plurality in scientific methods, and we also recognize social versus natural science as partially different enterprises. Yet the two can and should strive for careful formulation of hypotheses, intersubjective agreement on the facts being analyzed, precise use of data, and good
Asian Social Science
Orest masue
Cleve V . Arguelles
This course introduces the students to the theoretical and practical fundamentals of designing and doing qualitative research in political science. It covers the basic techniques for designing and conducting qualitative research as well as for collecting, interpreting, and analyzing qualitative data. This course will primarily focus on the different qualitative methods and techniques such as interviews, participant observations, and archival work. Students will be exposed to both the theoretical (what is qualitative research? Can it meet standards of scientific evidence?) and practical (what are the best practices in doing an interview? How does one maintain good field notes?) debates on qualitative research in the discipline. While this course will primarily benefit students who intend to pursue qualitative research, especially those who will do fieldwork, the principles and practical skills discussed in the course can complement other traditions of doing research, including mixed-methods strategies. Finally, because in research, much is learned by doing, this course requires that you get your hands dirty by doing writing exercises.
WilliamG Tierney
This paper examines the relationship between qualitative research and public policy. For decades, qualitative and quantitative methodologists have debated the merits of one perspective in relation to others. Scholars, using diverse epistemological and ontological stances, have contested different beliefs about the criteria for judgment of rigorous research. Yet, such exchanges routinely ignore the unique ways in which qualitative research can inform policy. In this paper, the authors acknowledge previous examinations, and also intend to create a new discourse. The authors present the limitations of qualitative research; these limitations have historically been the justifications used by individuals to discount the use of qualitative research for policy studies. They conclude with the need to refocus on the usefulness of qualitative research and offer an evolving set of criteria for conducting policy-related research. The purpose is neither to oppose nor to diminish select methodologies; instead, it is to suggest a complimentary suite of qualitative and quantitative approaches to better investigate social issues.
Revista Pléyade
Ricardo Schmukler
This course introduces the students to the theoretical and practical fundamentals of designing and doing qualitative research in political science. It covers the basic techniques for designing and conducting qualitative research as well as for collecting, analyzing, and reporting qualitative data. This course will primarily focus on the different qualitative methods and techniques such as interviews, participant observations, and archival work. Students will be exposed to both the theoretical (what is qualitative research? Can it meet standards of scientific evidence?) and practical (what are the best practices in doing an interview? How does one maintain good field notes?) debates on qualitative research in the discipline. While this course will primarily benefit students who intend to pursue qualitative research, especially those who will do fieldwork, the principles and practical skills discussed in the course can complement other traditions of doing research, including mixed-methods strategies. Finally, because in research, much is learned by doing, this course requires that you get your hands dirty by doing writing exercises.
Loading Preview
Sorry, preview is currently unavailable. You can download the paper by clicking the button above.
RELATED PAPERS
elizabeth kier
Srdjan Vucetic
Dvora Yanow
Fred Eidlin
Historical Social Research
Dirk Berg-Schlosser
Política Hoje
Virginia Rocha
Kiunyu Chan
The International Journal of Humanities and Social Studies (IJHSS)
Adeleke Olumide Ogunnoiki
Khandaker Islam
Simeon Mitropolitski
International Journal of Social Research Methodology
Julia Brannen
James Hanley
Nkwachukwu Orji
Janapriya Journal of Interdisciplinary Studies
Prakash Upadhyay
African Renaissance
EDMORE NTINI
SYED ARABI BIN SYED ABDULLAH IDID Idid
Das Scriber Interdisciplinary Research and Development
Alexis Cabauatan
MKSES Publication
Vipul K U M A R Gautam
Pertti Alasuutari
Political Studies Review
Jason Glynos
David Howarth , Jason Glynos
Qualitative & Multi-Method Research
Martha Feldman
Journal of Political Science Education
Johan Adriaensen
ALFREDO MANZANO AMEZQUITA
RELATED TOPICS
- We're Hiring!
- Help Center
- Find new research papers in:
- Health Sciences
- Earth Sciences
- Cognitive Science
- Mathematics
- Computer Science
- Academia ©2024
- Maps & Floorplans
- Libraries A-Z

- Ellis Library (main)
- Engineering Library
- Geological Sciences
- Journalism Library
- Law Library
- Mathematical Sciences
- MU Digital Collections
- Veterinary Medical
- More Libraries...
- Instructional Services
- Course Reserves
- Course Guides
- Schedule a Library Class
- Class Assessment Forms
- Recordings & Tutorials
- Research & Writing Help
- More class resources
- Places to Study
- Borrow, Request & Renew
- Call Numbers
- Computers, Printers, Scanners & Software
- Digital Media Lab
- Equipment Lending: Laptops, cameras, etc.
- Subject Librarians
- Writing Tutors
- More In the Library...
- Undergraduate Students
- Graduate Students
- Faculty & Staff
- Researcher Support
- Distance Learners
- International Students
- More Services for...
- View my MU Libraries Account (login & click on My Library Account)
- View my MOBIUS Checkouts
- Renew my Books (login & click on My Loans)
- Place a Hold on a Book
- Request Books from Depository
- View my ILL@MU Account
- Set Up Alerts in Databases
- More Account Information...
Political Science: Research Methods
- Getting an Overview
- Database Search Tips
- Find Articles
- Find the TEXT of an Article
Research Methods
- Mapping & Citing
- Statistics and Data
- Demographics
- U.S. Politics
- Laws & Policy
- Political News
- Campaign Finance
- Dissertations/Theses
- Top Political Science Journals
- PS Organizations
There are many guides and handbooks for both qualitative and quantitative research methods. Many books on political science methodology are found in the JA 71 call number area (second floor, East, in Ellis Library).
Keep in mind that methodology books are very high use, so if our copy is checked out, request the book from ALL MERLIN or MOBIUS.
Here is a sampling of books available:
Encyclopedia of Research Design (ebook) An encyclopedia of information on quantitative and qualitative research design, research methods, statistics and mathematical concepts used in research. Includes reviews of tools and articles that have had an impact on how research is conducted and results are analyzed.
Encyclopedia of Survey Research Methods (ebook) Covers all major facets of survey research methodology, from selecting the sample design and the sampling frame, designing and pretesting the questionnaire, data collection, and data coding, to the issues surrounding diminishing response rates, confidentiality, privacy, informed consent and other ethical issues, data weighting, and data analyses.
Research methods for political science: quantitative, qualitative and mixed method approaches. (ebook) The third edition retains its effective approach to help students learn what to research, why to research, and how to research. The text integrates both quantitative and qualitative approaches to research in one volume and covers such important topics as research design, specifying research problems, designing questionnaires and writing questions, designing and carrying out qualitative research, and analyzing both quantitative and qualitative research data.
Sage Encyclopedia of Qualitative Research Methods (ebook) An interdisciplinary approach to the field of qualitative research, providing background information on concepts that inform qualitative research practices.
Basic Research Methods: an entry to social science research (ebook) This text offers a comprehensive and rounded view of research as a tool for logical problem-solving. It is built on the philosophical-pragmatic foundation that the value of knowledge and research methodologies lies in their usefulness in engaging with the real world.
Social Science Research: principles, methods and practices (ebook) This book is designed to introduce doctoral and graduate students to the process of scientific research in the social sciences, business, education, public health, and related disciplines.
SAGE encyclopedia of social science research methods (ebook) Featuring over 900 entries, this resource covers all disciplines within the social sciences with both concise definitions & in-depth essays.
Sage handbook of research methods in political science and international relations . (ebook) This book offers a comprehensive overview of research processes in social science - from the ideation and design of research projects, through the construction of theoretical arguments, to conceptualization, measurement, and data collection, and quantitative and qualitative empirical analysis
Political science research in practice / Malici and Smith (print) ( JA86 .M34 2012)
Experimental political science and the study of causality : from nature to the lab / Rebecca B. Morton, Kenneth C. Williams (print) ( JA71 .M675 2010 )
Empirical research and writing : a political science student's practical guide / Leanne C. Powner (print) ( JA86 .P69 2015 )
Handbook of research methods and applications in political science / edited by Hans Keman, Jaap J. Woldendorp (print) ( JA86 .H3573 2016 )
Research methods for political science : quantitative and qualitative approaches / David E. McNabb. (print) ( JA71.5 .M34 2010 )
Statistical models and causal inference : a dialogue with the social sciences / David A. Freedman ; edited by David Collier, Jasjeet S. Sekhon, Philip B. Stark. (print) ( HA29 .F6785 2010 )
The Oxford handbook of political methodology / edited by Janet M. Box-Steffensmeier, Henry E. Brady and David Collier. (print) ( JA71 .O948 2008 )
Political science research methods : exploring America at a crossroads / Cal Clark. (print) ( JA88.U6 C535 2014 )
- << Previous: Find Books
- Next: Mapping & Citing >>
- Last Updated: Aug 23, 2024 1:48 PM
- URL: https://libraryguides.missouri.edu/polsci

- Databank Solution
- Credit Risk Solution
- Valuation Analytics Solution
- ESG Sustainability Solution
- Quantitative Finance Solution
- Regulatory Technology Solution
- Product Introduction
- Service Provide Method
- Learning Video
Quantitative Data Analysis Guide: Methods, Examples & Uses

This guide will introduce the types of data analysis used in quantitative research, then discuss relevant examples and applications in the finance industry.
Table of Contents
An Overview of Quantitative Data Analysis
What is quantitative data analysis and what is it for .
Quantitative data analysis is the process of interpreting meaning and extracting insights from numerical data , which involves mathematical calculations and statistical reviews to uncover patterns, trends, and relationships between variables.
Beyond academic and statistical research, this approach is particularly useful in the finance industry. Financial data, such as stock prices, interest rates, and economic indicators, can all be quantified with statistics and metrics to offer crucial insights for informed investment decisions. To illustrate this, here are some examples of what quantitative data is usually used for:
- Measuring Differences between Groups: For instance, analyzing historical stock prices of different companies or asset classes can reveal which companies consistently outperform the market average.
- Assessing Relationships between Variables: An investor could analyze the relationship between a company’s price-to-earnings ratio (P/E ratio) and relevant factors, like industry performance, inflation rates, interests, etc, allowing them to predict future stock price growth.
- Testing Hypotheses: For example, an investor might hypothesize that companies with strong ESG (Environment, Social, and Governance) practices outperform those without. By categorizing these companies into two groups (strong ESG vs. weak ESG practices), they can compare the average return on investment (ROI) between the groups while assessing relevant factors to find evidence for the hypothesis.
Ultimately, quantitative data analysis helps investors navigate the complex financial landscape and pursue profitable opportunities.
Quantitative Data Analysis VS. Qualitative Data Analysis
Although quantitative data analysis is a powerful tool, it cannot be used to provide context for your research, so this is where qualitative analysis comes in. Qualitative analysis is another common research method that focuses on collecting and analyzing non-numerical data , like text, images, or audio recordings to gain a deeper understanding of experiences, opinions, and motivations. Here’s a table summarizing its key differences between quantitative data analysis:
| Types of Data Used | Numerical data: numbers, percentages, etc. | Non-numerical data: text, images, audio, narratives, etc |
| Perspective | More objective and less prone to bias | More subjective as it may be influenced by the researcher’s interpretation |
| Data Collection | Closed-ended questions, surveys, polls | Open-ended questions, interviews, observations |
| Data Analysis | Statistical methods, numbers, graphs, charts | Categorization, thematic analysis, verbal communication |
| Focus | and | and |
| Best Use Case | Measuring trends, comparing groups, testing hypotheses | Understanding user experience, exploring consumer motivations, uncovering new ideas |
Due to their characteristics, quantitative analysis allows you to measure and compare large datasets; while qualitative analysis helps you understand the context behind the data. In some cases, researchers might even use both methods together for a more comprehensive understanding, but we’ll mainly focus on quantitative analysis for this article.
The 2 Main Quantitative Data Analysis Methods
Once you have your data collected, you have to use descriptive statistics or inferential statistics analysis to draw summaries and conclusions from your raw numbers.
As its name suggests, the purpose of descriptive statistics is to describe your sample . It provides the groundwork for understanding your data by focusing on the details and characteristics of the specific group you’ve collected data from.
On the other hand, inferential statistics act as bridges that connect your sample data to the broader population you’re truly interested in, helping you to draw conclusions in your research. Moreover, choosing the right inferential technique for your specific data and research questions is dependent on the initial insights from descriptive statistics, so both of these methods usually go hand-in-hand.
Descriptive Statistics Analysis
With sophisticated descriptive statistics, you can detect potential errors in your data by highlighting inconsistencies and outliers that might otherwise go unnoticed. Additionally, the characteristics revealed by descriptive statistics will help determine which inferential techniques are suitable for further analysis.
Measures in Descriptive Statistics
One of the key statistical tests used for descriptive statistics is central tendency . It consists of mean, median, and mode, telling you where most of your data points cluster:
- Mean: It refers to the “average” and is calculated by adding all the values in your data set and dividing by the number of values.
- Median: The middle value when your data is arranged in ascending or descending order. If you have an odd number of data points, the median is the exact middle value; with even numbers, it’s the average of the two middle values.
- Mode: This refers to the most frequently occurring value in your data set, indicating the most common response or observation. Some data can have multiple modes (bimodal) or no mode at all.
Another statistic to test in descriptive analysis is the measures of dispersion , which involves range and standard deviation, revealing how spread out your data is relative to the central tendency measures:
- Range: It refers to the difference between the highest and lowest values in your data set.
- Standard Deviation (SD): This tells you how the data is distributed within the range, revealing how much, on average, each data point deviates from the mean. Lower standard deviations indicate data points clustered closer to the mean, while higher standard deviations suggest a wider spread.
The shape of the distribution will then be measured through skewness.
- Skewness: A statistic that indicates whether your data leans to one side (positive or negative) or is symmetrical (normal distribution). A positive skew suggests more data points concentrated on the lower end, while a negative skew indicates more data points on the higher end.
While the core measures mentioned above are fundamental, there are additional descriptive statistics used in specific contexts, including percentiles and interquartile range.
- Percentiles: This divides your data into 100 equal parts, revealing what percentage of data falls below a specific value. The 25th percentile (Q1) is the first quartile, the 50th percentile (Q2) is the median, and the 75th percentile (Q3) is the third quartile. Knowing these quartiles can help visualize the spread of your data.
- Interquartile Range (IQR): This measures the difference between Q3 and Q1, representing the middle 50% of your data.
Example of Descriptive Quantitative Data Analysis
Let’s illustrate these concepts with a real-world example. Imagine a financial advisor analyzing a client’s portfolio. They have data on the client’s various holdings, including stock prices over the past year. With descriptive statistics they can obtain the following information:
- Central Tendency: The mean price for each stock reveals its average price over the year. The median price can further highlight if there were any significant price spikes or dips that skewed the mean.
- Measures of Dispersion: The standard deviation for each stock indicates its price volatility. A high standard deviation suggests the stock’s price fluctuated considerably, while a low standard deviation implies a more stable price history. This helps the advisor assess each stock’s risk profile.
- Shape of the Distribution: If data allows, analyzing skewness can be informative. A positive skew for a stock might suggest more frequent price drops, while a negative skew might indicate more frequent price increases.
By calculating these descriptive statistics, the advisor gains a quick understanding of the client’s portfolio performance and risk distribution. For instance, they could use correlation analysis to see if certain stock prices tend to move together, helping them identify expansion opportunities within the portfolio.
While descriptive statistics provide a foundational understanding, they should be followed by inferential analysis to uncover deeper insights that are crucial for making investment decisions.
Inferential Statistics Analysis
Inferential statistics analysis is particularly useful for hypothesis testing , as you can formulate predictions about group differences or potential relationships between variables , then use statistical tests to see if your sample data supports those hypotheses.
However, the power of inferential statistics hinges on one crucial factor: sample representativeness . If your sample doesn’t accurately reflect the population, your predictions won’t be very reliable.
Statistical Tests for Inferential Statistics
Here are some of the commonly used tests for inferential statistics in commerce and finance, which can also be integrated to most analysis software:
- T-Tests: This compares the means, standard deviation, or skewness of two groups to assess if they’re statistically different, helping you determine if the observed difference is just a quirk within the sample or a significant reflection of the population.
- ANOVA (Analysis of Variance): While T-Tests handle comparisons between two groups, ANOVA focuses on comparisons across multiple groups, allowing you to identify potential variations and trends within the population.
- Correlation Analysis: This technique tests the relationship between two variables, assessing if one variable increases or decreases with the other. However, it’s important to note that just because two financial variables are correlated and move together, doesn’t necessarily mean one directly influences the other.
- Regression Analysis: Building on correlation, regression analysis goes a step further to verify the cause-and-effect relationships between the tested variables, allowing you to investigate if one variable actually influences the other.
- Cross-Tabulation: This breaks down the relationship between two categorical variables by displaying the frequency counts in a table format, helping you to understand how different groups within your data set might behave. The data in cross-tabulation can be mutually exclusive or have several connections with each other.
- Trend Analysis: This examines how a variable in quantitative data changes over time, revealing upward or downward trends, as well as seasonal fluctuations. This can help you forecast future trends, and also lets you assess the effectiveness of the interventions in your marketing or investment strategy.
- MaxDiff Analysis: This is also known as the “best-worst” method. It evaluates customer preferences by asking respondents to choose the most and least preferred options from a set of products or services, allowing stakeholders to optimize product development or marketing strategies.
- Conjoint Analysis: Similar to MaxDiff, conjoint analysis gauges customer preferences, but it goes a step further by allowing researchers to see how changes in different product features (price, size, brand) influence overall preference.
- TURF Analysis (Total Unduplicated Reach and Frequency Analysis): This assesses a marketing campaign’s reach and frequency of exposure in different channels, helping businesses identify the most efficient channels to reach target audiences.
- Gap Analysis: This compares current performance metrics against established goals or benchmarks, using numerical data to represent the factors involved. This helps identify areas where performance falls short of expectations, serving as a springboard for developing strategies to bridge the gap and achieve those desired outcomes.
- SWOT Analysis (Strengths, Weaknesses, Opportunities, and Threats): This uses ratings or rankings to represent an organization’s internal strengths and weaknesses, along with external opportunities and threats. Based on this analysis, organizations can create strategic plans to capitalize on opportunities while minimizing risks.
- Text Analysis: This is an advanced method that uses specialized software to categorize and quantify themes, sentiment (positive, negative, neutral), and topics within textual data, allowing companies to obtain structured quantitative data from surveys, social media posts, or customer reviews.
Example of Inferential Quantitative Data Analysis
If you’re a financial analyst studying the historical performance of a particular stock, here are some predictions you can make with inferential statistics:
- The Differences between Groups: You can conduct T-Tests to compare the average returns of stocks in the technology sector with those in the healthcare sector. It can help assess if the observed difference in returns between these two sectors is simply due to random chance or if it’s statistically significant due to a significant difference in their performance.
- The Relationships between Variables: If you’re curious about the connection between a company’s price-to-earnings ratio (P/E ratios) and its future stock price movements, conducting correlation analysis can let you measure the strength and direction of this relationship. Is there a negative correlation, suggesting that higher P/E ratios might be associated with lower future stock prices? Or is there no significant correlation at all?
Understanding these inferential analysis techniques can help you uncover potential relationships and group differences that might not be readily apparent from descriptive statistics alone. Nonetheless, it’s important to remember that each technique has its own set of assumptions and limitations . Some methods are designed for parametric data with a normal distribution, while others are suitable for non-parametric data.
Guide to Conduct Data Analysis in Quantitative Research
Now that we have discussed the types of data analysis techniques used in quantitative research, here’s a quick guide to help you choose the right method and grasp the essential steps of quantitative data analysis.
How to Choose the Right Quantitative Analysis Method?
Choosing between all these quantitative analysis methods may seem like a complicated task, but if you consider the 2 following factors, you can definitely choose the right technique:
Factor 1: Data Type
The data used in quantitative analysis can be categorized into two types, discrete data and continuous data, based on how they’re measured. They can also be further differentiated by their measurement scale. The four main types of measurement scales include: nominal, ordinal, interval or ratio. Understanding the distinctions between them is essential for choosing the appropriate statistical methods to interpret the results of your quantitative data analysis accurately.
Discrete data , which is also known as attribute data, represents whole numbers that can be easily counted and separated into distinct categories. It is often visualized using bar charts or pie charts, making it easy to see the frequency of each value. In the financial world, examples of discrete quantitative data include:
- The number of shares owned by an investor in a particular company
- The number of customer transactions processed by a bank per day
- Bond ratings (AAA, BBB, etc.) that represent discrete categories indicating the creditworthiness of a bond issuer
- The number of customers with different account types (checking, savings, investment) as seen in the pie chart below:

Discrete data usually use nominal or ordinal measurement scales, which can be then quantified to calculate their mode or median. Here are some examples:
- Nominal: This scale categorizes data into distinct groups with no inherent order. For instance, data on bank account types can be considered nominal data as it classifies customers in distinct categories which are independent of each other, either checking, savings, or investment accounts. and no inherent order or ranking implied by these account types.
- Ordinal: Ordinal data establishes a rank or order among categories. For example, investment risk ratings (low, medium, high) are ordered based on their perceived risk of loss, making it a type or ordinal data.
Conversely, continuous data can take on any value and fluctuate over time. It is usually visualized using line graphs, effectively showcasing how the values can change within a specific time frame. Examples of continuous data in the financial industry include:
- Interest rates set by central banks or offered by banks on loans and deposits
- Currency exchange rates which also fluctuate constantly throughout the day
- Daily trading volume of a particular stock on a specific day
- Stock prices that fluctuate throughout the day, as seen in the line graph below:

Source: Freepik
The measurement scale for continuous data is usually interval or ratio . Here is breakdown of their differences:
- Interval: This builds upon ordinal data by having consistent intervals between each unit, and its zero point doesn’t represent a complete absence of the variable. Let’s use credit score as an example. While the scale ranges from 300 to 850, the interval between each score rating is consistent (50 points), and a score of zero wouldn’t indicate an absence of credit history, but rather no credit score available.
- Ratio: This scale has all the same characteristics of interval data but also has a true zero point, indicating a complete absence of the variable. Interest rates expressed as percentages are a classic example of ratio data. A 0% interest rate signifies the complete absence of any interest charged or earned, making it a true zero point.
Factor 2: Research Question
You also need to make sure that the analysis method aligns with your specific research questions. If you merely want to focus on understanding the characteristics of your data set, descriptive statistics might be all you need; if you need to analyze the connection between variables, then you have to include inferential statistics as well.
How to Analyze Quantitative Data
Step 1: data collection .
Depending on your research question, you might choose to conduct surveys or interviews. Distributing online or paper surveys can reach a broad audience, while interviews allow for deeper exploration of specific topics. You can also choose to source existing datasets from government agencies or industry reports.
Step 2: Data Cleaning
Raw data might contain errors, inconsistencies, or missing values, so data cleaning has to be done meticulously to ensure accuracy and consistency. This might involve removing duplicates, correcting typos, and handling missing information.
Furthermore, you should also identify the nature of your variables and assign them appropriate measurement scales , it could be nominal, ordinal, interval or ratio. This is important because it determines the types of descriptive statistics and analysis methods you can employ later. Once you categorize your data based on these measurement scales, you can arrange the data of each category in a proper order and organize it in a format that is convenient for you.
Step 3: Data Analysis
Based on the measurement scales of your variables, calculate relevant descriptive statistics to summarize your data. This might include measures of central tendency (mean, median, mode) and dispersion (range, standard deviation, variance). With these statistics, you can identify the pattern within your raw data.
Then, these patterns can be analyzed further with inferential methods to test out the hypotheses you have developed. You may choose any of the statistical tests mentioned above, as long as they are compatible with the characteristics of your data.
Step 4. Data Interpretation and Communication
Now that you have the results from your statistical analysis, you may draw conclusions based on the findings and incorporate them into your business strategies. Additionally, you should also transform your findings into clear and shareable information to facilitate discussion among stakeholders. Visualization techniques like tables, charts, or graphs can make complex data more digestible so that you can communicate your findings efficiently.
Useful Quantitative Data Analysis Tools and Software
We’ve compiled some commonly used quantitative data analysis tools and software. Choosing the right one depends on your experience level, project needs, and budget. Here’s a brief comparison:
| Easiest | Beginners & basic analysis | One-time purchase with Microsoft Office Suite | |
| Easy | Social scientists & researchers | Paid commercial license | |
| Easy | Students & researchers | Paid commercial license or student discounts | |
| Moderate | Businesses & advanced research | Paid commercial license | |
| Moderate | Researchers & statisticians | Paid commercial license | |
| Moderate (Coding optional) | Programmers & data scientists | Free & Open-Source | |
| Steep (Coding required) | Experienced users & programmers | Free & Open-Source | |
| Steep (Coding required) | Scientists & engineers | Paid commercial license | |
| Steep (Coding required) | Scientists & engineers | Paid commercial license |
Quantitative Data in Finance and Investment
So how does this all affect the finance industry? Quantitative finance (or quant finance) has become a growing trend, with the quant fund market valued at $16,008.69 billion in 2023. This value is expected to increase at the compound annual growth rate of 10.09% and reach $31,365.94 billion by 2031, signifying its expanding role in the industry.
What is Quant Finance?
Quant finance is the process of using massive financial data and mathematical models to identify market behavior, financial trends, movements, and economic indicators, so that they can predict future trends.These calculated probabilities can be leveraged to find potential investment opportunities and maximize returns while minimizing risks.
Common Quantitative Investment Strategies
There are several common quantitative strategies, each offering unique approaches to help stakeholders navigate the market:
1. Statistical Arbitrage
This strategy aims for high returns with low volatility. It employs sophisticated algorithms to identify minuscule price discrepancies across the market, then capitalize on them at lightning speed, often generating short-term profits. However, its reliance on market efficiency makes it vulnerable to sudden market shifts, posing a risk of disrupting the calculations.
2. Factor Investing
This strategy identifies and invests in assets based on factors like value, momentum, or quality. By analyzing these factors in quantitative databases , investors can construct portfolios designed to outperform the broader market. Overall, this method offers diversification and potentially higher returns than passive investing, but its success relies on the historical validity of these factors, which can evolve over time.
3. Risk Parity
This approach prioritizes portfolio balance above all else. Instead of allocating assets based on their market value, risk parity distributes them based on their risk contribution to achieve a desired level of overall portfolio risk, regardless of individual asset volatility. Although it is efficient in managing risks while potentially offering positive returns, it is important to note that this strategy’s complex calculations can be sensitive to unexpected market events.
4. Machine Learning & Artificial Intelligence (AI)
Quant analysts are beginning to incorporate these cutting-edge technologies into their strategies. Machine learning algorithms can act as data sifters, identifying complex patterns within massive datasets; whereas AI goes a step further, leveraging these insights to make investment decisions, essentially mimicking human-like decision-making with added adaptability. Despite the hefty development and implementation costs, its superior risk-adjusted returns and uncovering hidden patterns make this strategy a valuable asset.
Pros and Cons of Quantitative Data Analysis
Advantages of quantitative data analysis, minimum bias for reliable results.
Quantitative data analysis relies on objective, numerical data. This minimizes bias and human error, allowing stakeholders to make investment decisions without emotional intuitions that can cloud judgment. In turn, this offers reliable and consistent results for investment strategies.
Precise Calculations for Data-Driven Decisions
Quantitative analysis generates precise numerical results through statistical methods. This allows accurate comparisons between investment options and even predictions of future market behavior, helping investors make informed decisions about where to allocate their capital while managing potential risks.
Generalizability for Broader Insights
By analyzing large datasets and identifying patterns, stakeholders can generalize the findings from quantitative analysis into broader populations, applying them to a wider range of investments for better portfolio construction and risk management
Efficiency for Extensive Research
Quantitative research is more suited to analyze large datasets efficiently, letting companies save valuable time and resources. The softwares used for quantitative analysis can automate the process of sifting through extensive financial data, facilitating quicker decision-making in the fast-paced financial environment.
Disadvantages of Quantitative Data Analysis
Limited scope .
By focusing on numerical data, quantitative analysis may provide a limited scope, as it can’t capture qualitative context such as emotions, motivations, or cultural factors. Although quantitative analysis provides a strong starting point, neglecting qualitative factors can lead to incomplete insights in the financial industry, impacting areas like customer relationship management and targeted marketing strategies.
Oversimplification
Breaking down complex phenomena into numerical data could cause analysts to overlook the richness of the data, leading to the issue of oversimplification. Stakeholders who fail to understand the complexity of economic factors or market trends could face flawed investment decisions and missed opportunities.
Home > Blog >
Data analysis in qualitative research, theertha raj, august 30, 2024.
While numbers tell us "what" and "how much," qualitative data reveals the crucial "why" and "how." But let's face it - turning mountains of text, images, and observations into meaningful insights can be daunting.
This guide dives deep into the art and science of how to analyze qualitative data. We'll explore cutting-edge techniques, free qualitative data analysis software, and strategies to make your analysis more rigorous and insightful. Expect practical, actionable advice on qualitative data analysis methods, whether you're a seasoned researcher looking to refine your skills or a team leader aiming to extract more value from your qualitative data.
What is qualitative data?
Qualitative data is non-numerical information that describes qualities or characteristics. It includes text, images, audio, and video.
This data type captures complex human experiences, behaviors, and opinions that numbers alone can't express.
A qualitative data example can include interview transcripts, open-ended survey responses, field notes from observations, social media posts and customer reviews
Importance of qualitative data
Qualitative data is vital for several reasons:
- It provides a deep, nuanced understanding of complex phenomena.
- It captures the 'why' behind behaviors and opinions.
- It allows for unexpected discoveries and new research directions.
- It puts people's experiences and perspectives at the forefront.
- It enhances quantitative findings with depth and detail.
What is data analysis in qualitative research?
Data analysis in qualitative research is the process of examining and interpreting non-numerical data to uncover patterns, themes, and insights. It aims to make sense of rich, detailed information gathered through methods like interviews, focus groups, or observations.
This analysis moves beyond simple description. It seeks to understand the underlying meanings, contexts, and relationships within the data. The goal is to create a coherent narrative that answers research questions and generates new knowledge.
How is qualitative data analysis different from quantitative data analysis?
Qualitative and quantitative data analyses differ in several key ways:
- Data type: Qualitative analysis uses non-numerical data (text, images), while quantitative analysis uses numerical data.
- Approach: Qualitative analysis is inductive and exploratory. Quantitative analysis is deductive and confirmatory.
- Sample size: Qualitative studies often use smaller samples. Quantitative studies typically need larger samples for statistical validity.
- Depth vs. breadth: Qualitative analysis provides in-depth insights about a few cases. Quantitative analysis offers broader insights across many cases.
- Subjectivity: Qualitative analysis involves more subjective interpretation. Quantitative analysis aims for objective, statistical measures.
What are the 3 main components of qualitative data analysis?
The three main components of qualitative data analysis are:
- Data reduction: Simplifying and focusing the raw data through coding and categorization.
- Data display: Organizing the reduced data into visual formats like matrices, charts, or networks.
- Conclusion drawing/verification: Interpreting the displayed data and verifying the conclusions.
These components aren't linear steps. Instead, they form an iterative process where researchers move back and forth between them throughout the analysis.
How do you write a qualitative analysis?
Step 1: organize your data.
Start with bringing all your qualitative research data in one place. A repository can be of immense help here. Transcribe interviews , compile field notes, and gather all relevant materials.
Immerse yourself in the data. Read through everything multiple times.
Step 2: Code & identify themes
Identify and label key concepts, themes, or patterns. Group related codes into broader themes or categories. Try to connect themes to tell a coherent story that answers your research questions.
Pick out direct quotes from your data to illustrate key points.
Step 3: Interpret and reflect
Explain what your results mean in the context of your research and existing literature.
Als discuss, identify and try to eliminate potential biases or limitations in your analysis.
Summarize main insights and their implications.
What are the 5 qualitative data analysis methods?
Thematic Analysis Identifying, analyzing, and reporting patterns (themes) within data.
Content Analysis Systematically categorizing and counting the occurrence of specific elements in text.
Grounded Theory Developing theory from data through iterative coding and analysis.
Discourse Analysis Examining language use and meaning in social contexts.
Narrative Analysis Interpreting stories and personal accounts to understand experiences and meanings.
Each method suits different research goals and data types. Researchers often combine methods for comprehensive analysis.
What are the 4 data collection methods in qualitative research?
When it comes to collecting qualitative data, researchers primarily rely on four methods.
- Interviews : One-on-one conversations to gather in-depth information.
- Focus Groups : Group discussions to explore collective opinions and experiences.
- Observations : Watching and recording behaviors in natural settings.
- Document Analysis : Examining existing texts, images, or artifacts.
Researchers often use multiple methods to gain a comprehensive understanding of their topic.
How is qualitative data analysis measured?
Unlike quantitative data, qualitative data analysis isn't measured in traditional numerical terms. Instead, its quality is evaluated based on several criteria.
Trustworthiness is key, encompassing the credibility, transferability, dependability, and confirmability of the findings. The rigor of the analysis - the thoroughness and care taken in data collection and analysis - is another crucial factor.
Transparency in documenting the analysis process and decision-making is essential, as is reflexivity - acknowledging and examining the researcher's own biases and influences.
Employing techniques like member checking and triangulation all contribute to the strength of qualitative analysis.
Benefits of qualitative data analysis
The benefits of qualitative data analysis are numerous. It uncovers rich, nuanced understanding of complex phenomena and allows for unexpected discoveries and new research directions.
By capturing the 'why' behind behaviors and opinions, qualitative data analysis methods provide crucial context.
Qualitative analysis can also lead to new theoretical frameworks or hypotheses and enhances quantitative findings with depth and detail. It's particularly adept at capturing cultural nuances that might be missed in quantitative studies.
Challenges of Qualitative Data Analysis
Researchers face several challenges when conducting qualitative data analysis.
Managing and making sense of large volumes of rich, complex data can lead to data overload. Maintaining consistent coding across large datasets or between multiple coders can be difficult.
There's a delicate balance to strike between providing enough context and maintaining focus on analysis. Recognizing and mitigating researcher biases in data interpretation is an ongoing challenge.
The learning curve for qualitative data analysis software can be steep and time-consuming. Ethical considerations, particularly around protecting participant anonymity while presenting rich, detailed data, require careful navigation. Integrating different types of data from various sources can be complex. Time management is crucial, as researchers must balance the depth of analysis with project timelines and resources. Finally, communicating complex qualitative insights in clear, compelling ways can be challenging.
Best Software to Analyze Qualitative Data
G2 rating: 4.6/5
Pricing: Starts at $30 monthly.
Looppanel is an AI-powered research assistant and repository platform that can make it 5x faster to get to insights, by automating all the manual, tedious parts of your job.
Here’s how Looppanel’s features can help with qualitative data analysis:
- Automatic Transcription: Quickly turn speech into accurate text; it works across 8 languages and even heavy accents, with over 90% accuracy.
- AI Note-Taking: The research assistant can join you on calls and take notes, as well as automatically sort your notes based on your interview questions.
- Automatic Tagging: Easily tag and organize your data with free AI tools.
- Insight Generation: Create shareable insights that fit right into your other tools.
- Repository Search: Run Google-like searches within your projects and calls to find a data snippet/quote in seconds
- Smart Summary: Ask the AI a question on your research, and it will give you an answer, using extracts from your data as citations.
Looppanel’s focus on automating research tasks makes it perfect for researchers who want to save time and work smarter.
G2 rating: 4.7/5
Pricing: Free version available, with the Plus version costing $20 monthly.
ChatGPT, developed by OpenAI, offers a range of capabilities for qualitative data analysis including:
- Document analysis : It can easily extract and analyze text from various file formats.
- Summarization : GPT can condense lengthy documents into concise summaries.
- Advanced Data Analysis (ADA) : For paid users, Chat-GPT offers quantitative analysis of data documents.
- Sentiment analysis: Although not Chat-GPT’s specialty, it can still perform basic sentiment analysis on text data.
ChatGPT's versatility makes it valuable for researchers who need quick insights from diverse text sources.
How to use ChatGPT for qualitative data analysis
ChatGPT can be a handy sidekick in your qualitative analysis, if you do the following:
- Use it to summarize long documents or transcripts
- Ask it to identify key themes in your data
- Use it for basic sentiment analysis
- Have it generate potential codes based on your research questions
- Use it to brainstorm interpretations of your findings
G2 rating: 4.7/5 Pricing: Custom
Atlas.ti is a powerful platform built for detailed qualitative and mixed-methods research, offering a lot of capabilities for running both quantitative and qualitative research.
It’s key data analysis features include:
- Multi-format Support: Analyze text, PDFs, images, audio, video, and geo data all within one platform.
- AI-Powered Coding: Uses AI to suggest codes and summarize documents.
- Collaboration Tools: Ideal for teams working on complex research projects.
- Data Visualization: Create network views and other visualizations to showcase relationships in your data.
G2 rating: 4.1/5 Pricing: Custom
NVivo is another powerful platform for qualitative and mixed-methods research. It’s analysis features include:
- Data Import and Organization: Easily manage different data types, including text, audio, and video.
- AI-Powered Coding: Speeds up the coding process with machine learning.
- Visualization Tools: Create charts, graphs, and diagrams to represent your findings.
- Collaboration Features: Suitable for team-based research projects.
NVivo combines AI capabilities with traditional qualitative analysis tools, making it versatile for various research needs.
Can Excel do qualitative data analysis?
Excel can be a handy tool for qualitative data analysis, especially if you're just starting out or working on a smaller project. While it's not specialized qualitative data analysis software, you can use it to organize your data, maybe putting different themes in different columns. It's good for basic coding, where you label bits of text with keywords. You can use its filter feature to focus on specific themes. Excel can also create simple charts to visualize your findings. But for bigger or more complex projects, you might want to look into software designed specifically for qualitative data analysis. These tools often have more advanced features that can save you time and help you dig deeper into your data.
How do you show qualitative analysis?
Showing qualitative data analysis is about telling the story of your data. In qualitative data analysis methods, we use quotes from interviews or documents to back up our points. Create charts or mind maps to show how different ideas connect, which is a common practice in data analysis in qualitative research. Group your findings into themes that make sense. Then, write it all up in a way that flows, explaining what you found and why it matters.
What is the best way to analyze qualitative data?
There's no one-size-fits-all approach to how to analyze qualitative data, but there are some tried-and-true steps.
Start by getting your data in order. Then, read through it a few times to get familiar with it. As you go, start marking important bits with codes - this is a fundamental qualitative data analysis method. Group similar codes into bigger themes. Look for patterns in these themes - how do they connect?
Finally, think about what it all means in the bigger picture of your research. Remember, it's okay to go back and forth between these steps as you dig deeper into your data. Qualitative data analysis software can be a big help in this process, especially for managing large amounts of data.
In qualitative methods of test analysis, what do test developers do to generate data?
Test developers in qualitative research might sit down with people for in-depth chats or run group discussions, which are key qualitative data analysis methods. They often use surveys with open-ended questions that let people express themselves freely. Sometimes, they'll observe people in their natural environment, taking notes on what they see. They might also dig into existing documents or artifacts that relate to their topic. The goal is to gather rich, detailed information that helps them understand the full picture, which is crucial in data analysis in qualitative research.
Which is not a purpose of reflexivity during qualitative data analysis?
Reflexivity in qualitative data analysis isn't about proving you're completely objective. That's not the goal. Instead, it's about being honest about who you are as a researcher. It's recognizing that your own experiences and views might influence how you see the data. By being upfront about this, you actually make your research more trustworthy. It's also a way to dig deeper into your data, seeing things you might have missed at first glance. This self-awareness is a crucial part of qualitative data analysis methods.
What is a qualitative data analysis example?
A simple example is analyzing customer feedback for a new product. You might collect feedback, read through responses, create codes like "ease of use" or "design," and group similar codes into themes. You'd then identify patterns and support findings with specific quotes. This process helps transform raw feedback into actionable insights.
How to analyze qualitative data from a survey?
First, gather all your responses in one place. Read through them to get a feel for what people are saying. Then, start labeling responses with codes - short descriptions of what each bit is about. This coding process is a fundamental qualitative data analysis method. Group similar codes into bigger themes. Look for patterns in these themes. Are certain ideas coming up a lot? Do different groups of people have different views? Use actual quotes from your survey to back up what you're seeing. Think about how your findings relate to your original research questions.
Which one is better, NVivo or Atlas.ti?
NVivo is known for being user-friendly and great for team projects. Atlas.ti shines when it comes to visual mapping of concepts and handling geographic data. Both can handle a variety of data types and have powerful tools for qualitative data analysis. The best way to decide is to try out both if you can.
While these are powerful tools, the core of qualitative data analysis still relies on your analytical skills and understanding of qualitative data analysis methods.
Do I need to use NVivo for qualitative data analysis?
You don't necessarily need NVivo for qualitative data analysis, but it can definitely make your life easier, especially for bigger projects. Think of it like using a power tool versus a hand tool - you can get the job done either way, but the power tool might save you time and effort. For smaller projects or if you're just starting out, you might be fine with simpler tools or even free qualitative data analysis software. But if you're dealing with lots of data, or if you need to collaborate with a team, or if you want to do more complex analysis, then specialized qualitative data analysis software like NVivo can be a big help. It's all about finding the right tool for your specific research needs and the qualitative data analysis methods you're using.
Here’s a guide that can help you decide.
How to use NVivo for qualitative data analysis
First, you import all your data - interviews, documents, videos, whatever you've got. Then you start creating "nodes," which are like folders for different themes or ideas in your data. As you read through your material, you highlight bits that relate to these themes and file them under the right nodes. NVivo lets you easily search through all this organized data, find connections between different themes, and even create visual maps of how everything relates.
How much does NVivo cost?
NVivo's pricing isn't one-size-fits-all. They offer different plans for individuals, teams, and large organizations, but they don't publish their prices openly. Contact the team here for a custom quote.
What are the four steps of qualitative data analysis?
While qualitative data analysis is often iterative, it generally follows these four main steps:
1. Data Collection: Gathering raw data through interviews, observations, or documents.
2. Data Preparation: Organizing and transcribing the collected data.
3. Data Coding: Identifying and labeling important concepts or themes in the data.
4. Interpretation: Drawing meaning from the coded data and developing insights.
Follow us on
Get the best resources for ux research, in your inbox, related articles.
Resources & Guides
February 15, 2024
How to use AI for Qualitative Data Analysis

August 15, 2024
Transcription in Qualitative Research: A Comprehensive Guide for UX Researchers

May 22, 2024
Triangulation in Qualitative Research: A Comprehensive Guide [2024]
Looppanel automatically records your calls, transcribes them, and centralizes all your research data in one place
Formaldehyde contamination in seafood industry: an update on detection methods and legislations
- Review Article
- Published: 03 September 2024
Cite this article

- Naresh Kumar Mehta ORCID: orcid.org/0000-0002-0688-886X 1 na1 ,
- Anand Vaishnav 1 na1 ,
- Mocherla Bhargavi Priyadarshini 1 ,
- Payel Debbarma 1 ,
- Mohammad Sazedul Hoque 2 ,
- Pronoy Mondal 2 ,
- Mahmud Ab Rashid Nor-Khaizura 3 , 4 ,
- Gioacchino Bono 5 , 6 ,
- Pankaj Koirala 7 ,
- Aikkarach Kettawan 7 &
- Nilesh Prakash Nirmal 7 na1
1 Altmetric
Seafood is abundant in high-quality protein, healthy fats (n-3 and n-6 PUFAs), minerals (calcium, magnesium, copper, selenium, and so on), and vitamin D. Functional compounds in seafood can protect against lifestyle-related diseases. Having had all the merits mentioned, it is also a highly putrefiable food item. To maintain quality and prolong seafood’s shelf life, various chemicals have been added, including nitrite, sulfur dioxide, and formaldehyde. In this review, we summarize the uses, the incidence of added formalin contamination, and the approved limit for seafood products. Additionally, worldwide regulations or standards for the use of formalin in seafood products, as well as recent changes relevant to new methods, are highlighted. Although strict limits and regulations have been placed on the utilization of formaldehyde for seafood preservation, there are few incidences reported of formalin/formaldehyde detection in seafood products around Asian countries. In this context, various qualitative and quantitative detection methods for formaldehyde have been developed to ensure the presence of formaldehyde within acceptable limits. Besides this, different rules and regulations have been forced by each country to control formaldehyde incidence. Although it is not an issue of formaldehyde incidence in European countries, strict regulations are implemented and followed.
This is a preview of subscription content, log in via an institution to check access.
Access this article
Subscribe and save.
- Get 10 units per month
- Download Article/Chapter or eBook
- 1 Unit = 1 Article or 1 Chapter
- Cancel anytime
Price includes VAT (Russian Federation)
Instant access to the full article PDF.
Rent this article via DeepDyve
Institutional subscriptions
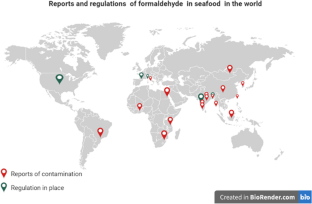
Biogenic amines in seafood: a review, a method for identification of exogenous formaldehyde in bombay duck ( harpodon nehereus ).

Organoleptic quality and formaldehyde content of mackerel marketed in Dar es Salaam, Tanzania
Explore related subjects.
- Environmental Chemistry
Data availability
The data sets generated are available from the corresponding author upon reasonable request.
AFSSA (2004) Evaluation des risques lies a la presence de formaldéhyde dans les aliments. Agence Francaise de Securite Sanitire des Aliments. https://www.anses.fr/en/system/files/NUT2004sa0363ErEN.pdf . Accessed Jan 2024 to June 2024
Agrinnovateindia.co.in (n.d.) CIFLIN®-Kit for detection of formaldehyde in fish. https://www.agrinnovateindia.co.in/subTechnologyDescription?id=470&Subtitle=CIFLIN%C2%AE-Kit%20for%20Detection%20of%20Formaldehyde%20in%20Fish&Techtitle=ICAR-Central%20Inland%20Fisheries%20Research%20Institute%20(CIFRI) . Accessed Jan 2024 to June 2024
Aksornneam L, Kanatharana P, Thavarungkul P, Thammakhet C (2016) 5-Aminofluorescein doped polyvinyl alcohol film for the detection of formaldehyde in vegetables and seafood. Anal Methods 8(6):1249–1256. https://doi.org/10.1039/C5AY02719E
Article CAS Google Scholar
Aminah AS, Zailina H, Fatimah AB (2013) Health risk assessment of adults consuming commercial fish contaminated with formaldehyde. Food Public Health 3(1):52–58. https://doi.org/10.5923/j.fph.20130301.06
Article Google Scholar
Anissah U, Putri AK, Barokah GR (2019) An estimation of endogenous formaldehyde exposure due to consumption of Indonesian opah fish ( Lampris guttatus ) in three major export destination countries. Squalen Bull Mar Fish Postharvest Biotechnol 14(1):1–8. https://doi.org/10.15578/squalen.v14i1.369
Anissah U, Ariyani F, Barokah G, Januar HI (2021) NMR metabolomics of Saurida tumbil fish treated with formaldehyde solution as misconduct food preservation method. J Aquat Food Prod Technol 30(3):263–270. https://doi.org/10.1080/10498850.2021.1880510
Arumsari GP, Krianto T, Wispriyono B (2016) Behaviour of traders and manufacturers in the use of formalin in wet noodle and tofu in Jakarta. J Kesehat Masy Andalas 11(1):39–48. https://doi.org/10.24893/jkma.v11i1.261
Asare-Donkor NK, Adaagoam RA, Voegborlo RB, Adimado AA (2018) Risk assessment of Kumasi metropolis population in Ghana through consumption of fish contaminated with formaldehyde. J Toxicol 2018:4785031. https://doi.org/10.1155/2018/4785031
ASEAN (2013) Guidelines for the use of chemicals in aquaculture and measures to eliminate the use of harmful chemicals. Jakarta: ASEAN Secretariat. https://asean.org/wp-content/uploads/2021/09/ASEAN-Guideliness-forChemicals.pdf . Accessed Jan 2024 to June 2024
Asmawati A, Ahmadi A, Saputrayadi A (2021) Analysis of the use of formalin as a seafood preservative by traders at Mataram city traditional market. J Agrikan (agribisnis Perikanan) 14(2):367–375. https://doi.org/10.52046/agrikan.v14i2.367-375
Barokah GR, Anissah U, Januar HI, Ariyani F (2023) Mathematical formulation to differentiate between naturally occurred and artificially added formaldehyde in the ice stored of lizardfish ( Saurida tumbil ). Omni-Akuatika 19(1):27–33. https://doi.org/10.20884/1.oa.2023.19.1.952
BCSIR (2023) Formalin detection kit for fish and milk. Bangladesh Council of Scientific and Industrial Research. https://ifst.bcsir.gov.bd/site/notices/caee1e34-b839-42f0-87ac-2d5da620a33b/Formalin-detection-kit-for-fish-and-Milk . Accessed Jan 2024 to June 2024
BfR (2020) Fillable articles made from melamine formaldehyde resin, such as coffee-to-go cups sold as ‘Bambooware’, may leak harmful substances into hot foods. BfR opinion No 046/2019 issued 25 November 2020. https://doi.org/10.17590/20200123-134155
Bhowmik S, Begum M, Alam AN (2020) Formaldehyde-associated risk assessment of fish sold in local markets of Bangladesh. Agric Res 9(1):102–108. https://doi.org/10.1007/s40003-019-00414-w
Bhowmik S, Begum M, Hossain MA, Rahman M, Alam AKMN (2017) Determination of formaldehyde in wet marketed fish by HPLC analysis: a negligible concern for fish and food safety in Bangladesh. Egypt J Aquat Res 43(3):245–248. https://doi.org/10.1016/j.ejar.2017.08.001
Bianchi F, Careri M, Musci M, Mangia A (2007) Fish and food safety: determination of formaldehyde in 12 fish species by SPME extraction and GC-MS analysis. Food Chem 100(3):1049–1053. https://doi.org/10.1016/j.foodchem.2005.09.089
BuRO (2021) Advice From BuRO on the health risks of bamboo cups. The Netherlands Food and Consumer Product Safety Authority. https://english.nvwa.nl/documents/consumers/food/safety/documents/advice-from-buro-on-the-health-risks-of-bamboo-cups . Accessed Jan 2024 to June 2024
Chandralekha A, Baranage C, Samarajeewa U (2017) Formaldehyde levels in fish from the Kandy market. J Natl Sci Found Sri Lanka. 20(1):115–121. https://dl.nsf.gov.lk/bitstream/handle/1/6096/JNSF%2020_1_115.pdf?sequence=1 . Accessed Jan 2024 to June 2024
Chutia BC, Borah MP, Bordoloi U, Goswami LM, Bharadwaj S, Borthakur M, ... Borkataki S (2024) Qualitative detection of formaldehyde in challani fish obtained from selected fish markets of Nagaon, Assam, India. Discov Environ 2(1):26. https://doi.org/10.1007/s44274-024-00056-y
CIFT (2019) Guidance note on formaldehyde in fish. Central Institute of Fisheries Technology. https://www.google.com/search?q=9102f051224d%2FGuidance_Note_FormalineFish_20_07_2018.pdf&oq=9102f051224d%2FGuidance_Note_Formaline_Fish_20_07_2018.pdf&aqs=chrome..69i57j69i58.1213j0j7&sourceid=chrome&ie=UTF-8 . Accessed Jan 2024 to June 2024
Commission European (2018) Commission Implementing Regulation (EU) 2018/183 of 7 February 2018 concerning the denial of authorisation of formaldehyde as a feed additive belonging to the functional groups of preservatives and hygiene condition enhancers. http://data.europa.eu/eli/reg_impl/2018/183/oj . Accessed Jan 2024 to June 2024
Cruz JCD, Garcia RG, Collado ANM, Jovero RJS, Macalangcom RV, Tud RC (2019) Formalin on fresh tilapia via electronic nose and assessment of toxicity levels with reference to average adult Filipino weight. In: 2019 IEEE 11th International Conference on Humanoid, Nanotechnology, Information Technology, Communication and Control, Environment, and Management (HNICEM). IEEE, p 1–6. https://doi.org/10.1109/HNICEM48295.2019.9072914
De Mesquita Cunha M, Rodrigues CR, Ferreira VS, Rodrigues AR, Alves SR, Chaves DA et al (2015) EFICIÃ? NCIA DO MÃ? TODO DE ESPECTROMETRIA DE MASSAS EM DROGAS DE ABUSO. Rev EVS-Rev Cienc Ambient Saude 42(4):409–423. https://doi.org/10.18224/est.v42i4.4356
De Souza A, Cunha ICM, Chagas JO, Pontes Carlos EB, Santos LL, Campos e Figueredo TR et al (2017) Use of mass spectrometry for the determination of formaldehyde in samples potentially toxic to humans: a brief review. Mass Spectrom. https://doi.org/10.5772/intechopen.68922
Delbono V, Larch CP, Newlands KC, Rhydderch S, Baddeley TC, Storey JMD (2022) Novel method of analysis for the determination of residual formaldehyde by high-performance liquid chromatography. Int J Anal Chem 2022. https://doi.org/10.1155/2022/9171836
Devaraj P, Babu V, Cengiz EI (2021) Qualitative detection of formaldehyde and ammonia in fish and other seafoods obtained from Chennai’s (India) fish markets. Environ Monit Assess 193:1–8. https://doi.org/10.1007/s10661-021-08871-z
Dhruve D, Shalini R, Shakila RJ, Lowanshi A, Arisekar U, Jeyasekaran G, Neethiselvan N (2022) Detection of free and bound formaldehyde concentration in commercially important fishes and their effect on cooking: a preliminary study. Pharma Innov 11(9S):3048–3053. https://doi.org/10.22271/tpi.2022.v11.i9Saj.15939
Duarte AM, Silva F, Pinto FR, Barroso S, Gil MM (2020) Quality assessment of chilled and frozen fish—mini review. Foods 9(12):1739. https://doi.org/10.3390/foods9121739
EFSA (2014a) Endogenous formaldehyde turnover in humans compared with exogenous contribution from food sources. EFSA J 12(2):1–11. https://doi.org/10.2903/j.efsa.2014.3550
EFSA (2014b) Scientific opinion on the safety and efficacy of formaldehyde for all animal species based on a dossier submitted by Adiveter S.L. EFSA J 12(2). https://doi.org/10.2903/j.efsa.2014.3562
Eills J, Budker D, Cavagnero S, Chekmenev EY, Elliott SJ, Jannin S et al (2023) Spin hyperpolarization in modern magnetic resonance. Chem Rev 123(4):1417–1551. https://doi.org/10.1021/acs.chemrev.2c00534
Ekinci Dogan C, Sancı R (2015) Formaldehyde migration in aqueous extracts from paper and cardboard food packaging materials in Turkey. Food Addit Contam Part B 8(3):221–226. https://doi.org/10.1080/19393210.2015.1057872
Encyclopedia of Cancer (2019) https://www.sciencedirect.com/referencework/9780128124857/encyclopedia-of-cancer . Accessed Jan 2024 to June 2024
European Union (2008) Regulation (EC) No 1272/2008 of the European Parliament and of the Council of 16 December 2008 on classification, labelling and packaging of substances and mixtures, amending and repealing directives 67/548/EEC and 1999/45/EC, and amending regulation (EC) No 1907/2006. http://data.europa.eu/eli/reg/2008/1272/oj . Accessed Jan 2024 to June 2024
Fappiano L, Carriera F, Iannone A, Notardonato I, Avino P (2022) A review on recent sensing methods for determining formaldehyde in agri-food chain: a comparison with the conventional analytical approaches. Foods 11(9):1351. https://doi.org/10.3390/foods11091351
FSSAI (2019) Direction under Section 16 (5) of Food Safety and Standards Act, 2006 regarding operationalisation of the food safety and standards (contaminants, toxins and residues) amendment regulation, 2018 relating to limit of formaldehyde in fresh water and marine fish. Food Safety and Standard Authority of India. https://fssai.gov.in/upload/Formalin.contamination.in.fish.advisories/2019/06/5cfe3cfa54f82Direction_Limit_Fisheries_Product_10_06_2019.pdf . Accessed Jan 2024 to June 2024
FSSAI (2023) Manual of methods of analysis of foods fish and fish products. Food Safety and Standard Authority of India. https://www.fssai.gov.in/upload/uploadfiles/files/Manual_Fish_05_01_2023_compressed.pdf . Accessed Jan 2024 to June 2024
Garcia A, Barbas C (2011) Gas chromatography-mass spectrometry (GC-MS)-based metabolomics. In: Metabolic profiling: methods and protocols. p 191–204. https://doi.org/10.1007/978-1-61737-985-7_11
Goon S, Bipasha M, Islam MS, Hossain MB (2014) Fish marketing status with formalin treatment in Bangladesh. Int J Public Health Sci 3(2):95. https://doi.org/10.11591/.v3i2.4680
Gu D-C, Zou M-J, Guo X-X, Yu P, Lin Z-W, Hu T et al (2017) A rapid analytical and quantitative evaluation of formaldehyde in squid based on Tri-step IR and partial least squares (PLS). Food Chem 229:458–463. https://doi.org/10.1016/j.foodchem.2017.02.082
Han XX, Rodriguez RS, Haynes CL, Ozaki Y, Zhao B (2021) Surface-enhanced Raman spectroscopy. Nat Rev Methods Prim 1(1):87. https://doi.org/10.1038/s43586-021-00083-6
He Y, Xu W, Qu M, Zhang C, Wang W, Cheng F (2022) Recent advances in the application of Raman spectroscopy for fish quality and safety analysis. Comp Rev Food Sci Food Saf 21(4):3647–3672. https://doi.org/10.1111/1541-4337.12968
Hladová M, Martinka J, Rantuch P, Nečas A (2019) Review of spectrophotometric methods for determination of formaldehyde. Res Pap Fac Mater Sci Technol Slovak Univ Technol 27(44):105–120. https://doi.org/10.2478/rput-2019-0012
Hoque MS, Jacxsens L, De Meulenaer B, Alam AN (2016) Quantitative risk assessment for formalin treatment in fish preservation: food safety concern in local market of Bangladesh. Procedia Food Sci 6:151–158. https://doi.org/10.1016/j.profoo.2016.02.037
Hoque MS, Jacxsens L, Rahman MB, Nowsad AA, Azad SO, De Meulenaer B et al (2018) Evaluation of artificially contaminated fish with formaldehyde under laboratory conditions and exposure assessment in freshwater fish in Southern Bangladesh. Food Control 84:1–9. https://doi.org/10.1016/j.chemosphere.2017.12.111
IARC (2004) Monographs on the evaluation of carcinogenic risk to humans – yearbook 88. International Agency for Research on Cancer. https://monographs.iarc.who.int/wp-content/uploads/2018/06/mono88.pdf . Accessed Jan 2024 to June 2024
IARC (2012) A review of human carcinogens: chemical agents and related occupations. IARC Monogr Eval Carcinog Risks to Humans 100:225–248. https://www.ncbi.nlm.nih.gov/books/NBK304416/
IFAS Extension (2024) Formalin Use in Aquaculture. https://edis.ifas.ufl.edu/publication/VM061 . Accessed 09 January 2024
Immaculate J, Jamila P (2018) Quality characteristics including formaldehyde content in selected sea foods of Tuticorin, southeast coast of India. Int Food Res J 25(1):293–302. http://www.ifrj.upm.edu.my/25%20(01)%202018/(39).pdf . Accessed Jan 2024 to June 2024
Islam R, Mahmud S, Aziz A, Sarker A, Nasreen M (2015) A comparative study of present status of marketing of formalin treated fishes in six districts of Bangladesh. Food Nutr Sci 06(01):124–134. https://doi.org/10.4236/fns.2015.61013
Jaman N, Hoque MS, Chakraborty SC, Hoq ME, Seal HP (2015) Determination of formaldehyde content by spectrophotometric method in some fresh water and marine fishes of Bangladesh. Int J Fish Aquat Stud 2(6):94–98. https://www.fisheriesjournal.com/archives/2015/vol2issue6/PartB/2-5-32.pdf . Accessed Jan 2024 to June 2024
Jiang L, Hu Q, Chen T, Min D, Yuan HQ, Bao GM (2020) Highly sensitive and rapid responsive fluorescence probe for determination of formaldehyde in seafood and in vivo imaging application. Spectrochim Acta Part A Mol Biomol Spectrosc 228:117789. https://doi.org/10.1016/j.saa.2019.117789
Jinadasa BKKK, Elliott C, Jayasinghe GDTM (2022) A review of the presence of formaldehyde in fish and seafood. Food Control 136:108882. https://doi.org/10.1016/j.foodcont.2022.108882
Joshi R, Bhatta R, Paudel PN, Kafle BK (2015) Formaldehyde content of selected fish from the wet markets of Kathmandu valley. Int Food Res J 22(4):1434. http://www.ifrj.upm.edu.my/22%20(04)%202015/(18).pdf . Accessed Jan 2024 to June 2024
Kaneko G, Ushio H, Ji H (2019) Application of magnetic resonance technologies in aquatic biology and seafood science. Fish Sci 85(1):1–17. https://doi.org/10.1007/s12562-018-1266-6
Karu K, Hornshaw M, Woffendin G, Bodin K, Hamberg M, Alvelius G, Griffiths WJ (2007) Liquid chromatography-mass spectrometry utilizing multi-stage fragmentation for the identification of oxysterols. J Lipid Res 48(4):976–987. https://doi.org/10.1194/jlr.M600497-JLR200
Kashyap A, Chakraborty B, Siddiqui MS, Tyagi H, Kalita H (2023) Selective and sensitive detection of formaldehyde at room temperature by tin oxide nanoparticles/reduced graphene oxide composite. ACS Appl Nano Mater 6(9):7948–7959. https://doi.org/10.1021/acsanm.0c02033
Khan MK (2013) Food adulteration and its effect on health. Community Based Med J 2(2):1–3. https://www.cbmcb.org/download/journal/Editorial.pdf . Accessed Jan 2024 to June 2024
Kontominas MG, Badeka AV, Kosma IS, Nathanailides CI (2021) Innovative seafood preservation technologies: recent developments. Animals 11(1):92. https://doi.org/10.3390/ani11010092
Kundu A, Dey P, Bera R, Sarkar R, Kim B, Kacew S et al (2020) Adverse health risk from prolonged consumption of formaldehyde-preserved carps in eastern region of Indian population. Environ Sci Pollut Res 27(14):16415–16425. https://doi.org/10.1007/s11356-020-08305-0
Laly SJ, Priya ER, Panda SK, Zynudheen AA (2018) Formaldehyde in seafood: a review. https://krishi.icar.gov.in/jspui/bitstream/123456789/20617/1/Formaldehyde%20in%20Seafood%20A%20review.pdf . Accessed Jan 2024 to June 2024
Letertre MP, Giraudeau P, De Tullio P (2021) Nuclear magnetic resonance spectroscopy in clinical metabolomics and personalized medicine: current challenges and perspectives. Front Mol Biosci 8:698337. https://doi.org/10.3389/fmolb.2021.698337
Lin C, Li Y, Peng Y, Zhao S, Xu M, Zhang L, Yang Y (2023) Recent development of surface-enhanced Raman scattering for biosensing. J Nanobiotechnology 21(1):149. https://doi.org/10.1186/s12951-023-01890-7
Lovestead T, Urness K (2019) Gas chromatography-mass spectrometry (GC−MS). https://tsapps.nist.gov/publication/get_pdf.cfm?pub_id=926655
Ma H, Haque M, Afmiu Z, Aziz M, Sharmin K (2020) Association of natural formaldehyde level with quality attributes of selected sea fish, collected from southeast coast of Bangladesh. Sci Res J 8(4):1–7. https://doi.org/10.31364/SCIRJ/v8.i4.2020.P0420757
Malaysian Food Regulations 1985 (2006) In Food Act 1983 & regulations. International Law Book Services. https://faolex.fao.org/docs/pdf/mal27309.pdf . Accessed Jan 2024 to June 2024
Manna SK, Achar TK, Mondal S (2021) Recent advances in selective formaldehyde detection in biological and environmental samples by fluorometric and colorimetric chemodosimeters. Anal Methods 13(9):1084–1105. https://doi.org/10.1039/D0AY02201A
Manyanga VP, Uledi MA, Makoye PM, Daniel IJ, Shedafa R, Masota NE ... Kaale E (2024) Organoleptic quality and formaldehyde content of mackerel marketed in Dar es Salaam, Tanzania. Food Saf Risk 11(1):1. https://doi.org/10.1186/s40550-024-00107-5
Mastracci L, Gambella A, Bragoni A, Pigozzi S, Pastorino L, Vanni I et al (2019) Coping with formalin banning in pathology: under vacuum long-term tissue storage with no added formalin. Histochem Cell Biol 151(6):501–511. https://doi.org/10.1007/s00418-019-01765-0
Mathaweesansurn A, Detsri E (2022) A new colorimetric method for determination of formaldehyde in sea food based on anti-aggregation of gold nanoparticles. J Food Compos Anal 114:104802. https://doi.org/10.1016/j.jfca.2022.104802
Mehta NK, Chouksey MK, Balange AK, Tripathi G, Nayak BB (2017) Physicochemical and gel properties of myofibrillar protein from sin croaker (Johnius dussumieri) fish during ice storage. J Aquat Food Prod Technol 26(1):71–85. https://doi.org/10.1080/10498850.2015.1092485
Mehta NK, Majumdar RK, Pal D, Priyadarshini MB, Dhar B (2021) Screening of fish from retail markets for the presence of formalin and its effect on the quality of fresh catla. Indian J Anim Health 60(2):244–252. https://doi.org/10.36062/ijah.2021.spl.01121
Mehta NK, Rout B, Balange AK, Nayak BB (2023a) Dynamic viscoelastic behaviour, gelling properties of myofibrillar proteins and histological changes in shrimp ( L . vannamei ) muscles during ice storage. Aquacult Fish 8(2):180–189. https://doi.org/10.1016/j.aaf.2021.08.011
Mehta NK, Pal D, Majumdar RK, Priyadarshini MB, Das R, Debbarma G, Acharya PC (2023b) Effect of artificial formaldehyde treatment on textural quality of fish muscles and methods employed for formaldehyde reduction from fish muscles. Food Chem Adv 3:100328. https://doi.org/10.1016/j.focha.2023.100328
MINSAN-telegram (1985) MINSAN-telegram no. 703/3266/6/1377 08.11.1985. World J Eng Technol 3(3C):256–262. https://doi.org/10.4236/wjet.2015.33C040
Morisasa M, Kimura K, Sumida M, Fukumoto S, Tamura T, Takeuchi R, ... Goto-Inoue N (2020) Application of matrix-assisted laser desorption/ionization massspectrometry imaging for evaluating the quality of fish fillets. Foods 9(4):402. https://doi.org/10.3390/foods9040402
Nagana Gowda GA, Raftery D (2022) Quantitative NMR methods in metabolomics. In: Ghini V, Stringer KA, Luchinat C (eds) Metabolomics and its impact on health and diseases. Springer International Publishing, Cham, pp 143–164. https://doi.org/10.1007/164_2022_612
Chapter Google Scholar
Nash T (1953) The colorimetric estimation of formaldehyde by means of the Hantzsch reaction. Biochem J 55(3):416. https://doi.org/10.1042/bj0550416
Natsir M, Nurdin M, Syah ZR, Astuti SD, Azis T, Mulkiyan LOMZ, ... Maulidiyah M (2024) Design and fabrication of a high-performance sensor for formaldehyde detection based on graphene-TiO2/Ag electrode. Surf Eng Appl Electrochem 60(2):247–255. https://doi.org/10.3103/S1068375524020078
Nayana A and Sabu (2018) Incidence of formaldehyde residues in fresh seer fish (Scomberomorus guttatus) collected from Ernakulam fish market. Indian J Sci Res. 19(2):56–61. https://www.researchgate.net/publication/326200187_INCIDENCE_OF_FORMALDEHYDE_RESIDUES_IN_FRESH_SEER_FISH_Scomberomorus_guttatus_COLLECTED_FROM_ERNAKULAM_FISH_MARKET . Accessed Jan 2024 to June 2024
Nielsen SS, Ismail BP (2017) Mass spectrometry with high-performance liquid chromatography. In: Suzanne Nielsen S (ed) Food analysis laboratory manual. Springer International Publishing, Cham, pp 97–104. https://doi.org/10.1007/978-3-319-44127-6_9
Nirmal NP, Santivarangkna C, Rajput MS, Benjakul S, Maqsood S (2022) Valorization of fish byproducts: sources to end-product applications of bioactive protein hydrolysate. Compr Rev Food Sci Food Saf 21(2):1803–1842. https://doi.org/10.1111/1541-4337.12917
Nirmal KV, Pillay VV, Ramakrishnan, UK, Arathy SL, Bhaskaran R (2021) Estimation of formaldehyde contamination in selected sea fish species sold in Ernakulam District of Kerala State. J Punjab Acad Forensic Med Toxicol 2021; 21(1):83–90. https://doi.org/10.5958/0974-083X.2021.00014.5
Noor Aini B, Siddiquee S, Ampon K (2016) Development of formaldehyde biosensor for determination of formalin in fish samples; malabar red snapper (Lutjanus malabaricus) and longtail tuna (Thunnus tonggol). Biosensors 6(3):32. https://doi.org/10.3390/bios6030032
Noordiana N, Fatimah AB, Farhana YCB (2011) Formaldehyde content and quality characteristics of selected fish and seafood from wet markets. Int Food Res J 18(1). http://www.ifrj.upm.edu.my/18%20(01)%202011/(13)%20IFRJ-2010-073%20Noordiana[1].pdf . Accessed Jan 2024 to June 2024
Nowshad F, Islam MN, Khan MS (2018) Concentration and formation behavior of naturally occurring formaldehyde in foods. Agric Food Secur 7(1):17. https://doi.org/10.1186/s40066-018-0166-4
Nurlely AM, Yook Heng L, Ling TL (2021) Potentiometric enzyme biosensor for rapid determination of formaldehyde based on succinimide-functionalized polyacrylate ion-selective membrane. Measurement 175:109112. https://doi.org/10.1016/j.measurement.2021.109112
Paul L, Mondal DK, Paul M, Riar MGS, Ali A (2014) Intensity of formalin misuse for fish preservation in five markets of Jessore district, Bangladesh. Int J Nat Sci 77–81. http://ijnss.org/wp-content/uploads/2014/12/IJNSS-V1I2-11-pp-77-81.pdf . Accessed Jan 2024 to June 2024
Peng Y, Zhang Z, He L, Li C, Liu M (2024) NMR spectroscopy for metabolomics in the living system: recent progress and future challenges. Anal Bioanal Chem 1–16. https://doi.org/10.1007/s00216-024-05137-8
Rahman S, Majumder MAA, Ahasan R, Ahmed SM, Das P, Rahman N (2016) The extent and magnitude of formalin adulteration in fish sold in domestic markets of Bangladesh: a literature review. Int J Consum Stud 40(2):152–159. https://doi.org/10.1111/ijcs.12238
Rahman MM, Ahmed S, Hosen MM, Talukder AK (2012) Detection of formalin and quality characteristics of selected fish from wet markets at Sylhet city in Bangladesh. Bangladesh Res Publ J 7(2):161–169. https://www.researchgate.net/profile/Md-Rahman-297/publication/299820574_DETECTION_OF_FORMALIN_AND_QUALITY_CHARACTERISTICS_OF_SELECTED_FISH_FROM_WET_MARKETS_AT_SYLHET_CITY_IN_BANGLADESH/links/5705b5f508ae13eb88b97bd3/DETECTION-OF-FORMALIN-AND-QUALITY-CHARACTERISTICS-OF-SELECTED-FISH-FROM-WET-MARKETS-AT-SYLHET-CITY-IN-BANGLADESH.pdf . Accessed Jan 2024 to June 2024
Rathod NB, Nirmal NP, Pagarkar A, Özogul F, Rocha JM (2022) Antimicrobial impacts of microbial metabolites on the preservation of fish and fishery products: a review with current knowledge. Microorganisms 10(4):773. https://doi.org/10.3390/microorganisms10040773
Rovina K, Vonnie JM, Shaeera SN, Yi SX, Halid NFA (2020) Development of biodegradable hybrid polymer film for detection of formaldehyde in seafood products. Sens Bio-Sens Res 27:100310. https://doi.org/10.1016/j.sbsr.2020.100310
Saha S, Sahoo P (2021) Luminescence turn-on response of naphthalene diimide based chemosensor with formaldehyde: a novel stratagem for estimation of formaldehyde in storage fish samples. Bioorg Med Chem Lett 49:128287. https://doi.org/10.1016/j.bmcl.2021.128287
Sahu SK, Mehta NK, Samantaray S, Majumdar RK (2018) Incidence of formalin in fishes in Asian countries: some solutions. World Aquacult 43(9):66–69. https://www.was.org/Magazine/ArticleContent/1440 . Accessed Jan 2024 to June 2024
Sanyal S, Sinha K, Saha S, Banerjee S (2017) Formalin in fish trading: an inefficient practice for sustaining fish quality. Arch Pol Fish 25(1):43–50. https://doi.org/10.1515/aopf-2017-0005
Senthong P, Sirikitputtisak T, Wittayasilp S (2021) Determination of formaldehyde in fresh seafood under different washing and cooking conditions. Int J Food Saf Nutr Public Health 6(2):158–166. https://doi.org/10.1504/IJFSNPH.2021.113405
Shen Y, Wang WF, Wu YY (2015) A method for identification of exogenous formaldehyde in Bombay duck ( Harpodon nehereus ). Food Anal Methods 8:2474–2481. https://doi.org/10.1007/s12161-015-0138-2
Suwanaruang T (2018) Formalin contaminated in seafood and frozen meat at Somdet Market, Kalasin Province. J Environ Prot 9(12):1286–1293. https://doi.org/10.4236/jep.2018.912080
Thazin Y, Eamsa-Ard T, Pobkrut T, Kerdcharoen T (2019) Formalin adulteration detection in food using E-nose based on nanocomposite gas sensors. In: 2019 IEEE International Conference on Consumer Electronics-Asia (ICCE-Asia). IEEE, p 64–67. https://doi.org/10.1109/ICCE-Asia46551.2019.8941601
TNJFU (2020) Technology Release. https://www.tnjfu.ac.in/directorates/othersdir/dor/downloads/Technology-Release-English.pdf . Accessed Jan 2024 to June 2024
USEPA (1988) Health and environmental effects profile for formaldehyde. https://cfpub.epa.gov/ncea/risk/recordisplay.cfm?deid=49092 . Accessed Jan 2024 to June 2024
Valadares J, Majik MS, Tilve SG (2021) Comparison of the formaldehyde content in Indian mackerel ( Rastrelliger kanagurta ) fish using high performance liquid chromatography and UV-Vis spectrophotometry. J Aquat Food Prod Technol 30(8):980–987. https://doi.org/10.1080/10498850.2021.1961961
Vongkhampheang C, Lorbiayao B, Sulyya S, Keovongsuk V, Oudone P (2023) Detection of formalin in seafoods at markets and wholesaler-retailer stores (Case study: Xaythany District and Xaysetha District, Vientiane capital). Sujournal 9(1):286–294. http://www.su-journal.com/index.php/su/article/view/364 . Accessed Jan 2024 to June 2024
Wahed P, Razzaq MdA, Dharmapuri S, Corrales M (2016) Determination of formaldehyde in food and feed by an in-house validated HPLC method. Food Chem 202:476–483. https://doi.org/10.1016/j.foodchem.2016.01.136
Wang C, Gao Y, Qiu X, Nie L, Liu Y, Zhou R, Xiong S (2024) A rapid and interference-resistant formaldehyde detection method based on surface-enhanced Raman spectroscopy with a reaction-induced self-amplification strategy. Chemosensors 12(7):132. https://doi.org/10.3390/chemosensors12070132
Wang S, Cui X, Fang G (2007) Rapid determination of formaldehyde and sulphur dioxide in food products and Chinese herbals. Food Chem 103:1487–1493. https://doi.org/10.1016/j.foodchem.2006.09.023
WHO (World Health Organization) (2002) Formaldehyde. Concise International Chemical Assessment, Document 40, Geneva, Switzerland. https://apps.who.int/iris/handle/10665/42430 . Accessed Jan 2024 to June 2024
Wijaya DR, Syarwan NF, Nugraha MA, Ananda D, Fahrudin T, Handayani R (2023) Seafood quality detection using electronic nose and machine learning algorithms with hyperparameter optimization. IEEE Access. https://doi.org/10.1109/ACCESS.2023.3286980
Wongniramaikul W, Limsakul W, Choodum A (2018) A biodegradable colorimetric film for rapid low-cost field determination of formaldehyde contamination by digital image colorimetry. Food Chem 249:154–161. https://doi.org/10.1016/j.foodchem.2018.01.021
World Health Organization (2001) Organic pollutants: formaldehyde. In: Air quality guidelines for Europe. Copenhagen: WHO Regional Office for Europe. https://apps.who.int/iris/handle/10665/107335 . Accessed Jan 2024 to June 2024
World Health Organization (2020) Code of practice for fish and fishery product. https://iris.who.int/bitstream/handle/10665/336524/9789240013179-eng.pdf . Accessed Jan 2024 to June 2024
WTO (World Trade Organization) (2022) Technical barriers to trade. https://docs.wto.org/dol2fe/Pages/SS/directdoc.aspx?filename=q:/G/TBTN22/EU888.pdf&Open=True . Accessed 09 January 2024
Yasin M, Irawati N, Zaidan AH, Mukti AT, Soegianto A, Rosalia DKP, Perego AM (2019) Fiber bundle sensor for detection of formaldehyde concentration in fish. Opt Fiber Technol 52:101984. https://doi.org/10.1016/j.yofte.2019.101984
Yasuhara A, Shibamoto T (1995) Quantitative analysis of volatile aldehydes formed from various kinds of fish flesh during heat treatment. J Agric Food Chem 43:94–97. https://doi.org/10.1021/jf00049a017
Yeasmin T, Reza MS, Khan MNA, Shikha FH, Kamal M (2010a) Present status of marketing of formalin treated fishes in domestic markets at Mymensingh district in Bangladesh. Int J Biol Res 1(4):21–24. https://www.researchgate.net/profile/Dr_Md_Reza/publication/268304955_Present_status_of_marketing_of_formalin_treated_fishes_in_domestic_markets_at_Mymensingh_district_in_Bangladesh/links/546ae74a0cf2f5eb18078352/Present-status-of-marketing-of-formalin-treated-fishes-in-domestic-markets-at-Mymensingh-district-in-Bangladesh.pdf . Accessed Jan 2024 to June 2024
Yeasmin T, Reza MS, Shikha FH, Khan MNA, Kamal M (2010b) Quality changes in formalin treated rohu fish ( Labeo rohita , Hamilton) during ice storage condition. Asian J Agric Sci 2(4):158–163. https://maxwellsci.com/print/ajas/v2-158-163.pdf . Accessed Jan 2024 to June 2024
Yeerum C, Issarangkura Na Ayutthaya P, Kesonkan K, Kiwfo K, Boochathum P, Grudpan K, Vongboot M (2022) Modified natural rubber as a simple chemical sensor with smartphone detection for formaldehyde content in a seafood sample. Molecules 27(7):2159. https://doi.org/10.3390/molecules27072159
Yeh TS, Lin TC, Chen CC, Wen HM (2013) Analysis of free and bound formaldehyde in squid and squid products by gas chromatography–mass spectrometry. J Food Drug Anal 21(2):190–197. https://doi.org/10.1016/j.jfda.2013.05.010
Zhang L (2018) Formaldehyde: exposure, toxicity and health effects. Vol. 37. Royal Society of Chemistry. https://books.google.co.in/books?hl=en&lr=&id=cSFdDwAAQBAJ&oi=fnd&pg=PA1&dq=103.%09Zhang+L.+2018.+Formaldehyde:+exposure,+toxicity+and+health+effects.+Vol.+37.+Royal+Society+of+Chemistry.&ots=t889wNmhwk&sig=1UsXWdvGqq6U-HV5BA93vCg2P3o&redir_esc=y#v=onepage&q&f=false . Accessed Jan 2024 to June 2024
Zhang Z, Zhao C, Ma Y, Li G (2014) Rapid analysis of trace volatile formaldehyde in aquatic products by derivatization reaction-based surface enhanced Raman spectroscopy. Analyst 139(14):3614–3621. https://doi.org/10.1039/C4AN00200H
Zhang X, Yang G, Kong C, Shen X, Cai Y, Huang D (2019) A rapid determination of free formaldehyde content in marine products. https://doi.org/10.5220/0008185200470050
Zheng H, Ding Q, Li C, Chen W, Chen X, Lin Q, Lin D (2022) Recent progress in surface-enhanced Raman spectroscopy-based biosensors for the detection of extracellular vesicles. Anal Methods 14(42):4161–4173
Download references
Acknowledgements
The first author acknowledges the support from the Vice Chancellor, Central Agricultural University (CAU), Imphal, and the Dean, College of Fisheries, Central Agricultural University, Tripura. The first author also acknowledges the financial help received from the Institutional Development Plan-NAHEP, CAU, Imphal, for undergoing foreign training at Prince of Songkla University, Hat Yai, Thailand. This research work was supported by Mahidol University.
No funding was obtained for this study.
Author information
Naresh Kumar Mehta, Anand Vaishnav, and Nilesh Prakash Nirmal contributed equally and are first authors.
Authors and Affiliations
Department of Fish Processing Technology and Engineering, College of Fisheries, Central Agricultural University, Lembucherra, Tripura, 799210, India
Naresh Kumar Mehta, Anand Vaishnav, Mocherla Bhargavi Priyadarshini & Payel Debbarma
Department of Fisheries Technology, Faculty of Fisheries, Patuakhali Science and Technology University, Dumki, Patuakhali, 8602, Bangladesh
Mohammad Sazedul Hoque & Pronoy Mondal
Department of Food Science, Faculty of Food Science and Technology, Universiti Putra Malaysia, UPM, 43400, Serdang, Selangor, Malaysia
Mahmud Ab Rashid Nor-Khaizura
Laboratory of Food Safety and Food Integrity, Institute of Tropical Agricultural and Food Security, Universiti Putra Malaysia, UPM, 43400, Serdang, Selangor, Malaysia
Institute for Biological Resources and Marine Biotechnologies, National Research Council (IRBIM-CNR), Via L. Vaccara 61, Mazara del Vallo, 91026, Trapani, Italy
Gioacchino Bono
Dipartimento Di Scienze E Tecnologie Biologiche, Chimiche E Farmaceutiche (STEBICEF), Università Di Palermo, Palermo, Italy
Institute of Nutrition, Mahidol University, 999 Phutthamonthon 4 Road, Salaya, Nakhon Pathom, 73170, Thailand
Pankaj Koirala, Aikkarach Kettawan & Nilesh Prakash Nirmal
You can also search for this author in PubMed Google Scholar
Contributions
Naresh Kumar Mehta: conceptualization, data curation, writing original draft and visualization.
Anand Vaishnav: data curation, writing original draft and visualization.
Mocherla Bhargavi Priyadarshini: original draft preparation, tables and figures.
Payal Debbarma: data curation and writing.
Mohammad Sazedul Hoque: reviewing and visualization.
Pronoy Mondal: original draft preparation, data curation
Mahmud Ab Rashid Nor-Khaizura: original draft preparation, reviewing and editing
Gioacchino Bono: original draft preparation, reviewing and editing
Pankaj Koirala: data curation, original draft preparation
Aikkarach Kettawan: reviewing and editing
Nilesh Prakash Nirmal: conceptualization, visualization, reviewing, editing, supervision and project management.
Corresponding author
Correspondence to Naresh Kumar Mehta .
Ethics declarations
Ethics approval.
This article does not need any ethical approval.
Competing interests
The authors declare no competing interests.
Additional information
Responsible Editor: Ester Heath
Publisher's Note
Springer Nature remains neutral with regard to jurisdictional claims in published maps and institutional affiliations.
Rights and permissions
Springer Nature or its licensor (e.g. a society or other partner) holds exclusive rights to this article under a publishing agreement with the author(s) or other rightsholder(s); author self-archiving of the accepted manuscript version of this article is solely governed by the terms of such publishing agreement and applicable law.
Reprints and permissions
About this article
Mehta, N.K., Vaishnav, A., Priyadarshini, M.B. et al. Formaldehyde contamination in seafood industry: an update on detection methods and legislations. Environ Sci Pollut Res (2024). https://doi.org/10.1007/s11356-024-34792-8
Download citation
Received : 04 June 2024
Accepted : 20 August 2024
Published : 03 September 2024
DOI : https://doi.org/10.1007/s11356-024-34792-8
Share this article
Anyone you share the following link with will be able to read this content:
Sorry, a shareable link is not currently available for this article.
Provided by the Springer Nature SharedIt content-sharing initiative
- Contaminants
- Detection methods
- Legislation
- Find a journal
- Publish with us
- Track your research
COMMENTS
The following sections provide a more detailed examination of the various types of quantitative and qualitative research methods, as well as the limitations of these methods in general. Quantitative Methods in Political Science. Quantitative methods are essentially a variety of research techniques that are used to gather quantitative data.
quantitative and qualitative research methods in political science, a hallmark since it first published over 25 years ago. Covers the research process from start to finish—hypothesis formation, literature review, research design, data gathering, data analysis, and research report writing.
The third edition of Research Methods for Political Science retains its effective approach to helping students learn what to research, why to research and how to research.The text integrates both quantitative and qualitative approaches to research in one volume and covers such important topics as research design, specifying research problems, designing questionnaires and writing questions ...
ABSTRACT. Thoroughly updated, more concise than the previous edition, and available for the first time in paperback, "Research Methods for Political Science" is designed to help students learn what to research, why to research, and how to research. The text integrates both quantitative and qualitative approaches to research in one volume, and ...
The focus of this book is on using quantitative research methods to test hypotheses and build theory in political science, public policy and public administration. It is designed for advanced undergraduate courses, or introductory and intermediate graduate-level courses. The first part of the book introduces the scientific method, then covers research design, measurement, descriptive ...
A fundamental divide in methods for political science is the distinction between quantitative and qualitative methods. Quantitative methods principally combines statistics, mathematics, and formal theory as tools for positive research in political science. It is a data-driven approach in which collection, analysis, interpretation, and ...
Introduction to Political Science Research Methods, authored by Dr. Josh Franco, Dr. Charlotte Lee, Kau Vue, Dr. Dino Bozonelos, Dr. Masahiro Omae, and Dr. Steven Cauchon, is an Open Education Resource textbook licensed CC BY-NC that surveys the research methods employed in political science. The textbook includes chapters that cover: history and development of the empirical study of politics ...
One might argue that political science has gone further than any other social science in developing a rigorous field of study devoted to qualitative methods. ... Mixing Methods: Qualitative and Quantitative Research J Brannen Aldershot, UK: Avebury [Google ... Field Research in Political Science: Practices and Principles Cambridge, UK ...
The SAGE Handbook of Research Methods in Political Science and International Relations offers a comprehensive overview of research processes in social science - from the ideation and design of research projects, through the construction of theoretical arguments, to conceptualization, measurement, and data collection, and quantitative and qualitative empirical analysis - exposited through 65 ...
This comprehensive text is designed to help political science students learn what to research, why to research, and how to research. It integrates both the quantitative and qualitative approaches to research, including the most detailed coverage of qualitative methods currently available.
The third edition of Research Methods for Political Science retains its effective approach to helping students learn what to research, why to research and how to research. The text integrates both quantitative and qualitative approaches to research in one volume and covers such important topics as research design, specifying research problems, designing questionnaires and writing questions ...
Introduction. Research in Political Science is increasingly based on qualitative and interpretative methods. Document analyses, discourse analyses or ethnographic studies have become more and more common (Halperin and Heath Citation 2020; Silverman Citation 2021).However, the application of these methods confronts researchers with a number of principled questions and challenges that concern ...
Formal theory, and quantitative and qualitative research methods provide a curriculum that helps students to develop the needed tools. Training in research methods includes instruction in statistical methods, but quantitative methods are not exhaustive of the field. Political science has always encompassed a variety of approaches, from formal ...
Abstract. Abstract: In this chapter, the current state of qualitative research in political science is first characterized through an examination of three forms of research that are widely regarded as qualitative, namely research that employs the methods of qualitative comparative analysis (QCA), process tracing, and ethnography.Next, the current state of qualitative research is characterized ...
1.3.2 Qualitative and Quantitative Political Science. Empirical research methods typically use quantitative data. These data are frequently numerical and can often show broad trends that are happening within the question of interest. Other scholars use qualitative methods.
Quantitative methods in political science: Research in France and the United States Article 01 June 2015. Introduction ... Although our point of departure herein is that qualitative research methods can, and do, contribute to the generation and refinement of theories, within political science, researchers working in this tradition tend to be ...
misunderstood, components of political science research. While analysts are accustomed to incorporating manifestos, speeches, media reports, and other documents as evidencein their studies, few approach the task with the same level of understanding and sophistication as when applying other, more quantitative methods.
In Political Science research, qualitative methods are usually contrasted with quantitative methods, which typically deal with large amount of data, using surveys and statistical methods, with the aim of establishing causal relationships between social phenomena.
This comprehensive text is designed to help political science students learn what to research, why to research, and how to research. It integrates both the quantitative and qualitative approaches to research, including the most detailed coverage of qualitative methods currently available. The book provides specific instructions in the use of available statistical software programs such as ...
Research Methods. There are many guides and handbooks for both qualitative and quantitative research methods. Many books on political science methodology are found in the JA 71 call number area (second floor, East, in Ellis Library). Keep in mind that methodology books are very high use, so if our copy is checked out, request the book from ALL ...
Methods: Qualitative Interviewing and Survey Research. ... Building upon the results of previous research and our qualitative study (study 1), we used the data from a representative survey to test the differences among audiences distinctly for the role of CT in their news reception (RQ3 and RQ4). ... Annual Review of Political Science 22 : 129 ...
Although quantitative data analysis is a powerful tool, it cannot be used to provide context for your research, so this is where qualitative analysis comes in. Qualitative analysis is another common research method that focuses on collecting and analyzing non-numerical data, like text, images, or audio recordings to gain a deeper understanding ...
The third edition of Research Methods for Political Science retains its effective approach to helping students learn what to research, why to research and how to research. The text integrates both quantitative and qualitative approaches to research in one volume and covers such important topics as research design, specifying research problems, designing questionnaires and writing questions ...
Each method suits different research goals and data types. Researchers often combine methods for comprehensive analysis. What are the 4 data collection methods in qualitative research? When it comes to collecting qualitative data, researchers primarily rely on four methods. Interviews: One-on-one conversations to gather in-depth information.
Furthermore, Gu et al. developed a tri-step infrared (IR) method for the qualitative and quantitative profiling of squids. This method demonstrated rapid analysis capabilities, with a relatively short analysis time of approximately 5 min. Additionally, the LOD for this method was determined to be 15 mg/kg, indicating its sensitivity in ...