New Report: How We Voted in 2022
Launching the 2022 Survey of the Performance of American Elections report and dataset
By Claire DeSoi 05.23.2023
https://electionlab.mit.edu/articles/new-report-how-we-voted-2022

A Brief Summary
Access the data + learn more.
Today we are thrilled to launch our report on the 2022 Survey of the Performance of American Elections, with its accompanying dataset.
The Survey of the Performance of American Elections (SPAE) provides information about how Americans experienced voting in the most recent federal election. The survey has been conducted after federal elections since 2008, and is the only public opinion project in the country that is dedicated explicitly to understanding how voters themselves experience the election process.
We are delighted to announce that our report detailing findings from the 2022 SPAE is now available to read, and that the 2022 dataset is now available for researchers to access and use!
10,200 registered voters responded to the 2022 survey—200 observations in each state plus the District of Columbia. We are proud to once again offer this comprehensive, nationwide dataset at the state level documenting election issues as experienced by voters.
Read the Report:

Don't have time to read the full report now, or just want to access the key findings? We've excerpted some of the report's executive summary below.
Voting by mail
- The percentage of voters casting ballots by mail retreated to 32 percent, down more than 10 points from 2020. more than doubling the fraction from 2016. The share of voters casting ballots on Election Day grew to 50 percent, from 31 percent in 2020.
- Forty-six percent of Democrats, compared to 27 percent of Republicans, reported voting by mail. This is down from 60 percent for Democrats and 32 percent for Republicans in 2020.
- The use of mail to return ballots that were mailed to voters rebounded in 2022, to 62 percent, compared to 53 percent in 2020. Twenty-one percent of mail ballots were returned to drop boxes, which is virtually unchanged from 2020.
- Almost five percent of voters who returned their ballot to a drop box reported seeing something disruptive, such as demonstrators, when they dropped off their ballot.
- Forty percent of mail voters reported using online ballot tracking.
In-person voting
- The use of schools to vote in-person continued its decade-long gradual decline.
- Average wait times to vote were roughly equal to the last midterm election for Election Day voters (6 percent waiting over 30 minutes compared to 5 percent in 2020); they declined for early voters (4 percent reported waiting over 30 minutes compared to 7 percent in 2020).
- Ten percent of Election Day voters and 9 percent of early voters reported seeing something disruptive when they voted. The most common disruptions were voters talking loudly and voters in a dispute with an election worker or other voter.
- Approximately 3 percent of in-person voters reported seeing demonstrators outside their polling place claiming the election was fraudulent.
Satisfaction with voting
- Voters who cast ballots in person and by mail continued to express high levels of satisfaction with the process, as in past years.
Reasons for not voting
- The primary reported reason for not voting in 2022 was not knowing enough about the choices (12.1 percent of non-voters), followed by not being interested (11.7 percent). and being too busy (9.8 percent).
Voter confidence
- Measured across all voters, confidence that votes were counted as intended remained similar to past years.
- The partisan gap in confidence that opened up in 2020 closed somewhat in 2022, with the primary reason being Republicans becoming more confident.
- Compared to 2020, the Democratic-Republican gap in state-level confidence declined significantly in most states. Major exceptions were Pennsylvania and Arizona.
- Among Republicans, lack of confidence in whether votes were counted as intended at the state level was strongly correlated with whether Donald Trump won the respondent’s state and with the fraction of votes cast by mail in the state.
Election security measures
- Of a set of common security measures used by election officials, respondents were most aware of logic-and-accuracy testing and securing paper ballots. One-third of respondents stated that election officials used none of the measures asked about.
- Respondents stated that the security measures that would give them the greatest assurance about the security and integrity of elections were logic-and-accuracy testing (74 percent), securing paper ballots (74 percent), and post-election audits (72 percent).
- Partisan attitudes about the prevalence of several types of vote fraud remained polarized in 2020, although less so than in 2020.
- Requiring electronic voting machines to have paper backups, requiring a photo ID to vote, automatically changing registrations when voters move, requiring election officials to be nonpartisan, and declaring Election Day a holiday were supported by majorities of both Democrats and Republicans.
- Adopting automatic voter registration, moving Election Day to the weekend, and Election-Day registration are supported by a majority of respondents, but not by a majority of Republicans.
- Ranked-choice voting, conducting elections entirely by mail, and allowing Internet voting were opposed by a majority of respondents but supported by a majority of Democrats; hand-counting paper ballots was opposed by a majority of respondents but supported by a majority of Republicans.
- Voting on cell phones was opposed by majorities of Democrats and Republicans.
Read the full report
Data and documents related to all versions of the Survey of the Performance of American Elections are available from the Harvard Dataverse, as is direct access to the 2022 data and documentation. For those links, or more information about the survey in general, navigate to:
Access the 2022 Data
Access all SPAE Data
Learn more about the SPAE

Claire DeSoi is the communications director for the MIT Election Data + Science Lab.
Back to Main
Related Articles

Retaining Election Officials in a Time of Uncertainty

Evaluating Practitioner Interventions to Increase Trust in Elections
By Jennifer Gaudette, Seth Hill, Thad Kousser, Mackenzie Lockhart, and Mindy Romero
- Browse All Articles
- Newsletter Sign-Up
PoliticalElections →
No results found in working knowledge.
- Were any results found in one of the other content buckets on the left?
- Try removing some search filters.
- Use different search filters.
South Asia Multidisciplinary Academic Journal
Home Thematic Issues 3 Studying Elections in India: Scie...
Studying Elections in India: Scientific and Political Debates
Election studies (which are here defined as scholarly work focusing on the major phases of the electoral process, i.e. the campaign, the vote, the announcement of results and subsequent government formation) constitute a distinct sub-genre of studies on democracy, which focuses, so to speak, on the ‘mechanics’ more than on the ‘substance’ of representative democracy. This sub-genre, being relatively more visible than other studies of representative democracy, has specific implications, in the academic but also in the political arena, which are the focus of this critical review of the literature on Indian elections since the 1980s. The paper argues that election studies are really in between science and politics, and that it is important, therefore, to contextualize them.
Index terms
Keywords: .
1 Studying elections in the largest democracy in the world is bound to be a challenge: given the size of the country and of its population, Indian national elections have been the largest electoral exercise in the world ever since the first national elections in 1952. Moreover the cultural, linguistic, ethnic and religious diversity of the Indian society, as well as the federal nature of the Indian state, make this event a particularly complex one. What, then, have been the methodologies and approaches deployed to study this major political event? What have been the disciplines and foci of election studies? Who have been the main authors? In what form have these studies been publicized, and what type of readership have they targeted? Reading the available literature with these questions in mind, I have tried to identify some major shifts over time, and to grasp their meaning and implications; a few interviews with specialists of the field have allowed me to test some of the interpretations suggested by the readings. Through a review of the literature on Indian elections since the 1980s, this paper aims at mapping the scientific and political debates around election studies.
- 1 Most works considered here deal with national elections, but some of them also focus on state elect (...)
- 2 I owe this formulation to Amit Prakash, whose comments on a previous version of this paper were ver (...)
2 Election studies are here defined as scholarly work focusing on the major phases of the electoral process, i.e. the campaign, the vote, the announcement of results and subsequent government formation. 1 This is a restrictive definition: elections are obviously a central institution of representative democracy, and as such they are connected to every aspect of the polity. Yet election studies constitute a distinct sub-genre of studies on democracy, which focuses, so to speak, on the ‘mechanics’ more than on the ‘substance’ of representative democracy. 2 This sub-genre, being relatively more visible than other studies of representative democracy, has specific implications, in the academic but also in the political arena, which will be the focus of this critical review. This paper will argue that election studies are really in between science and politics, and that it is important, therefore, to contextualize them.
3 The paper starts with a quick overview of the different types of election studies which have been produced on India, and goes on to analyze a series of dilemmas and debates attached to election studies, which highlight the intricate nature of the political and scientific issues at stake.
The study of Indian elections: an overview
4 At least three previous reviews of election studies have been realized, by Narain (1978), Brass (1985), and Kondo (2007). Both Narain and Kondo provide a fairly exhaustive list of publications in this field, and discuss their relevance and quality. Brass’ review also offers a detailed discussion of the advantages and limitations of ecological approaches, to which I will later return.
5 There is no need to repeat this exercise here. But in view of situating the debates described in the next section of the paper, I simply want to sketch a broad typology of election studies published since the late 1980s—a moment which can be considered as the emergence of the new configuration of the Indian political scene, characterized by (i) the importance of regional parties and regional politics; (ii) the formation of ruling coalitions at the national and regional levels; and (iii) the polarization of national politics around the Congress, the BJP, and the ‘third space’.
6 All three reviews of the literature highlight the diversity of disciplines, methods, authors, institutions, and publication support of studies of Indian elections. But a major dividing line appears today between case studies and survey research (which largely match a distinction between qualitative and quantitative studies), with a number of publications, however, combining elements of both.
Case studies
7 Case studies analyze elections from the vantage point of a relatively limited political territory, which can be the village (for instance Somjee 1959), the city (or, within the city, the mohalla , the basti ), the constituency, the district, or the state. The major discipline involved in this type of research has been political science. Indeed elections have been the object par excellence of political science worldwide. In India as elsewhere, as we will see below, election studies reveal characteristic features of this relatively recent discipline, insofar as they embody some tensions between science and politics.
- 3 Another example is a study of parliamentary and state elections in a village in Orissa at the end o (...)
8 Paul Brass developed the case study method in the course of his long interest for politics in Uttar Pradesh. His monograph on the 1977 and 1980 elections focuses on Uttar Pradesh (he justifies this choice saying that this election was largely decided in North India). His research is based on fieldwork in five selected constituencies whose ‘electoral history’ is minutely recalled. Here the choice of the unit of analysis is linked to pedagogical considerations: ‘Each constituency chosen illustrates a different aspect of the main social conflicts that have been prominent in UP politics’, he writes (Brass 1985: 175). Indeed in the case study approach, the detailed observation of elections in a particular area aims at uncovering processes and dynamics which are relevant for a much wider territory. 3
- 4 In the early years of independent India, the Indian Council for Social Science Research (ICSSR) com (...)
- 5 One must note that among the various disciplines producing case studies, anthropology uses the larg (...)
9 Beside political science, anthropology has also approached elections in a manner close to case studies. 4 But anthropological studies are usually focused on a more limited political territory (typically, the village), and more importantly, they are centered on a questioning of the meaning of the electoral process 5 for voters: why do people vote? More precisely, why do they bother, what is the meaning of voting for them? Thus anthropologists often focus on the symbolic dimension of elections:
From this [symbolic] perspective, democracy is really an untrue but vitally important myth in support of social cohesion, with elections as its central and regular ritual enactment that helps maintain and restore equilibrium (Banerjee 2007: 1556).
10 Taking the ritual as a central metaphor in their accounts of elections, anthropologists help us see the various ‘ceremonies’ and ‘performances’ that constitute the electoral process:
To define [the] cultural qualities of Indian democracy, it is important to view the ritual of the election process through four consecutive ceremonies [:] Party endorsement […], the actual campaign […], the day of polling [and the] public announcement [of winners] (Hauser & Singer 1986: 945).
11 On the basis of their observations of two elections in Bihar in the 1980s, Hauser and Singer define the electoral process as a ‘cycle’. They describe the successive phases of this cycle, and draw parallels with religious rituals, noting for instance that the electoral process involves a series of processions. Their likening of the electoral campaign to a ‘pilgrimage’ manifesting the ‘inversion of power from the hands of the politicians back to the hands of the voters’ (Hauser & Singer 1986: 947) goes a long way in explaining the festive dimension of Indian elections.
12 Anthropological studies of elections also clearly show how elections precipitate, or at least highlight, otherwise latent political dynamics. The long fieldwork characteristic of the discipline makes it possible to concretely demonstrate how elections render visible otherwise subtle, if not invisible, relationships of influence:
[…] election day was when the complexity of the village’s social life was distilled into moments of structure and clarity, when diffuse tensions and loyalties were made unusually manifest (Banerjee 2007: 1561).
13 For Banerjee, who studied politics from the standpoint of a village in West Bengal, an election is a celebration in two ways: (i) it is a festive social event; (ii) it involves a sense of democracy as sacred. Therefore she understands ‘elections as sacred expressions of citizenship’ (Banerjee 2007: 1561).
14 For all their evocative strength, one can regret that anthropological studies of Indian elections deal mostly with villages and with traditional electoral practices. However one must also note that elections elsewhere have attracted even less attention from anthropologists. Indeed, a recent issue of Qualitative Sociology deplored that ‘at a time when few, if any, objects are beyond the reach and scrutiny of ethnographers, it is quite surprising that politics and its main protagonists (state officials, politicians and activists) remain largely un(der)studied by ethnography’s mainstream’ (Auyero 2006: 257).
Other approaches
15 A number of articles and books on Indian elections combine different methodological approaches. Thus some of Banerjee’s conclusions are shared by the political scientists Ahuja and Chibber ( n.d. ), in an interesting study combining quantitative and qualitative methods ( i.e. election surveys (1989-2004) and a series of focus group discussions) in three large Indian states. In order to understand the particular pattern of electoral turnout described by Yadav as characteristic of the ‘second democratic upsurge’ (Yadav 2000), Ahuja and Chibber identify three broad social groups, defined by three distinct ‘interpretations’ of voting. They argue that ‘differences in the voting patterns of opposite ends of the social spectrum exist because each group interprets the act of voting differently’. Thus the act of voting is considered as a ‘right’ by the groups who are on the lower end of the socio-economic spectrum—the ‘marginalized’; as an ‘instrument […] to gain access to the state and its resources’ by those in the middle of that spectrum—the ‘State’s clients’; and as ‘civic duty’ by those at the top—‘the elite’ (Ahuja & Chibber 2009: 1-9).
- 6 One must also mention the ‘Chronicle of an Impossible Election’— i.e. the 2002 Assembly election in (...)
16 Among the ‘other approaches’ of elections, one also finds a number of monographs devoted to a single election 6 . For instance Myron Weiner’s study of the 1977 election constitutes an interesting, contemporary account of the beginning of the end of Congress dominance over Indian politics, with the first part devoted to the campaign and the second part to the analysis of results, on the basis on a medley of methods typical of political science:
In four widely scattered cities – Bombay […], Calcutta, Hyderabad, and New Delhi […]—[the author] talked to civil servants, candidates, campaign workers, newspaper editors, and people in the streets, attended campaign rallies and visited ward offices, collected campaign literature, listened to the radio, and followed the local press (Weiner 1978: 21)
17 In the 1990, a series of collective volume were published on parliamentary elections (for instance Roy & Wallace 1999). Often based on aggregate data such as those published by the Election Commission of India, they offer a series of papers that are interpretative, speculative, critical in nature.
- 7 This is in sharp contrast with France, where electoral geographers such as André Siegfried have bee (...)
18 I have found one single book of electoral geography (Dikshit 1993), 7 which presents election results (crossed with census data) as a series of maps. This particular method highlights unexpected regional contrasts and similarities, which stimulates the production of explanatory hypotheses.
- 8 This inventory of ‘ other’ election studies, that is, studies of elections that fall neither in the (...)
19 Finally, a recent book by Wendy Singer (2007) makes a case for an application of social history to elections. Going through a large material relating to elections (national, state, local) from 1952 to the 1990s, she shows how some details of the electoral process reveal important social changes over time. 8
20 The gathering of the above mentioned writings in a single, residual category is not meant to suggest that they are less effective than case studies or survey research in describing and explaining elections. On the contrary, the variety of methodologies that they mobilize shows the richness of elections as an object of scientific enquiry. But these studies eschew the strong methodological choices which define the other two categories and which point to the political stakes specific to election studies.
Survey research
21 Survey research has been dominating election studies since the 1990s for a variety of reasons. I will here use Yadav’s definition of this particular method:
[…] a technique of data gathering in which a sample of respondents is asked questions about their political preferences and beliefs to draw conclusions about political opinions, attitudes and behavior of a wider population of citizens (Yadav 2008: 5).
9 Eric Da Costa founded the Journal of Public Opinion .
- 10 The CSDS was meant, in Kothari’s own words: ‘One, to give a truly empirical base to political scien (...)
- 11 The CSDS did not even study the 1977 election, on which we fortunately have Myron Weiner’s monograp (...)
22 Survey research exemplifies the close relationship between the media and political science. It was introduced in India in the late 1950s by an economist turned journalist, Eric Da Costa, considered ‘the father of opinion polling in India’ (Butler et al. 1995: 41), 9 who went on to work with the Indian Institute of Public Opinion (IIPO) created in 1956—but it was political scientists such as Bashiruddin Ahmed, Ramashray Roy and Rajni Kothari who gave it a scientific grounding. In his Memoirs (2002), Kothari recalls how he went to Michigan University—which had developed an expertise in psephology, i.e. the statistical analysis of elections - to get trained in survey research. When he came back to India, Kothari applied this new method in his work at the Delhi-based Centre for the Study of Developing Societies (CSDS), which he had founded a few years earlier, in 1963. 10 The first election to which he applied this newly acquired expertise was the Kerala state election in 1965 (Lokniti team 2004: 5373). The CSDS team then went on to study general elections in 1967, 1971 and 1980, but it seems to have progressively lost interest for election studies—hence the gap between this first series 11 and the new series which started in 1996—in a new political context, as we will see further.
23 The renaissance, so to speak, of electoral surveys, came from another academic turned journalist: Prannoy Roy. An economist by training, Roy learnt survey research in the United Kingdom. After coming back to India in the early 1980s, he applied this method to Indian elections. He co-produced a series of volumes, with Butler and Lahiri, he conducted a series of all India opinion polls for the magazine India Today, but more importantly in 1998 he founded a new television channel, New Delhi Television (NDTV) on which he anchored shows devoted to the statistical analysis of elections—thus popularizing psephology.
- 12 The CSDS entered into a stable partnership with the new channel six months before it went on air, w (...)
24 The link between these two pioneering institutions of psephology, CSDS and NDTV, was provided by Yogendra Yadav, a young political scientist who was brought from Chandigarh University to the CSDS by Rajni Kothari. Yadav revived the data unit of the CSDS and went on to supervise an uninterrupted series of electoral studies which have been financially supported and publicized by the print media, but also by NDTV. Yadav’s expertise, his great ability to explain psephological analyses both in English and Hindi, made him a star of TV shows devoted to elections, first on NDTV, and then on the channel co-founded by the star anchor Rajdeep Sardesai after he left NDTV: CNN-IBN. 12 In 1995, the CSDS team around Yogendra Yadav created Lokniti, a network of scholars based in the various Indian states, working on democracy in general and on elections in particular. The Lokniti network has been expanding both in sheer numbers and in terms of disciplines, and it has consistently observed elections since 1996.
25 In a landmark volume published in 1995 by Roy along with two other scholars, David Butler and Ashok Lahiri, the authors had made a strong statement in favour of psephology, even while acknowledging its limits: ‘This book […] offers the ‘What?’ of the electoral record; it does not deal with the ‘Why?’’ (Butler et al. 1995: 4). In this regard, the CSDS data unit has strived, from 1996 onwards, to improve its data gathering in order to capture more of the ‘Why?’, i.e. to capture with increasing accuracy the electoral behaviour of Indians and its explanatory factors. More generally, it has aimed ‘to use elections as an occasion or as a window to making sense of trends and patterns in democratic politics’ (Lokniti Team 2004: 5373).
- 13 The ‘notes on elections’ published in Electoral Studies favour a strongly institutional perspective (...)
26 The CSDS election studies have also been published in academic supports such as the Economic and Political Weekly (EPW) in India, or Electoral Studies on the international level 13 , and they have been used by a large number of academic works in political sociology (for instance Jaffrelot (2008) on the vote of the urban middle classes). Recently, the Lokniti network has published a series of state election studies in Hindi and in English, with academic publishing houses (Mohan 2009, Shastri 2009).
Scientific and political debates
27 Debates around the study of Indian elections involve political and scientific arguments which are sometimes difficult to disentangle. These debates underline that no method is politically neutral, and they illustrate the particularly problematic relationship of one discipline, political science, with the political sphere and with the media.
Scientific dilemmas
28 The opposition between case studies and survey research can be broken into a series of dilemmas and choices.
29 The first dilemma concerns the most relevant unit of analysis: should one privilege width or depth? The central difficulty here is often to combine feasibility and relevance. In his introduction to a series of case studies done in the 1960s and 1970s, Shah writes:
A major limitation of the survey method is its inability to capture the influence of local politics on the electoral behavior of small communities. A questionnaire administered to individual voters can elicit information about individual attitudes and opinions but cannot capture the larger reality of events involving a collectivity of individuals acting over a longer period of time. A fieldworker who knows the community is better equipped to capture that reality (Shah 2007: 12).
- 14 Both Brass (1985) and Palshikar (2007) make a forceful argument in favour of taking the constituenc (...)
30 As we saw, case studies, focusing on a limited area, 14 do offer historical depth, for example in Brass (1985). The anthropological brand of case studies also offers ‘cultural’ depth, through a wealth of concrete details which suggest the multiple meanings of elections for voters. However survey research allows generalizations; and it contextualizes results by identifying patterns, linked to regions or social groups.
31 The second dilemma concerns quantitative vs. qualitative methods. This opposition cannot be reduced to the use of figures vs. words. While many case studies involve some quantified description of the vote, they are deeply qualitative in nature, insofar as they aim at uncovering the qualities of particular political trajectories—of a community, a party, a constituency, a state etc. Survey research on the contrary aims at revealing general patterns. Here again the question of feasibility is central: while surveys are expensive, case studies are time intensive.
- 15 For instance, the first National Election Study, conducted by the CSDS in 1967, did not take women (...)
32 An important dimension of that dilemma relates, again, to the capacity of these two types of methods to capture the meaning of elections for voters. Survey research, functioning with closed questions, conveys only the meanings that the survey design has anticipated, and risks perpetuating the prejudices of its authors. 15 By contrast, qualitative methods such as open interviews and direct observation are more likely to bring out unexpected interpretations.
33 However one large consensus appears to bridge the divide between survey research a la CSDS and case studies: the ‘ecological’ approach is preferred to the ‘strategic’ approach of elections. Ecological analyses ‘correlate electoral with other kind of aggregate data’ (Brass 1985: 3). They focus on ‘the sociological characteristics of voters, which determine the construction of their representation of politics and their social solidarity’ (Hermet et al. 2001: 31), whereas the ‘economical’ or strategic approach is based on methodological individualism and the problematic of the rational voter. Already in 1985 Paul Brass argued that ‘ecological analyses had a ‘useful place in India electoral studies’ ( ibid )—indeed he expanded on their advantages and limitations, through a detailed discussion of the methodological issues arising from the difficulty of relating electoral and census data, and of the technical solutions found by a number of works which he reviewed.
34 The evolution of National Election Studies (NES) conducted by the CSDS since 1996 shows an attempt to develop increasingly ecological types of analysis, by introducing more and more variables in their considerations. Indeed the latest surveys come close to meeting the advantages of ecological approaches as explained by Brass: ‘Identifying the underlying structural properties of party systems, […] presenting time series data to discover trends in voting behaviour, […] identifying distinctive regional contexts in which voting choices occur, and […] discovering unthought of relationships through the manipulation of available data’ (Brass 1985: 4).
35 A recent exception vis-à-vis this consensus is Kanchan Chandra’s work on ‘ethnic voting’ (Chandra 2008), which analyses electoral mobilization as a mode of negotiation used by marginal groups. Chandra argues that the poorer groups in India use their vote as ‘their primary channel of influence’. In a description of ‘elections as auctions’, she argues that the ‘purchasing power of small groups of voters’ depends ‘upon the degree to which electoral contests are competitive’ (Chandra 2004: 4). Her interpretation of the relatively high turnout in Indian elections, even as one government after the other fails the poor, is a materialist one:
16 Emphasis mine. When survival goods are allotted by the political market rather than as entitlements, voters who need these goods have no option but to participate. […] Voters do not themselves have control over the distribution of goods. But by voting strategically and voting often, they can increase their chances of obtaining these goods (Chandra 2004: 5). 16
Academic rivalries
36 The above dilemmas are extremely widespread, but in the Indian context they also correspond, to some extent, to academic rivalries between scholars and institutions, which might explain their persistence over time.
- 17 The debate on the scientific legitimacy of survey research as opposed to more theoretical, or more (...)
- 18 The preference for qualitative methods actually extends to other disciplines among social sciences (...)
- 19 In this regard, Mukherji’s account of State elections in the early 1980s in a constituency of West (...)
37 One can identify, to start with, an implicit rivalry between political science and psephology—even though the latter can be considered as a sub-discipline of the former. 17 A few texts, but also interviews, reveal a mutual distrust, both in scientific and political terms. Indian political science values theoretical work more than empirical research; qualitative more than quantitative methods; 18 politically, it favours a radical critique of the political system. 19 Survey research, of course, is essentially empirical, quantitative and ‘status quoist’. Yogendra Yadav thus sums up the situation that prevailed in the late 1980s:
The label ‘ survey research’ stood for what was considered most inappropriate in the third world imitation of American science of politics: it was methodologically naïve, politically conservative and culturally inauthentic (Yadav 2008: 3).
38 Even today, quantitative methods, which are much fashionable in American (and more lately in French) political science, are hardly taught in the political science curriculum of Indian universities. Thus Kothari’s endeavour to launch a ‘so-called ‘new political science’’ in the CSDS in the 1960s—this was the time of the behaviorist revolution in social sciences—was a lonely one. He describes this ambition thus:
[It] was mainly based on the empirical method leading to detailed analytical understanding of the political processes […] The ‘ people’ came within that framework, as voters and citizens with desires, attitudes and opinions; our task as academics was to build from there towards a macro-theory of democracy, largely through empirical surveys of political behavior (by and large limited to electoral choices) but also through broader surveys of social and political change (Kothari 2002: 60-61).
39 This project actually seems to be realized through the Lokniti network which links the CSDS data unit with a number of colleges or universities across the country (and thus contributes to training an increasingly large number of students who are then hired as investigators for National and State Election studies).
40 As far as the political agenda of survey research is concerned, Yadav makes a passionate plea for ‘transfer as transformation’ (Yadav 2008: 16) i.e. for an adaptation of survey research to the political culture of countries of the global South, with a double objective: (i) to make survey research more relevant scientifically; (ii) to use it as a politically empowering device, that is ‘[…] to ensure that subaltern and suppressed opinions are made public’ (Yadav 2008: 18).
41 Much of the latent opposition between psephologists and other political scientists is probably due to the disproportionate visibility of psephologists when compared to other social scientists working on elections. But the close connection between psephology and the media is a double edged sword. On the one hand, it offers researchers a much needed financial support:
Some of the leading media publications like the Hindu, India Today, Frontline and the Economist supported [National Election Studies] between 1996 and 1999 (Lokniti team 2004: 5375).
- 20 Thus in spite of the continuing efforts of NES to improve its methods, it failed to accurately pred (...)
42 On the other hand, it forces them to engage with the scientifically dubious, and economically risky, exercise of predicting results, 20 or explaining them immediately after their publication. However, the consistent transparency and critical self-appraisal of surveys conducted by the CSDS goes a long way in asserting their scientific credibility:
Within India, the NES series has sought to distinguish itself from the growing industry of pre-election opinion polls […] The difficulties of obtaining independent support for NES made the Lokniti group turn to media support which in turn required the group to carry out some pre-election opinion polls and even exit polls linked to seats forecast. The experiment yielded mixed results, some reasonably accurate forecasts along with some embarrassing ones (Lokniti team 2004: 5380)
- 21 See, for instance, Lokniti Team 2004, in which the methodological flaws and evolutions (in terms of (...)
43 A more explicit and constructive debate has been taking place, lately, between psephology and anthropology. Notwithstanding his refusal to ‘participate in methodological crusades on social sciences’ (Yadav 2008: 4), Yadav has consistently sought to situate, explain, improve and diffuse his brand of survey research on elections 21 . His call for a ‘dialogue’, elaborated upon by Palshikar (‘how to integrate the methods and insights of field study and survey research’ 2007: 25) has been answered by Mukulika Banerjee, who is currently directing, along with Lokniti, an unprecedented project of Comparative Electoral Ethnography, which aims at ‘bringing together the strengths of large-scale and local-level investigations’ ( www.lokniti.org/comparative_electoral_ethnography.html accessed in May 2009) .
Political issues
44 One can distinguish three types of relationship between elections studies and politics, which correspond to three distinct, if related, questions. Firstly, how do elections studies meet the need of political actors? Secondly, to what extent are they an offshoot of American political science? And thirdly, what representation of democracy do they support?
45 Firstly, the development of survey research is directly linked to Indian political life:
In the 1950s there were virtually no market research organizations in India. The dominance of the Congress diminished any incentive to develop political polls (Butler et al . 1995: 41).
46 At the time of the second non-Congress government at the Centre (1989-1991), political parties started commissioning surveys which they used to build their electoral strategy (Rao 2009). Indian elections have been decided at the state level since the 1990s, and the proliferation of national pre-poll survey from the 1991 election onwards can be linked to the uncertainty of the electoral results in a context of increasing assertion of regional parties (Rao 2009). The fact that the CSDS resumed its elections series in 1996 is doubtlessly linked to the transformations that have been characterizing the Indian political scene since the beginning of that decade. The rise to power of the Bahujan Samaj Party in Uttar Pradesh and its emergence in other North Indian states, and more generally the fragmentation of political representation, with new parties representing increasingly smaller social groups, has made it increasingly necessary to know who votes for which party in which state—and why.
47 Furthermore the decentralization policy adopted in 1992 has generated a lot of interest both from actors and observers of Indian politics. Today the newfound interest for ethnographic, locally rooted types of election studies may well have to do with the fact that the national scale is increasingly challenged as the most relevant one to understand Indian politics.
48 Secondly, a more covert, but no less important aspect of the debate relates to what could be roughly called the ‘Western domination’ of survey research. Methods have been learnt by leading Indian figures in the United States or in the United Kingdom (even in the 2000s, CSDS members get trained in the summer school in survey research in Michigan University). Authors are often American (or working in the American academia). Funding often involves foreign funding agencies.
- 22 This problem is not restricted to survey research alone: thus Mitra evokes the ‘Americanisation of (...)
- 23 Linz, Stepan and Yadav 2007 represents a good example of the changing status of the Indian case in (...)
24 See Fauvelle 2008.
49 More importantly, the key concepts of survey research are often drawn from the rich field of American election studies, 22 and particularly from behaviourism, a school of thought which is rejected by part of the Indian academia. Lastly, the general (and often implicit) reference to which the Indian scenario is compared is actually the United States and Western Europe. On the one hand, these comparative efforts 23 testify to the fact that India is not an outsider any more as far as democracies are concerned. On the other hand, one can regret an excessive focus, in comparisons, on the West, insofar as it skews the assessment of the Indian case (for instance the Indian pattern of voter turnout, which is qualified as ‘exceptional’ by Yadav because it breaks from the trend observed in North America and Western Europe, might appear less so if it was compared, say, to post-Apartheid South Africa). 24
50 Thirdly, all election studies support a (more or less implicit) discourse on Indian democracy; they can always be read as a ‘state of democracy report’ (Jayal 2006). In this regard, one of the criticisms addressed to psephological studies is that their narrow focus tends to convey a rosy picture, since elections are usually considered as ‘free and fair’ in the Indian democracy, which is often qualified as ‘procedural’, i.e. which conforms to democratic procedures (regular elections and political alternance, a free press) but not to democratic values (starting with equality). The sheer magnitude of the logistics involved in conducting national elections is bound to evoke admiring appraisals, which tend to obliterate the limits of procedural democracy. Thus Jayal criticizes the ‘the fallacy of electoralism’:
The scholars who subscribe to the limited, proceduralist view of democracy, are generally buoyant about Indian democracy... Their analyses emphatically exclude the many social and economic inequalities that make it difficult for even formal participation to be effective (Jayal 2001: 3).
51 Moreover the huge costs involved in conducting sample surveys on ever larger samples imply that the funders—which include the media—can put pressure on the team conducting the survey. And one can see two reasons why survey research is so media friendly: one, its (supposed) ability to predict results makes it an indispensable component of the horse-race, entertaining aspect of elections; two, it contributes to the ‘feel good’ factor as it shows, election after election, that the turnout is high and that results are unpredictable; it thus gives credit to the idea of democratic choice.
52 To this positive assessment, some Indian political scientists oppose the more critical vision offered by case studies of Indian politics focusing not on the mainstream, but on the margins. Here anthropology offers a way out, since the informed perspective of the long time fieldworker allows a simultaneous perception of the mainstream and of the margins. Thus the works of Hauser and Singer or that of Banerjee, offering a minute description of the various ‘ceremonies’ that together constitute the election process from the vantage point of voters, highlight both the empowering and the coercive dimensions of voting. Their studies suggest that when it comes to elections, the relationship between celebration and alienation is a very subtle one.
53 Elections are a complex, multi-dimensional social and political event which can be captured only through a variety of methods: this literature review underlines how the different approaches complete each other and are therefore equally necessary. While Indian election studies, at least at the national and state levels, have been dominated, since the 1990s, by survey research, the Lokniti based project of ‘Comparative Electoral Ethnography’ should contribute to restoring some balance between various types of studies. Also, academic debates around the scientific and political implications and limitations of election studies seem to lead to a convergence: while questionnaire-based surveys evolve towards a finer apprehension of the opinions and attitudes of Indian voters, anthropological studies strive to overcome the limitations of fieldwork based on a single, limited area.
- 25 For instance anthropological studies tend to focus on the short period comprised between the beginn (...)
54 One can regret that studies of Indian elections, by all disciplines, tend to focus exclusively on the vote, which certainly is a climactic moment of the electoral process, but by no means the only interesting one. 25 Indeed a recent attempt by the CSDS team to understand participation beyond voting, in order to qualify the ‘second democratic upsurge’ (Yadav 2000) through a state wise analysis of the 2004 Lok Sabha elections, suggests that a broader definition of the electoral process might significantly contribute to solving the ‘puzzle of Indian democracy’ (Chibber & Petrocik 1989, Lijphart 1996). They conclude that ‘comparison across social sections shows that a broader entry of the underprivileged into the political arena is much more limited, even today, than the entry of the more privileged social sections’ (Palshikar & Kumar 2004: 5414). The complementarities of different approaches are here glaring: ethnographic work is much needed to understand the implications of the fact that ‘over the years there is a steady increase in the number of people who participated in election campaign activity’ (Palshikar & Kumar 2004: 5415).
55 One wishes also that anthropological studies of future elections deal not only with the traditional elements of voting (the campaign procession, the inking of the finger etc.), but also with newer elements of the process: what has been the impact of the model code of conduct, or of the increasing use of SMS and internet in the campaign, on electoral rituals? What about the collective watching of TV shows focusing on elections, both before and after the results are known?
56 Finally, at a time when election surveys have acquired an unprecedented visibility, due to their relationship with the mass media, one can only lament the absence of rigorous studies on the role of the media, both print and audio-visual, in funding, shaping and publicizing election studies.
Bibliography
Ahuja, Amit; Chhibber, Pradeep (nd) ‘Civic Duty, Empowerment and Patronage: Patterns of Political Participation in India’, http://www.sscnet.ucla.edu/polisci/cpworkshop/papers/Chhibber.pdf (accessed on 21 November, 2009).
Auyero, Javier (2006) ‘Introductory Note to Politics under the Microscope: Special Issue on Political Ethnography I’, Qualitative Sociology , 2, pp. 257-9.
Banerjee, Mukulika (2007) ‘Sacred Elections’, Economic and Political Weekly , 28 April, pp. 1556-62.
Brass, Paul (1985) Caste, Faction and Party in Indian Politics. Volume Two: Election Studies , Delhi: Chanakya Publications.
Butler, David; Lahiri, Ashok; Roy, Prannoy (1995) India Decides. Elections 1952-1995 , Delhi: Books & Things.
Chandra, Kanchan (2004) ‘Elections as Auctions’, Seminar , 539.
Chandra, Kanchan (2008) ‘Why voters in patronage democracies split their tickets: Strategic voting for ethnic parties’, Electoral Studies , 28, pp. 21-32.
Chhibber, Pradeep; Petrocik, John R.K. (1989) ‘The Puzzle of Indian Politics: Social Cleavages and the Indian Party System’, British Journal of Political Science , 19(2), pp. 191-210.
Dikshit, S.K. (1993) Electoral Geography of India, With Special Reference to Sixth and Seventh Lok Sabha Elections , Varanasi: Vishwavidyalaya Prakashan.
Eldersveld, Samuel; Ahmed, Bashiruddin (1978) Citizens and Politics: Mass Political Behaviour in India , Chicago: University of Chicago Press.
Fauvelle-Aymar, Christine (2008) ‘Electoral turnout in Johannesburg: Socio-economic and Political Determinants’, Transformation, Critical Perspectives on Southern Africa , 66/67, pp. 142-67.
Hauser, Walter; Singer, Wendy (1986) ‘The Democratic Rite: Celebration and Participation in the Indian Elections’, Asian Survey , 26(9), pp. 941-58.
Hermet, Guy; Badie, Bertrand; Birnbaum, Pierre; Braud, Philippe (2001) Dictionnaire de la science politique et des institutions politiques , Paris: Armand Colin.
Jaffrelot, Christophe (2008) ‘‘Why Should We Vote? ’ The Indian Middle Class and the Functioning of the World’s Largest Democracy’, in Christophe Jaffrelot & Peter Van der Veer (eds.), Patterns of Middle Class Consumption in India and China , Delhi: Sage.
Jayal, Niraja Gopal (2001) ‘Introduction’, in Niraja Gopal Jayal (ed.), Democracy in India , Delhi: Oxford University Press, pp. 1-49.
Jayal, Niraja Gopal (2006) ‘Democratic dogmas and disquiets’, Seminar , 557.
Kondo, Norio (2007) Election Studies in India , Institute of Developing Economies: Discussion Paper n°98.
Kothari, Rajni (2002) Memoirs. Uneasy is the Life of the Mind , Delhi: Rupa & Co.
Lijphart, Arend (1996) ‘The Puzzle of Indian Democracy: A Consociational Interpretation’, The American Political Science Review , 90(2), pp. 258-68.
Linz, Juan; Stepan, Alfred; Yadav, Yogendra (2007) ‘‘Nation State’ or ‘State Nation’—India in Comparative Perspective’, in Shankar K. Bajpai (ed.), Democracy and Diversity: India and the American Experience , Delhi: Oxford University Press, pp. 50-106.
Lokniti Team (2004) ‘National Election Study 2004: An Introduction’, Economic and Political Weekly , 18 December, pp. 5373-81.
Lyngdoh, James Michael (2004) Chronicle of an Impossible Election: The Election Commission and the 2002 Jammu and Kashmir Assembly Elections , Delhi: Penguin/Viking.
Mitra, Subrata K. (1979) ‘Ballot Box and Local Power: Electoral Politics in an Indian Village’, Journal of Commonwealth and Comparative Politics , 17(3), pp. 282-99.
Mitra, Subrata K. (2005) ‘Elections and the Negotiation of Ethnic Conflict: An American Science of Indian Politics?’, India Review , 24, pp. 326-43.
Mohan, Arvind (ed.) (2009) Loktantra ka Naya Lok , Delhi: Vani Prakashan.
Mukherji, Partha N. (1983) From Left Extremism to Electoral Politics: Naxalite Participation in Elections , New Delhi: Manohar.
Narain, Iqbal; Pande, K.C.; Sharma, M.L.; Rajpal, Hansa (1978) Election Studies in India: An Evaluation , New Delhi: Allied Publishers.
Palshikar, Suhas; Kumar, Sanjay (2004) ‘Participatory Norm: How Broad-based Is It?’, Economic and Political Weekly , 18 December, pp. 5412-17.
Palshikar, Suhas (2007) ‘The Imagined Debate between Pollsters and Ethnographers’, Economic and Political Weekly , 27 October, pp. 24-8.
Rao, Bhaskara (2009) A Handbook of Poll Surveys in Media: An Indian Perspective , Delhi: Gyan Publications.
Roy, Ramashray; Wallace, Paul (1999) Indian Politics and the 1998 Election: Regionalism, Hindutva and State Politics , New Delhi, Thousand Oaks, London: Sage Publications.
Saez, Lawrence (2001) ‘The 1999 General Election in India’, Electoral Studies , 20, pp. 164-9.
Shah, A.M. (2007) ‘Introduction’, in A.M. Shah (ed.), The Grassroots of Democracy: Field Studies of Indian Elections , Delhi: Permanent black, pp. 1-27.
Shastri, Sandeep; Suri, K.C.; Yadav, Yogendra (2009) Electoral Politics in Indian States: Lok Sabha Elections in 2004 and Beyond , Delhi: Oxford University Press.
Singer, Wendy (2007) ‘A Constituency Suitable for Ladies’ And Other Social Histories of Indian Elections , New Delhi: Oxford University Press.
Somjee, A.H. (1959) Voting Behaviour in an Indian Village , Baroda: M.S.University.
Sundar, Nandini; Deshpande, Satish; Uberoi, Patricia (2000) ‘Indian Anthropology and Sociology: Towards a History’, Economic and Political Weekly , 10 June, pp. 1998-2002.
Weiner, Myron (1978), India at the Polls. The Parliamentary Elections of 1977 , Washington D.C.: American Enterprise Institute for Public Policy Research.
Yadav, Yogendra (2000) ‘Understanding the Second Democratic Upsurge: Trends of Bahujan Participation in Electoral Politics in the 1990s’, in Francine R. Frankel; Zoya Hasan; Rajeev Bhargava; Balveer Arora (eds.), Transforming India: Social and Political Dynamics of Democracy , Delhi: Oxford University Press.
Yadav, Yogendra (2007) ‘Invitation to a dialogue: What work does ‘fieldwork’ do in the field of elections?’, in A.M. Shah (ed.), The Grassroots of Democracy: Field Studies of Indian Elections , Delhi: Permanent black, pp. 345-68.
Yadav, Yogendra (2008) ‘Whither Survey Research? Reflections on the State of Survey Research on Politics in Most of the World’, Malcom Adiseshiah Memorial Lecture, Chennai.
1 Most works considered here deal with national elections, but some of them also focus on state elections.
2 I owe this formulation to Amit Prakash, whose comments on a previous version of this paper were very helpful.
3 Another example is a study of parliamentary and state elections in a village in Orissa at the end of Emergency, in which S. Mitra describes the caste dynamics in the village and the way it plays out during electoral times to show how ‘elections are used as instruments by various sections of the society to convert their political resources and power into authority’ (Mitra 1979: 419).
4 In the early years of independent India, the Indian Council for Social Science Research (ICSSR) commissioned a series of case studies, some of which are reviewed by Narain (1978). A more recently published volume offers a sample of such studies, conducted in the late 1960s by the sociology department of Delhi University under the supervision of M.N.Srinivas and A.M.Shah (Shah 2007).
5 One must note that among the various disciplines producing case studies, anthropology uses the largest definition of political participation, to include not only voting, but also participating in meetings, supporting the campaign of a particular party or candidate etc.
6 One must also mention the ‘Chronicle of an Impossible Election’— i.e. the 2002 Assembly election in Jammu and Kashmir - as told by the then Chief Election Commissioner, J.M. Lyngdoh (2004), which provides an insider’s view of how election procedures are the result of a series of (sometimes minute) decisions—aiming at asserting that the Election Commission does not represent the Indian government.
7 This is in sharp contrast with France, where electoral geographers such as André Siegfried have been the founding fathers of political science. For an illustration of how geography enriches our understanding of elections, see Lefèbvre and Robin in this volume.
8 This inventory of ‘ other’ election studies, that is, studies of elections that fall neither in the ‘case study’ nor in the ‘survey research’ type, would obviously become much more complex and large if we were to include in it the large body of literature on the party system, or on the federal structure as they evolve over time in India. However that literature does take elections as its main focus, and has therefore not been considered here.
10 The CSDS was meant, in Kothari’s own words: ‘One, to give a truly empirical base to political science [...] Two, to engage in a persistent set of writings through which our broad conceptualisation of democracy in India was laid out [...] And three, institutionalise not just the Centre as a place of learning but as part of the larger intellectual process itself’ (Kothari 2002: 39-40). Over the years, the CSDS has retained a unique place in the Indian academia, as it remains distinct from universities even while engaging in a number of collaborations with their faculty—Lokniti being a case in point.
11 The CSDS did not even study the 1977 election, on which we fortunately have Myron Weiner’s monograph.
12 The CSDS entered into a stable partnership with the new channel six months before it went on air, which testifies to the saleability of this brand of research. One week before the results of the Fifteenth election were announced, huge signboards bore a picture of the star anchor of CNN-IBN along with Yogendra Yadav, asserting the latter’s increasing popularity.
13 The ‘notes on elections’ published in Electoral Studies favour a strongly institutional perspective, concerned almost exclusively with political parties (the alliances they form, the issues they raise, the candidates they select etc.) Interestingly, nothing is said about voters.
14 Both Brass (1985) and Palshikar (2007) make a forceful argument in favour of taking the constituency as a unit of analysis.
15 For instance, the first National Election Study, conducted by the CSDS in 1967, did not take women voters into account! (Lokniti team 2004: 5374).
16 Emphasis mine.
17 The debate on the scientific legitimacy of survey research as opposed to more theoretical, or more qualitative, approaches is by no means restricted to India. Political science is a relatively young discipline, defined more by its objects than by its methods, and by a scientific community that strives to assert its scientific credentials. In this regard, electoral surveys have an ambiguous record. On the one hand, the highly technical aspect of quantitative methods gives an image of ‘scientificity’; on the other hand, the proximity (in terms of sponsors, institutions and publication supports) of electoral surveys to opinion polls (characterized by a large margin of error, and a close association with marketing techniques) maintains a doubt on the scientificity of this sub-discipline.
18 The preference for qualitative methods actually extends to other disciplines among social sciences in India: ‘A tabulation of articles in Contributions to Indian Sociology and the Sociological Bulletin [...], though not a comprehensive account of scholarship in sociology and social anthropology, did nevertheless seem to substantiate the fact that ethnographic methods far outpaced any other kind of research method’ (Sundar et al. 2000: 2000).
19 In this regard, Mukherji’s account of State elections in the early 1980s in a constituency of West Bengal dominated by Naxalites is an exception among monographic studies of elections. The book offers a candid evocation of the methodological dilemmas, constraints and solutions inherent in studying elections, and particularly of the political agenda behind election studies (in this particular case, the author, engaged in a study of the Naxalite movement, presents himself early on as a Naxalite) (Mukherji 1983).
20 Thus in spite of the continuing efforts of NES to improve its methods, it failed to accurately predict the results of elections, both in 2004 and in 2009.
21 See, for instance, Lokniti Team 2004, in which the methodological flaws and evolutions (in terms of sample size, number of languages used, decentralization of data entry and analysis etc.) of National Election Studies are discussed in detail.
22 This problem is not restricted to survey research alone: thus Mitra evokes the ‘Americanisation of [the study of] ethnic politics in the Indian context’ (Mitra 2005: 327)
23 Linz, Stepan and Yadav 2007 represents a good example of the changing status of the Indian case in comparative studies of democracy—from an exception to a major case.
25 For instance anthropological studies tend to focus on the short period comprised between the beginning of the electoral campaign and the announcement of results. A larger timeframe is needed if we are to understand how clientelism operates through the electoral process.
Electronic reference
Stéphanie Tawa Lama-Rewal , “ Studying Elections in India: Scientific and Political Debates ” , South Asia Multidisciplinary Academic Journal [Online], 3 | 2009, Online since 23 December 2009 , connection on 19 April 2024 . URL : http://journals.openedition.org/samaj/2784; DOI : https://doi.org/10.4000/samaj.2784
About the author
Stéphanie tawa lama-rewal.
Research fellow, Centre National de la Recherche Scientifique, Paris
By this author
- Niraja Gopal Jayal, Citizenship and its Discontents: An Indian History [Full text] Published in South Asia Multidisciplinary Academic Journal , Book Reviews
- Introduction. Urban Democracy: A South Asian Perspective [Full text] Published in South Asia Multidisciplinary Academic Journal , 5 | 2011
- Introduction. Contextualizing and Interpreting the 15 th Lok Sabha Elections [Full text] Published in South Asia Multidisciplinary Academic Journal , 3 | 2009

The text only may be used under licence CC BY-NC-ND 4.0 . All other elements (illustrations, imported files) are “All rights reserved”, unless otherwise stated.
- Book Reviews
Full text issues
- 30 | 2023 The Digitalization of Urban Governance in India
- 29 | 2022 South Asia in Covid Times
- 28 | 2022 Subalternity, Marginality, Agency in Contemporary India
- 27 | 2021 Political Mobilizations of South Asians in Diaspora: Intertwining Homeland Politics and Host-Society Politics
- 26 | 2021 Engaging the Urban from the Periphery
- 24/25 | 2020 The Hindutva Turn: Authoritarianism and Resistance in India
- 23 | 2020 Unique Identification in India: Aadhaar, Biometrics and Technology-Mediated Identities
- 22 | 2019 Student Politics in South Asia
- 21 | 2019 Representations of the “Rural” in India from the Colonial to the Post-Colonial
- 20 | 2019 Sedition, Sexuality, Gender, and Gender Identity in South Asia
- 19 | 2018 Caste-Gender Intersections in Contemporary India
- 18 | 2018 Wayside Shrines: Everyday Religion in Urban India
- 17 | 2018 Through the Lens of the Law: Court Cases and Social Issues in India
- 16 | 2017 Changing Family Realities in South Asia?
- 15 | 2017 Sociology of India’s Economic Elites
- 14 | 2016 Environment Politics in Urban India: Citizenship, Knowledges and Urban Political Ecologies
- 13 | 2016 Land, Development and Security in South Asia
- 12 | 2015 On Names in South Asia: Iteration, (Im)propriety and Dissimulation
- 11 | 2015 Contemporary Lucknow: Life with ‘Too Much History’
- 10 | 2014 Ideas of South Asia
- 9 | 2014 Imagining Bangladesh: Contested Narratives
- 8 | 2013 Delhi's Margins
- 7 | 2013 The Ethics of Self-Making in Postcolonial India
- 6 | 2012 Revisiting Space and Place: South Asian Migrations in Perspective
- 5 | 2011 Rethinking Urban Democracy in South Asia
- 4 | 2010 Modern Achievers: Role Models in South Asia
- 3 | 2009 Contests in Context: Indian Elections 2009
- 2 | 2008 ‘Outraged Communities’
- 1 | 2007 Migration and Constructions of the Other
Other Contributions
- Free-Standing Articles
- What is SAMAJ?
- Editorial Board
- Advisory Board
- Partnership with EASAS
- Information for authors
- Publication Ethics and Malpractice Statement
- Subscribe to our newsletter
Informations
- Publishing policies
Newsletters
- OpenEdition Newsletter
In collaboration with
- Journal supported by the Institut des sciences humaines et sociales (InSHS) of the CNRS, 2023-2024
Electronic ISSN 1960-6060
Read detailed presentation
Site map – Syndication
Privacy Policy – About Cookies – Report a problem
OpenEdition member – Published with Lodel – Administration only
You will be redirected to OpenEdition Search
Application of Twitter sentiment analysis in election prediction: a case study of 2019 Indian general election
- Original Article
- Published: 18 May 2023
- Volume 13 , article number 88 , ( 2023 )
Cite this article
- Priyavrat Chauhan 1 ,
- Nonita Sharma 2 &
- Geeta Sikka 3
753 Accesses
Explore all metrics
A Correction to this article was published on 12 June 2023
This article has been updated
Everyone must have experienced a huge collection of political content on their social media account’s home page during election time. Most of the users are busy in liking, sharing, and commenting political posts on the social media platform at that time, and these user activities show their attitude or behaviour towards the electoral or the political party. This study has mined the collective behaviour of Twitter users towards the Indian General election 2019. This work performed weekly sentiment analysis of massive Twitter content related to electoral and political parties during election time using a lexicon-based sentiment analysis approach. Based on this empirical study, the aim is to find out the feasibility of election prediction through social media analysis in a developing country like India. Further, an explorative analysis has been performed on the collected data, which gives answers to some dominant research hypotheses formulated in this paper. This paper shows how public mood can be gauged from social media content during the election period and how it can be considered as a parameter to predict the election results along with other factors. In addition, results evaluation has been done based on mean absolute error by considering the vote share and seat share of competing parties and leaders in the election. The predicted result of this work has been compared with exit poll results from various news agencies and the actual election result. It was found that our result of election prediction is quite similar to the final election results.
This is a preview of subscription content, log in via an institution to check access.
Access this article
Price includes VAT (Russian Federation)
Instant access to the full article PDF.
Rent this article via DeepDyve
Institutional subscriptions
Sentiment Analysis in Social Media Data for Depression Detection Using Artificial Intelligence: A Review
Nirmal Varghese Babu & E. Grace Mary Kanaga

First public dataset to study 2023 Turkish general election
Ali Najafi, Nihat Mugurtay, … Onur Varol

Analyzing voter behavior on social media during the 2020 US presidential election campaign
Loris Belcastro, Francesco Branda, … Paolo Trunfio
Data availability
The dataset analysed during the current study is available from the corresponding author on reasonable request.
Change history
10 june 2023.
The original article is revised to update Equation 7 and some missed out corrections
12 June 2023
A Correction to this paper has been published: https://doi.org/10.1007/s13278-023-01096-7
RCP is a website ( https://www.realclearpolitics.com/ ) that predicts election results by calculating the average of many popular media and survey institutes.
AL Dayel A, Magdy W (2021) Stance detection on social media: state of the art and trends. Inf Process Manag. https://doi.org/10.1016/j.ipm.2021.102597
Article Google Scholar
Agarwal A, Toshniwal D, Bedi J (2020) Can Twitter help to predict outcome of 2019 Indian General Election: a deep learning based study. In: Communications in computer and information science, pp 38–53
Ahmed S, Skoric MM (2014) My name is Khan: the use of twitter in the campaign for 2013 Pakistan general election. In: Proceedings of the annual hawaii international conference on system sciences, IEEE, pp 2242–2251
Ain QT, Ali M, Riaz A et al (2017) Sentiment analysis using deep learning techniques: a review. Int J Adv Comput Sci Appl 8:424–433
Google Scholar
Al Zamal F, Liu W, Ruths D (2012) Homophily and latent attribute inference: inferring latent attributes of Twitter users from neighbors. In: ICWSM 2012—Proceedings of the 6th international AAAI conference on weblogs and social media, pp 387–390
Awais M, Hassan S-U, Ahmed A (2021) Leveraging big data for politics: predicting general election of Pakistan using a novel rigged model. J Ambient Intell Humaniz Comput 12:4305–4313. https://doi.org/10.1007/s12652-019-01378-z
BBC News (2019) Balakot: Indian air strikes target militants in Pakistan. Accessed 31 Jan 2020. https://www.bbc.com/news/world-asia-47366718
Bansal B, Srivastava S (2018) On predicting elections with hybrid topic based sentiment analysis of tweets. Procedia Computer Science 135:346–353. https://doi.org/10.1016/j.procs.2018.08.183
Bansal B, Srivastava S (2019) Lexicon-based twitter sentiment analysis for vote share prediction using emoji and N-gram features. Int J Web Based Communities 15:85–99. https://doi.org/10.1504/IJWBC.2019.098693
Batista-Navarro RT, Kontonatsios G, Mihǎilǎ C et al (2013) Facilitating the analysis of discourse phenomena in an interoperable NLP platform. Lecture notes in computer science (including subseries lecture notes in artificial intelligence and lecture notes in bioinformatics) 7816 LNCS:559–571. https://doi.org/10.1007/978-3-642-37247-6_45
Bermingham A, Smeaton AF (2011) On Using Twitter to monitor political sentiment and predict election results. In: Proceedings of the workshop on sentiment analysis where AI meets Psychology (SAAIP 2011), pp 2–10
Budiharto W, Meiliana M (2018) Prediction and analysis of Indonesia Presidential election from Twitter using sentiment analysis. J Big Data. https://doi.org/10.1186/s40537-018-0164-1
Burnap P, Gibson R, Sloan L et al (2016) 140 characters to victory?: using twitter to predict the UK 2015 general election. Elect Stud 41:230–233. https://doi.org/10.1016/J.ELECTSTUD.2015.11.017
Cambria E (2016) Affective computing and sentiment analysis. IEEE Intell Syst 31:102–107. https://doi.org/10.1109/MIS.2016.31
Cambria E, Ebrahimi M, Hossein Yazdavar A et al (2017) Challenges of sentiment analysis for dynamic events. IEEE Intell Syst 32:70–75. https://doi.org/10.1109/MIS.2017.3711649
Ceron A, Curini L, Iacus SM (2015) Using Sentiment analysis to monitor electoral campaigns: method matters—evidence from the United States and Italy. Soc Sci Comput Rev 33:3–20. https://doi.org/10.1177/0894439314521983
Chauhan P, Sharma N, Sikka G (2021) The emergence of social media data and sentiment analysis in election prediction. J Ambient Intell Humaniz Comput 12:2601–2627. https://doi.org/10.1007/s12652-020-02423-y
Chauhan P, Singh AJ (2017) Sentiment analysis: a comparative study of supervised machine learning algorithms using rapid miner. Int J Res Appl Sci Eng Technol V. https://doi.org/10.22214/ijraset.2017.11011
Chen L, Chen CLM, Lee C, Chen M (2019) Exploration of social media for sentiment analysis using deep learning. Soft Comput 24:8187–8197. https://doi.org/10.1007/s00500-019-04402-8
Clement J (2020) Twitter: most users by country. Accessed 12 Aug 2020. https://www.statista.com/statistics/242606/number-of-active-twitter-users-in-selected-countries/
Corchs S, Fersini E, Gasparini F (2019) Ensemble learning on visual and textual data for social image emotion classification. Int J Mach Learn Cybern 10:2057–2070. https://doi.org/10.1007/s13042-017-0734-0
D’Andrea A, Ferri F, Grifoni P, Guzzo T (2015) Approaches, tools and applications for sentiment analysis implementation. Int J Comput Appl 125:26–33. https://doi.org/10.5120/ijca2015905866
ECI (2019a) HIGHLIGHTS—General Election 2019a—Election Commission of India. Accessed 30 Oct 2019a. https://eci.gov.in/files/file/10991-2-highlights/
ECI (2019b) PC wise distribution of votes polled. Accessed 20 Aug 2021. https://eci.gov.in/files/file/10967-14-pc-wise-distribution-of-votes-polled/
Fang A, Ounis I, Habel P, et al (2015) Topic-centric classification of twitter user’s political orientation. In: Proceedings of the 38th international ACM SIGIR conference on research and development in information retrieval—SIGIR’15. ACM Press, New York, pp 791–794
Gayo-Avello D (2012b) No, you cannot predict elections with twitter. IEEE Internet Comput 16:91–94. https://doi.org/10.1109/MIC.2012.137
Gayo-Avello D (2013) A meta-analysis of state-of-the-art electoral prediction from twitter data. Soc Sci Comput Rev 31:649–679. https://doi.org/10.1177/0894439313493979
Gayo-Avello D (2012a) “I wanted to predict elections with twitter and all i got was this lousy paper”—a balanced survey on election prediction using twitter data, pp 1–13
Gayo-avello D, Metaxas PT, Mustafaraj E (2011) Limits of electoral predictions using social media data. In: Fifth international AAAI conference on weblogs and social media
Gentry J (2016) Package ‘twitteR’. Accessed 5 Jan 2019. https://cran.r-project.org/web/packages/twitteR/twitteR.pdf
Habimana O, Li Y, Li R et al (2020) Sentiment analysis using deep learning approaches: an overview. Sci China Inf Sci 63:1–36. https://doi.org/10.1007/s11432-018-9941-6
Hemmatian F, Sohrabi MK (2017) A survey on classification techniques for opinion mining and sentiment analysis. Artif Intell Rev. https://doi.org/10.1007/s10462-017-9599-6
Hindu T (2019a) Modi insulting Army by questioning UPA era strikes: Congress. Accessed 1 Jul 2019a. https://www.thehindu.com/elections/lok-sabha-2019/modi-is-insulting-army-by-questioning-upa-era-strikes/article27028372.ece
Huddar MG, Sannakki SS, Rajpurohit VS (2019) A Survey of computational approaches and challenges in multimodal sentiment analysis. Int J Comput Sci Eng 7:876–883. https://doi.org/10.26438/ijcse/v7i1.876883
Idan L, Feigenbaum J (2019) Show me your friends and I will tell you whom you vote for. In: Proceedings of the 2019 IEEE/ACM international conference on advances in social networks analysis and mining, ACM Press, New York, pp 816–824
India Today (2019) NDA, UPA and others: who’s friends with whom as things stand, explained. Accessed 18 Jul 2019. https://www.indiatoday.in/elections/lok-sabha-2019/story/nda-upa-others-alliances-lok-sabha-polls-2019-1528855-2019-05-19
Jaidka K, Ahmed S, Skoric M, Hilbert M (2019) Predicting elections from social media: a three-country, three-method comparative study. Asian J Commun 29:252–273. https://doi.org/10.1080/01292986.2018.1453849
JavanAmoli A, Bagheri A (2016) A review of studies conducted in opinion mining. Spec J Electron Comput Sci 2:71–83
Jungherr A, Jungherr A (2016) Twitter use in election campaigns : a systematic literature review. J Inform Tech Polit 13:72–91. https://doi.org/10.1080/19331681.2015.1132401
Karthikeyan S (2019) The federal front: what is it and can it succeed in being an alternative to the NDA Or UPA once the 2019 Lok Sabha results are announced?. Accessed 20 Aug 2019. https://www.republicworld.com/election-news/indian-general-elections/the-federal-front-what-is-it-and-can-it-succeed-in-being-an-alternative-to-the-nda-or-upa-once-the-2019-lok-sabha-results-are-announced.html
Keramatfar A, Amirkhani H (2019) Bibliometrics of sentiment analysis literature. J Inf Sci 45:3–15. https://doi.org/10.1177/0165551518761013
Khan A, Zhang H, Boudjellal N et al (2021) Election prediction on twitter: a systematic mapping study. Complexity 2021. https://doi.org/10.1155/2021/5565434
Khatua A, Khatua A, Ghosh K, Chaki N (2015) Can #Twitter_Trends predict election results? Evidence from 2014 indian general election. 2015 48th Hawaii international conference on system sciences. IEEE, New York, pp 1676–1685
Chapter Google Scholar
Lai M, Cignarella AT, Hernández Farías DI et al (2020) Multilingual stance detection in social media political debates. Comput Speech Lang 63:1–27. https://doi.org/10.1016/j.csl.2020.101075
Ligthart A, Catal C, Tekinerdogan B (2021) Systematic reviews in sentiment analysis: a tertiary study. Artif Intell Rev. https://doi.org/10.1007/s10462-021-09973-3
Liu T, Ding X, Chen Y et al (2016) Predicting movie Box-office revenues by exploiting large-scale social media content. Multimed Tools Appl 75:1509–1528. https://doi.org/10.1007/s11042-014-2270-1
Liu H, Member S, Chatterjee I et al (2020) Aspect-based sentiment analysis : a survey of deep learning methods. IEEE Trans Comput Soc Syst 7:1358–1375
LokSabha (2020) Lok Sabha. Accessed 7 Sep 2020. https://loksabha.nic.in/
Loria Steven (2020) textblob Documentation Release 0.16.0. Accessed from. https://textblob.readthedocs.io/en/dev/authors.html
Makazhanov A, Rafiei D, Waqar M (2014) Predicting political preference of twitter users. Soc Netw Anal Min 4:1–15. https://doi.org/10.1007/s13278-014-0193-5
Medhat W, Hassan A, Korashy H (2014) Sentiment analysis algorithms and applications: a survey. Ain Shams Eng J 5:1093–1113. https://doi.org/10.1016/j.asej.2014.04.011
Metaxas PT, Mustafaraj E, Gayo Avello D (2011) How (Not) to Predict Elections. 2011 IEEE third int’l conference on privacy, security, risk and trust and 2011 IEEE third int’l conference on social computing. IEEE, New York, pp 165–171
Mäntylä MV, Graziotin D, Kuutila M (2018) The evolution of sentiment analysis—a review of research topics, venues, and top cited papers. Comput Sci Rev 27:16–32
Nazir F, Ghazanfar MA, Maqsood M et al (2019) Social media signal detection using tweets volume, hashtag, and sentiment analysis. Multimed Tools Appl 78:3553–3586. https://doi.org/10.1007/s11042-018-6437-z
Pennacchiotti M, Popescu A-M (2011) Democrats, republicans and starbucks afficionados. In: Proceedings of the 17th ACM SIGKDD international conference on Knowledge discovery and data mining—KDD ’11. ACM Press, New York, p 430
Prasetyo ND, Hauff C (2015) Twitter-based election prediction in the developing world. In: HT 2015—proceedings of the 26th ACM conference on hypertext and social media, pp 149–158
Preotiuc Pietro D, Hopkins DJ, Liu Y, Ungar L (2017) Beyond binary labels: political ideology prediction of twitter users. ACL 2017 55th Annu Meet Assoc Comput Linguist Proc Conf (long Pap) 1:729–740. https://doi.org/10.18653/v1/P17-1068
Priyavrat SN, Sikka G (2021) Multimodal sentiment analysis of social media data: a review. In: Singh PK, Singh Y, Kolekar MH et al (eds) Recent innovations in computing. Springer, Singapore, pp 545–561
Ramani S (2019) Analysis: highest-ever national vote share for the BJP—The Hindu. Accessed 13 Jul 2019. https://www.thehindu.com/elections/lok-sabha-2019/analysis-highest-ever-national-vote-share-for-the-bjp/article27218550.ece
Rao D, Yarowsky D, Shreevats A, Gupta M (2010) Classifying latent user attributes in twitter. In: Proceedings of the 2nd international workshop on Search and mining user-generated contents SMUC 10, ACM Press, New York, pp 37–44
Sanga A, Samuel A, Rathaur N et al (2020) Bayesian prediction on PM Modi’s future in 2019. Lecture notes in electrical engineering. Springer, Charm, pp 885–897
Sharma V (2019a) 2019 Vs 2014: how much votes BJP and Congress got? Here is the comparison. Accessed 17 Jun 2019. https://english.newsnationtv.com/election/lok-sabha-election-2019/2019-vs-2014-how-much-votes-bjp-and-congress-got-here-is-the-comparison-225589.html
Sharma V (2019b) Here is complete list of BJP-led NDA candidates for Lok Sabha Elections 2019b. Accessed 21 Jun 2019. https://english.newsnationtv.com/election/lok-sabha-election-2019/here-is-complete-list-of-nda-candidates-for-lok-sabha-elections-2019-219182.html
Sharma V (2019c) Here is complete list of Congress-led UPA candidates for Lok Sabha Elections 2019c. Accessed 21 Jun 2019. https://english.newsnationtv.com/election/lok-sabha-election-2019/here-is-complete-list-of-congress-led-upa-candidates-for-lok-sabha-elections-2019-219216.html
Shi L, Agarwal N, Agrawal A, et al (2012) Predicting US primary elections with twitter. In: Workshop social network and social media analysis: methods, models and applications (NIPS), pp 1–8
Singh P, Kumar K, Kahlon KS, Sawhney RS (2019) Can tweets predict election results? insights from twitter analytics. Communications in computer and information science. Springer, Singapore, pp 271–281
Statista (2015) Twiter users in India. Accessed 10 Jun 2019. https://www.statista.com/statistics/381832/twitter-users-india/
The Hindu (2019a) As it happened | General election 2019b concludes, most exit polls project majority for BJP-led NDA. Accessed 17 Jun 2019a. https://www.thehindu.com/elections/lok-sabha-2019/general-election-phase-7-and-exit-polls-live-updates-may-19-2019/article27172356.ece
The Hindu (2019b) Lok Sabha election 2019c: Mahagathbandhan leaders to discuss seat-sharing formula today. Accessed 9 Jun 2019b. https://www.thehindubusinessline.com/news/national/mahagathbandhan-leaders-to-thrash-out-seat-sharing-in-delhi-by-thursday/article26518823.ece
Times of India (2019a) Election Results 2019a: Lok Sabha election results & Assembly Election results. Accessed 23 Sep 2019. https://timesofindia.indiatimes.com/elections/results
Times of India (2019b) Lok Sabha Polls 2019b: list of Political parties in Lok Sabha Elections. Accessed 23 Sep 2019b. https://timesofindia.indiatimes.com/elections/lok-sabha-elections/parties
Tsakalidis A, Papadopoulos S, Cristea AI, Kompatsiaris Y (2015) Predicting elections for multiple countries using twitter and polls. IEEE Intell Syst 30:10–17. https://doi.org/10.1109/MIS.2015.17
Unankard S, Li X, Sharaf M et al (2014) Predicting elections from social networks based on sub-event detection and sentiment analysis. Lecture Notes in Comput Sci (incl Subser Lect Notes Artif Intell Lecture Notes Bioinf) 8787:1–16. https://doi.org/10.1007/978-3-319-11746-1_1
Vamvas J, Sennrich R (2020) X-stance: A multilingual multi-target dataset for stance detection. In: CEUR Workshop Proceedings
Volkova S, Coppersmith G, Van Durme B (2014) Inferring user political preferences from streaming communications. In: 52nd Annual Meeting of the Association for Computational Linguistics, ACL 2014—Proceedings of the Conference, pp 186–196
Wang L, Gan JQ (2017) Prediction of the 2017 French election based on Twitter data analysis. In: 2017 9th Computer Science and Electronic Engineering Conference, CEEC 2017—Proceedings, pp 89–93. https://doi.org/10.1109/CEEC.2017.8101605
Xie Z, Liu G, Wu J, Tan Y (2018) Big data would not lie: prediction of the 2016 Taiwan election via online heterogeneous information. EPJ Data Sci 7:1–16. https://doi.org/10.1140/epjds/s13688-018-0163-7
YouTube (2019) PM Modi addresses a public rally in Sikar, Rajasthan - YouTube. Accessed 4 Aug 2019 https://www.youtube.com/watch?v=KSoWZn-7zmw
Yusof NN, Mohamed A, Abdul-Rahman S (2015) Reviewing classification approaches in sentiment analysis. Int Conf Soft Comput Data Sci SCDS 2015:43–53
Zubiaga A, Wang B, Liakata M, Procter R (2019) Political homophily in independence movements: analyzing and classifying social media users by national identity. IEEE Intell Syst 34:34–42. https://doi.org/10.1109/MIS.2019.2958393
Download references
No funding was received for conducting this study.
Author information
Authors and affiliations.
Department of Computer Science & Engineering, Dr BR Ambedkar National Institute of Technology, Jalandhar, Punjab, 144027, India
Priyavrat Chauhan
Department of Information Technology, Indira Gandhi Delhi Technical University For Women (IGDTUW), Kashmere Gate, Madrasa Road, Opposite St. James Church, Delhi, 110006, India
Nonita Sharma
Department of Computer Science & Engineering, National Institute of Technology Delhi, Plot No. FA7, Zone P1, GT Karnal Road, Delhi, 110036, India
Geeta Sikka
You can also search for this author in PubMed Google Scholar
Contributions
All authors contributed to the study conception and design. Material preparation, data collection and analysis were performed by PC. The first draft of the manuscript was written by PC and all authors commented on previous versions of the manuscript. All authors read and approved the final manuscript.
Corresponding author
Correspondence to Priyavrat Chauhan .
Ethics declarations
Conflict of interest.
The authors have no competing interests to declare that are relevant to the content of this article.
Additional information
Publisher's note.
Springer Nature remains neutral with regard to jurisdictional claims in published maps and institutional affiliations.
The original article is revised to update Equation 7 and some missed out corrections.
Appendix A: Major alliance of Indian political parties
Appendix b: hashtags used during week-wise data collection, rights and permissions.
Springer Nature or its licensor (e.g. a society or other partner) holds exclusive rights to this article under a publishing agreement with the author(s) or other rightsholder(s); author self-archiving of the accepted manuscript version of this article is solely governed by the terms of such publishing agreement and applicable law.
Reprints and permissions
About this article
Chauhan, P., Sharma, N. & Sikka, G. Application of Twitter sentiment analysis in election prediction: a case study of 2019 Indian general election. Soc. Netw. Anal. Min. 13 , 88 (2023). https://doi.org/10.1007/s13278-023-01087-8
Download citation
Received : 08 May 2022
Revised : 02 March 2023
Accepted : 24 April 2023
Published : 18 May 2023
DOI : https://doi.org/10.1007/s13278-023-01087-8
Share this article
Anyone you share the following link with will be able to read this content:
Sorry, a shareable link is not currently available for this article.
Provided by the Springer Nature SharedIt content-sharing initiative
- Election prediction
- Twitter sentiment analysis
- Indian general election 2019
- Indian Lok Sabha election 2019
- Sentiment analysis
- Find a journal
- Publish with us
- Track your research
Academia.edu no longer supports Internet Explorer.
To browse Academia.edu and the wider internet faster and more securely, please take a few seconds to upgrade your browser .
- We're Hiring!
- Help Center
General Elections
- Most Cited Papers
- Most Downloaded Papers
- Newest Papers
- Save to Library
- Last »
- Reformasi 1998 Dan Kesan Kepada Pru 1999 Follow Following
- Ecosoc Rights Follow Following
- Political Campaign Follow Following
- Media and Democracy Follow Following
- Local Politics Follow Following
- Politics Follow Following
- Democracy Follow Following
- Machiavellianism Follow Following
- Bureaucracy Follow Following
- Public PolicyStudies Follow Following
Enter the email address you signed up with and we'll email you a reset link.
- Academia.edu Publishing
- We're Hiring!
- Help Center
- Find new research papers in:
- Health Sciences
- Earth Sciences
- Cognitive Science
- Mathematics
- Computer Science
- Academia ©2024

An official website of the United States government
The .gov means it’s official. Federal government websites often end in .gov or .mil. Before sharing sensitive information, make sure you’re on a federal government site.
The site is secure. The https:// ensures that you are connecting to the official website and that any information you provide is encrypted and transmitted securely.
- Publications
- Account settings
Preview improvements coming to the PMC website in October 2024. Learn More or Try it out now .
- Advanced Search
- Journal List
- PeerJ Comput Sci
- PMC10495957
On the frontiers of Twitter data and sentiment analysis in election prediction: a review
Quratulain alvi.
1 Department of Software Engineering, University of Management and Technology, Lahore, Punjab, Pakistan
Syed Farooq Ali
Sheikh bilal ahmed, nadeem ahmad khan.
2 Syed Babar Ali School of Science and Engineering, Lahore University of Management Sciences, Lahore, Punjab, Pakistan
Mazhar Javed
Haitham nobanee.
3 Faculty of Humanities and Social Sciences, University of Liverpool, Liverpool, United Kingdom
4 College of Business, Abu Dhabi University, Abu Dhabi, United Arab Emirates
5 Oxford Centre for Islamic Studies, University of Oxford, Oxford, United Kingdom
Election prediction using sentiment analysis is a rapidly growing field that utilizes natural language processing and machine learning techniques to predict the outcome of political elections by analyzing the sentiment of online conversations and news articles. Sentiment analysis, or opinion mining, involves using text analysis to identify and extract subjective information from text data sources. In the context of election prediction, sentiment analysis can be used to gauge public opinion and predict the likely winner of an election. Significant progress has been made in election prediction in the last two decades. Yet, it becomes easier to have its comprehensive view if it has been appropriately classified approach-wise, citation-wise, and technology-wise. The main objective of this article is to examine and consolidate the progress made in research about election prediction using Twitter data. The aim is to provide a comprehensive overview of the current state-of-the-art practices in this field while identifying potential avenues for further research and exploration.
Introduction
The emergence of the information revolution has led to new economies centered around the flow of data, information, and knowledge ( Serrat & Serrat, 2017 ). The Internet has brought about a significant transformation in content consumption. The vast amounts of data generated, coupled with the rapid dissemination of information and its easy accessibility, have turned social platforms into prime examples of interactions among millions of individuals ( Gadek et al., 2017 ). These individuals actively engage with the shared content, effectively transforming their networks into successful platforms for exchanging information ( Hu & Wang, 2020 ). Social media (SM) started its journey in the late 90s but got the world’s attention by providing a means of communication with people who are far away or to make friends. This ease became an addiction as it grew with more and more social networking sites.
Social networking sites allow people to express their thoughts, ideas, opinions, and feelings on various worldly and social matters through reactions, commenting, or sharing posts ( Ceron, Curini & Iacus, 2015b ). The exponential development of internet-based life and informal organization locales like Facebook and Twitter has begun to assume a developing part on certifiable legislative issues in recent years ( Cottle, 2011 ).
Facebook and Twitter played a facilitating role for individuals, industries, and political nations worldwide ( Segerberg & Bennett, 2011 ; Liao et al., 2018 ). Political parties such as Swedish Pirate Party, German Pirate Party, and Italy’s Five Star Movement Party used social networking sites to send the agenda to the whole country ( Metzgar & Maruggi, 2009 ).
The USA election campaigns in 2008, 2012, and 2016 demonstrated the ground-breaking effect of SM on the general population of the United States. Obama was the first politician to effectively utilize SM as a campaign strategy ( Smith, 2009 ). By the end, they knew the names of every one of the 69,406,897 citizens who were ready to vote in favor of Obama. To persuade the citizens, Obama hired an IT specialist in data mining and machine learning who sent customized messages for a cost-effective outreach to voters ( Vitak et al., 2011 ). The overall digital enthusiasm for Trump was three times higher than Clinton, as indicated by Google Pattern Analysis, which made him victorious in the elections ( MLLC, 2015 ). Donald Trump was the most mentioned person on Twitter and Facebook, with over 4 million Twitter followers more than Clinton ( Stromer-Galley, 2014 ).
Following the footsteps, many other countries like Sweden ( Larsson & Moe, 2012 ; Strömbäck & Dimitrova, 2011 ), India ( Rajput, 2014 ; Pal, Chandra & Vydiswaran, 2016 ) and Pakistan ( Ahmed & Skoric, 2014 ; Razzaq, Qamar & Bilal, 2014 ) also made extensive use of SM and conducted successful campaigns in the history of recent politics. The research community used different data analysis and mining processes and found the hidden patterns from trillions of data gathered from SM. They analyzed user sentiment from the written text on a user’s profile. This behavioral study is called sentiment analysis (SA) ( Carlisle & Patton, 2013 ). Numerous election prediction algorithms were conducted using Twitter data based on sentiment analysis ( Carlisle & Patton, 2013 ; Rajput, 2014 ), and the rest are discussed in the later sections.
After the USA elections (2008, 2012, 2016) and the Pakistan elections in 2013, the role of social media in politics, based on sentiment analysis, has been widely studied and examined ( Carlisle & Patton, 2013 ; Wolfsfeld, Segev & Sheafer, 2013 ; Ahmed & Skoric, 2014 ; Razzaq, Qamar & Bilal, 2014 ; Safdar et al., 2015 ). During the research, a lot of election prediction was performed using Twitter data based on sentiment analysis ( He et al., 2019 ; Ahmed & Skoric, 2014 ; Razzaq, Qamar & Bilal, 2014 ; Bagheri & Islam, 2017 ; Wang et al., 2012 ; Younus et al., 2014 ; Kagan, Stevens & Subrahmanian, 2015 ; Nickerson & Rogers, 2014 ). Numerous studies explore the realm of social media prediction, opinion mining, and information network mining techniques to establish standardized approaches to assess the predictive capabilities and limitations associated with the information embedded within social media data ( Cambria, 2016 ; Kreiss, 2016 ; Mahmood et al., 2013 ).
The primary motivation of this study is to contribute to the existing body of scientific literature on sentiment analysis by focusing on its application in election prediction using Twitter data. This study aims to delve deeper into aspects that may have received limited attention in previous works. Through a systematic, comprehensive, and detailed method, this review offers a fresh perspective on the causal factors influencing temporal sentiment analysis in social media to stimulate further discussions and considerations for enhancing future studies in this domain. Furthermore, an integral part of our work, which we plan to expand in future research, is a practical evaluation of the applicability and reproducibility of existing and upcoming techniques. While these approaches exhibit impressive results, their practical implementation can be challenging. By offering insights into their potential limitations, we aim to provide a realistic outlook for their utilization.
There are generally three main levels of sentiment analysis: document level, sentence level, and aspect level sentiment analysis. Document-level sentiment analysis involves analyzing the overall sentiment of a document, such as a blog post or news article. Sentence-level sentiment analysis involves analyzing the sentiment of individual sentences within a document, while aspect-level sentiment analysis involves analyzing the sentiment expressed towards a specific aspect or feature of an entity, such as the battery life of a smartphone. Significant progress has been made in election prediction in the last two decades. This survey paper aims to examine the use of sentiment analysis for predicting election outcomes. Furthermore, it will identify research gaps and propose future research directions. The structure of the article continues as follows: the Literature Review section provides a theoretical framework by conducting a literature review to support the study. The methodologies employed are outlined in the Methodology section. The Results focuses on discussing the primary insights and results derived from the study. Finally, the Conclusion concludes the document by summarizing the main findings, limitations and highlighting potential areas for future research.
Theoretical framework
The exploration of election prediction using Twitter data and sentiment analysis has yet to be thoroughly examined within academia, indicating a need for an extensive survey of existing research in this domain. While some surveys have been conducted in the literature, they primarily focus on utilizing various social media platforms for election predictions, while others may be outdated or lack comprehensive coverage of all aspects related to election prediction using Twitter data. A recent survey ( Nayeem, Sachi & Kumar, 2023 ) has been done in this field where researchers presented the significant publications ever done to analyze election prediction using different social media platforms. Some articles have ( Baydogan & Alatas, 2022 ; Chakarverti, 2023 ; Baydogan & Alatas, 2021a ) focused on evaluating the performance of artificial intelligence-based algorithms for hate speech detection and presents a novel approach for automatically detecting online hate speech. Baydogan & Alatas (2021b) proposed the use of the Social Spider Optimization algorithm for sentiment analysis in social networks while Baydogan & Alatas (2018) explores the use of the Konstanz Information Miner (KNIME) platform for sentiment analysis in social networks. Another paper by Rodríguez-Ibánez et al. (2023) examined sentiment analysis’s existing methods and causal effects, particularly in domains like stock market value, politics, and cyberbullying in educational centers. The paper highlighted that the research efforts are not evenly distributed across fields, with more emphasis on marketing, politics, economics, health, etc. Yu & Kak (2012) surveyed the domains that can be predicted utilizing current social media data by presenting a comprehensive overview of the existing methods and data sources used in past papers to predict election results. Kwak & Cho (2018) presented a survey that explores the insights gained and limitations encountered when utilizing social media data. The paper further examined the approaches to overcome these limitations and proposed effective ways of using social media data to comprehend public opinion in electoral contexts. Bilal et al. (2019) presented a survey listing the methods and data sources used in past efforts to predict election outcomes. In Rousidis, Koukaras & Tjortjis (2020) , the authors examined current and emerging areas of social media prediction since 2015, specifically focusing on the predictive models employed. It reviewed literature, statistical analysis, methods, algorithms, techniques, prediction accuracy, and challenges. But this paper concentrates on something other than a specific field like politics. In Skoric, Liu & Jaidka (2020) , authors presented the results of a meta-analysis that examines the predictive capability of social media data using various data sources and prediction methods. The analysis revealed machine learning-based approaches outperform lexicon-based methods, and combining structural features with sentiment analysis yields the most accurate predictions. Kubin & Von Sikorski (2021) investigated the influence of social media on political polarization. The study highlighted a heavy emphasis on Twitter and American samples while noting a scarcity of research exploring how social media can reduce polarization. The work in Cano-Marin, Mora-Cantallops & Sánchez-Alonso (2023) provided an evaluation and classification of the predictive potential of Twitter. The paper identified gaps and opportunities in developing predictive applications of user-generated content on Twitter.
Methodology
A systematic literature review was conducted following a six-step guideline for management research ( Drus & Khalid, 2019 ) such as formulating the research questions, identification of necessary criteria for the study, potentially relevant literature retrieval, analyzing the relevant information gathered from the literature and the results of the review were reported. The current study addresses the following two questions:
- 1. What approaches are proposed by the research community to analyze the role of SM especially Twitter in politics?
- 2. How can we divide the research done in this area into different time-based intervals (eras)? What are the main strengths and weaknesses of each era?
- What are the main strengths and weaknesses of each era?
To address the research inquiries, we conducted a systematic literature review (SLR) following the guidelines provided by Kitchenham (2004) and used it in many surveys in different fields. These guidelines emphasized the importance of identifying the need for the review, determining the relevant data sources, providing a comprehensive review process description, presenting the results clearly, and identifying research gaps to facilitate further investigation. To ensure the inclusion of recent and up-to-date methodologies employed by researchers, we collected a substantial corpus of 250 documents spanning from 2008 (after the launch of Twitter in March 2006) to March 2023.
To curate our dataset, we utilized multiple databases to filter publications based on publication dates. We extracted papers from the first three pages of the search results, ensuring a well-balanced dataset by prioritizing the most cited publications. We only selected the research papers, not surveys or reports. Through this SLR, we successfully analyzed 80 papers that conformed to our predefined criteria. The detailed stages are explained below. Figure 1 exhibits the visual representation of the methodology.

Stage 1: Screening
We collected 250 articles focusing on the elections of the USA 2008, Arab Spring 2010, USA 2012, Pakistan 2013, India 2014, USA 2016, and Pakistan 2018 from various databases such as IEEE, Springer, Emerald Insight, Science Direct, Scopus, and Association for Computing Machinery (ACM). The search criteria were based on keywords such as sentiment analysis, predicting election results and election prediction classification using social media, election prediction using sentiment analysis, election prediction using Twitter data, sentiment analysis using Twitter data, and social network analysis through sentiment analysis. The resultant articles were then analyzed based on the title and abstract of the articles. After the analysis, only those papers that directly correlated with election prediction and had valid digital object identifiers (DOI) were selected. In doing so, 162 articles were selected by the end of the screening process.
Stage 2: Eligibility analysis
After the screening process, publications related to analysis performed with other data sets than Twitter, like Facebook, surveys, and papers whose purpose was not to use Twitter as a predictive system, were excluded from our repository. So, the final number of eligible articles was further narrowed down to 80 papers as the study was based on election prediction using Twitter data. Thus, the resultant repository was quite reasonable for making conclusions and inferences about the impact of SM and different classification approaches performed on elections in various countries.
Pre-processing techniques
Pre-processing techniques are those technique(s) applied to the raw dataset to avail formatted, error-free dataset. The relevant algorithm(s) then use this processed dataset to achieve maximum accuracy with minimal deterioration in their otherwise smooth performance.
Stemming is a technique that refers to all variations of a word to its root word, such as ‘warming’, ‘warmest’, ‘warmed,’ and ‘warmer’, which will be stemmed from the word ‘warm.’ This method reduces the time and memory space by removing suffixes that have exactly matching meanings and stem. For sentiment analysis on the text data, every word should be represented by the stem rather than the word mentioned in the text ( Al-Khafaji & Habeeb, 2017 ).
Stop word removal
Stop words are the words that are useless within the raw dataset. These words do not provide helpful information in the data set, so they must be removed to save computation time, storage, and space and improve the algorithm’s efficiency. Most stop words are pronouns and helping verbs like is, of, the, to, and/or ( Al-Khafaji & Habeeb, 2017 ).
Tokenization
Tokenization is a method to split the words within a sentence. Each split character, word, or symbol is called a token. It is an appropriate method in text analysis ( Al-Khafaji & Habeeb, 2017 ). Like, [the president has worked well] will be tokenized into [the, president, has, worked, well] ( Wongkar & Angdresey, 2019 ). These tokens help identify a content’s intent which helps in sentiment or text analysis.
Election prediction approaches
This section classifies all the research papers into various approaches. The taxonomy of these approaches is presented in Fig. 2 .

Statistical approach
The authors of Ibrahim et al. (2015) presented a new approach for predicting the Indonesian Presidential elections in 2014. Their approach collected data from Twitter and preprocessed it by removing usernames and website links. Furthermore, the Twitter buzzers ( Ibrahim et al., 2015 ) were eliminated using an automatic technique to collect data from real Twitter users and avoid unusual noise in it. The cleaned data was then subdivided into sub-tweets, labeled with a candidate’s name, and their sentiment polarity was computed. They further used mean absolute error (MAE) metric to evaluate the performance, resulting in an MAE of up to 61%.
In another study, Bansal & Srivastava (2018) introduced a novel method called Hybrid Topic Based Sentiment Analysis (HTBSA) for forecasting election results using tweets. The tweets were preprocessed using text formatting techniques, and then the topics were generated using the Biterm Topic Model (BTM). HTBSA was conducted based on the sentiments of topics and tweets, resulting in an 8.4% MAE ( Eq. (1) ).
Similarly, the authors presented Lexicon-based Twitter sentiment analysis for forecasting elections using emoji and N-gram features in 2019 ( Bansal & Srivastava, 2019 ). Unlike previous studies, sentiment polarity will be analyzed using non-textual data such as emoji(s). The authors gathered data from Twitter while restricting themselves to Uttar Pradesh (UP) geo-location. The data was cleaned from HTML tags, scripts, advertisements, stopwords, punctuations, special symbols, and white spaces. Duplicate tweets were also eliminated in the process. The refined data was then converted to bi-grams and tri-grams, followed by sentiment labeling. Simultaneously, emoji unicode was compared with developed n-grams, and its sentiment was labeled. Consequently, both sentiments were used to calculate election prediction. Another mathematical algorithm was presented in ( Nawaz et al., 2022 ) based on sentiment forecasting for Pakistan democratic elections. The authors manually annotated tweets to avoid implications of spammed data among the datasets. Then, aspects of filtered tweets were extracted, assigning grammatical forms to each word in the sentence. The gathered factors were associated with opinions using the semantic similarity measure RhymeZone ( Whitford, 2014 ). Once the association was done, the Bayesian theorem was applied, which classified tweets with 95% accuracy.
Ontology approach
The authors of Budiharto & Meiliana (2018) forecasted the Indonesian presidential election using tweets from presidential candidates of Indonesia based on a preprocessing algorithm. The tweets were processed with text formatting techniques, including stopwords in the Indonesian language and special character elimination. Once the tweets were refined, top words, favorite lines, and re-tweets were counted. Then the authors calculated the polarity of positive, negative, and neutral reviews. In Salari et al. (2018) , researchers proposed text and metadata analysis to predict Iran’s presidential elections in 2017. The text data were gathered in the Persian language from two different platforms: Telegram and Twitter messages. The data was then analyzed using various analyses: sentiment analysis of hashtags, sentiment analysis of posts using Lexipers ( Sabeti et al., 2019 ), time analysis, and several views and users of each message analysis (Telegram). The first two analyses were text analysis, while the others were metadata information analysis. In doing so, the model achieved 97.3% accuracy in predicting the presidential election.
Lexicon based approach
In 2019, Oyebode and Oriji conducted sentiment analysis to forecast Nigeria’s presidential election 2019 ( Oyebode & Orji, 2019 ). The data was extracted from Nairaland ( Nelson, Loto & Omojola, 2018 ) using a web scraping approach, and they were preprocessed with text cleaning techniques. The resultant data were fed to three lexicon-based classifiers (Vader ( Hutto & Gilbert, 2014 ), TextBlob, and Vader-Ext) and to train five machine learning classifiers, namely support vector machine (SVM), logistic regression (LR), multinomial naive Bayes (MNB), stochastic gradient descent (SGD), and random forest (RF). When the classifiers were evaluated, the proposed Vader-Ext outperformed all other classifiers as it resulted in an 81.6% accuracy rate.
Supervised learning approach
Machine learning (ML) is a field of software engineering that uses measurable procedures to enable computer systems to “learn” with information without being programmed explicitly. ML tasks are classified as supervised, unsupervised and deep learning. In 2010, the authors presented an automated method that evaluates sentiments via linguistically analyzed documents ( Pak & Paroubek, 2010a ). Those documents were trained for the NB classifier and tested using n-gram as a feature. In 2012, the authors of Wang et al. (2012) proposed a real-time election prediction system that analyzed the opinions of various users on Twitter. The opinions were anatomized and later used to train and test the NB classifier. A unique prediction model for Elections held in Pakistan in 2013 was presented in Mahmood et al. (2013) . A set of tweets were gathered according to predictive models, which were later cleaned and were used to train CHAID (chi-squared automatic interaction detector) decision tree (DT), SVM, and NB classifiers. When the classifiers were evaluated with test data, the CHAID decision tree dominated compared to SVM and NB ( Eq. (2) ).
In 2014, the authors of Razzaq, Qamar & Bilal (2014) proposed a prediction system that evaluated the power of election prediction on the Twitter platform. The authors gathered and preprocessed tweets by eliminating duplicate tweets, URLs, whitespaces, and manual labeling. Furthermore, the Laplace method and Porter Stemming avoided zero values. Processed training data was used to train RF, SVM, and NB classifiers. When the classifiers were tested, NB dominated SVM and RF. Jose & Chooralil (2015) introduced a novel election prediction model using word sense disambiguation. The data was acquired from Twitter which was then cleansed by removing usernames, hashtags, and special characters. The negation handling technique was also applied to enhance the classification accuracy further. Speech tagging and tokenization were done on refined tweets provided by a word sense disambiguation classifier for categorization. The classifier attained a 78.6% accuracy rate.
Tunggawan & Soelistio (2016) presented a predictive model for the 2016 US presidential election. They gathered data from Twitter, which went through simple filtration techniques such as URLs and candidate name removal to make the resultant data precise. In doing so, 41% of the data were eliminated. Then the data was labeled manually and fed to the NB classifier ( Eq. (3) ). The classifier predicted 54.8% accuracy. Sharma and Moh proposed a supervised election prediction method using sentiment analysis on Hindi Twitter data ( Sharma & Moh, 2016 ). In this method, raw Hindi Twitter data underwent a text-cleaning module that removed negated words, stopwords, special characters, emoticons, hashtags, website URLs, and retweet text. 2 supervised (NB, SVM) and one unsupervised (Dictionary based) algorithms were used for classification. The dictionary-based classifier evaluated the tweets with 34% accuracy, whereas NB and SVM classifiers were trained with 80% accuracy of the data. In contrast, the remaining 20% of the data was used for the evaluation purpose, which resulted in 62.1% and 78.4%, respectively.
Ramteke et al. (2016b) presented a two-stage election prediction framework using sentiment analysis using Twitter data and TF-IDF. Further, the data was labeled using hashtag clustering and VADER techniques. 80% of the labeled data was used for training, and the remaining 20% was used for testing the classification algorithm. An accuracy rate of 97% was achieved when the classifier was tested. Ceron-Guzman and Leon-Guzman presented a sentiment analysis approach on Colombia Presidential Election 2014 ( Cerón-Guzmán & León-Guzmán, 2016 ). Twitter data was cleaned and normalized in two stages: basic and advanced pre-processing. The data was stripped from URLs, emails, emoticons, hashtags, and special characters in the basic pre-processing stage. After then, the data was forwarded to the advanced pre-processing step, where lexical normalization and negation handling techniques were applied to refine the data further. Once the text was normalized, it was modified to a feature vector, which was later fed to the classifier. The labeled dataset was split into 80:20 ratios for training and testing classifiers. Overall, the classifier performed with 60.19% accuracy when evaluated on test data. Singh, Sawhney & Kahlon (2017) presented a novel method for forecasting US Presidential elections using sentiment analysis. After collecting data from Twitter, the authors implied a restriction to consider only one tweet per user. All duplicate tweets were removed to avoid interference affecting the method’s performance. Then unwanted HTML tags, web links, and special characters/symbols were removed from the data. The refined data was then used to train the SVM classifier. Once the classifier was trained, it was evaluated with the test data, i.e., to classify the polarity of the data, attaining a 79.3% accuracy rate.
In 2018, Bilal et al. (2018) presented a deep neural network application to forecast the electoral results of Pakistan 2018. They collected 56,000 tweets about the general elections in 2013 and treated them with text-cleaning techniques. The resultant data was then used to train Recurrent Neural Network (RNN). Once the RNN was trained, it was evaluated with test data resulting in an 86.1% prediction rate. In 2019, a new methodology was presented in Joseph (2019) , which predicted Indian general elections using a decision tree. Ruling and opposing parties’ data was gathered from Twitter. Stopwords, regular expressions, emojis, Unicode, and punctuation, were pruned from the data. The resultant data was then tokenized and fed to the decision tree classifier for training. Once the classifier was trained, it was evaluated, which resulted in 97.3% accuracy. An efficient method to forecast the Indonesian presidential election using sentiment analysis was presented in Kristiyanti & Umam (2019) . The authors collected data from Twitter, tokenized them, and generated Bi-grams(three-letter word combinations). Unlike previous research, the feature selection was made using the particle swarm optimization (PSO) algorithm and genetic algorithm (GA) algorithm separately. Then those features were used to train the SVM classifier. Once the classifier was trained, SVM with PSO performance dominated, against SVM with GA, with 86.2% accuracy rate.
Similarly, Oussous, Boulouard & Zahra (2022) proposed another Arabic sentiment analysis framework that forecasted the Moroccan general election 2021. The data was collected in Arabic from the Hespress website (a Moroccan news website). Then it was treated with text cleaning techniques (tokenization, normalization, and stop words removal) so that the dimensionality and processing time of the framework could be reduced. Term frequency (TF) was used to acquire feature vectors which were then passed on to several ML classification models such as SVM, NB, Adaboost, and LR for training. The classifiers predicted sentiment polarity with 94.35%, 62.02%, 87.55%, and 88.64% accuracy rates.
Deep learning approach
Hidayatullah, Cahyaningtyas & Hakim (2021) conducted sentiment analysis using a neural network to predict the Indonesian presidential election 2019. Two different datasets, i.e., before and after the elections, were collected and labeled using a pseudo-labeling technique. Then they were preprocessed with text-cleaning techniques, including case folding, word normalization, and stemming. This study trained three traditional ML classifiers (SVM, LR, and MNB) and five deep learning classifiers (LSTM, CNN, CNN+LSTM, GRU+LSTM, and bidirectional LSTM). Once the classifiers were ready, they were all evaluated by test data. SVM and bidirectional LSTM ruled better accuracy within their respective categories, but overall, bidirectional LSTM outperformed SVM by gaining an 84.6% accuracy rate. In another study, researchers presented a method for predicting USA presidential elections 2020 using social media activities ( Singh et al., 2021 ). The dataset was pretreated with text formatting techniques plus TF-IDF vectorization. They were then fed into NB, SVM, TextBlob, Vader, and BERT classification models for training and testing purposes. Compared to other classifiers, the BERT classifier prevailed with a 94% precision rate.
In Ali et al. (2022) , the authors introduced a deep learning model to forecast Pakistan general elections based on sentiment analysis. The dataset related to Pakistan general elections 2018 was gathered from Twitter, and they were labelled manually. Then the data was preprocessed with data transformation, tokenization, and stemming. Further, the proposed deep learning model was trained and evaluated with training and test data, respectively, resulting in a 92.47% prediction rate.
Research trends in algorithms and techniques of SM in politics: from beginning to date
Research objective 2: What are the research trends in algorithms and techniques of big social data in different time-based eras?
Era 1 (2010–2017)
This was the era where the research community were onset on innovating and developing election forecasting algorithms before actual election commencement. The prompt goal of their work was to predict and classify sentiments among digital text with optimal accuracy rate.
Pak & Paroubek (2010a) presented a novel method to forecast elections using sentiment analysis. Thus, the method predicted with 60% accuracy. In 2012, Wang et al. (2012) proposed an election prediction system focusing on US Presidential election 2012 data. Unigram features were extracted from 17,000 tweets (training dataset) and were fed to the NB classifier for training. Once the classifier was trained, it was evaluated with a 59% prediction rate. Mahmood et al. (2013) proposed an election prediction method that forecasted Pakistan General Election 2013 by assessing the CHAID decision tree. In doing so, the classifier performed with a 90% prediction rate. Razzaq, Qamar & Bilal (2014) presented a machine learning algorithm that predicted positive and negative sentiments with 70% accuracy. Thus, this method needed to be more consistent due to a biased data set. Ibrahim et al. (2015) proposed a statistical prediction method enthralled on Indonesian Presidential elections 2014. The method performed with 0.61 mean absolute error (MAE). There were several limitations to this method. Firstly, a dataset of all Indonesian voters across all Indonesian provinces should have been considered. Secondly, sentiment analysis (SA) cannot be performed when no keyword is present in candidate-related tweets. In 2015, Jose & Chooralil (2015) proposed an election prediction method using word sense disambiguation. Although the method performed with a 78.6% accuracy rate without the training phase, it was limited to negation handling and manual labeling.
In Tunggawan & Soelistio (2016) , the authors innovated a Bayesian election prediction system focusing 2016 US presidential election. Although the system boomed with an exceptional accuracy rate with model test data, it under-performed with a 54.8% accuracy rate when evaluated with test poll data. Similarly, Sharma & Moh (2016) presented an Indian election prediction system using the Hindi dataset. The tweets were preprocessed, and then the polarity of the resultant tweets was calculated. SVM achieved a 78% prediction rate. The system is curtailed with emoticon analysis and extensive training data. A sentiment analysis system was introduced in Cerón-Guzmán & León-Guzmán (2016) predicting Columbia presidential election 2014. It resulted in the lowest MAE of about 4%. In Singh, Sawhney & Kahlon (2017) , a sentiment analysis system was presented focusing on US presidential elections 2016. The system got trained with the Twitter processed data, and later, it was evaluated with test data, resulting in a 79% accuracy rate. A separate study ( Ceron, Curini & Iacus, 2015a ) examined the advantages of supervised aggregated sentiment analysis (SASA) on social media platforms to forecast election outcomes. Analyzing the voting intentions expressed by social media users during several elections in France, Italy, and the United States between 2011 and 2013, they compared 80 electoral forecasts generated through SASA alongside alternative data-mining and sentiment analysis approaches.
Era 2 (2018–2023)
This era is characterized as embarking of deep learning approach as it provided a major breakthrough and expedited state of the art results among its classification algorithms. It gave a new direction towards accuracy improvisation. In doing so, the research community focused on creating and developing new deep learning algorithms as compared to machine learning algorithms. Furthermore, this era also saw a novel sentiment classification proposals relying on statistical, lexicon and ontology approaches as seen in Fig. 3 .

Bilal et al. (2018) introduced a deep neural networks (DNN) election prediction model that forecasted Pakistan General Elections 2018 with an 86.1% accuracy rate. Case sensitive tweets of tweets deteriorated the performance of the method. Kristiyanti & Umam (2019) proposed a sentiment analysis method to predict the Indonesian presidential election for 2019–2024. The system utilized particle swarm optimization (PSO) and genetic algorithm (GA) algorithms with SVM to improvise accuracy to 86.2%. Salari et al. (2018) presented an election prediction system for Iran presidential election 2017. Both text and metadata analysis of the tweets were considered to evaluate the system’s performance. The system performed with a 97.3% accuracy rate without the training phase. Another outcome prediction system, based on Indian general elections, was presented by Joseph (2019) , which trained and tested the DT classifier resulting in a 97% accuracy rate. Thus, this system works well with tweets in the English language only.
Chaudhry et al. (2021) proposed an election prediction method, mainly focusing on the US election 2020. They collected the Twitter data, preprocessed them, and extracted features using TF-IDF. Features of around 60% of the training dataset were used to train the NB classifier. In contrast, the features of the rest 40% dataset were utilized to evaluate the performance, resulting in a 94.58% accuracy rate. Thus, the authenticity of the dataset (tweets) was not examined, which hurt the method’s performance. Likewise, Xia, Yue & Liu (2021) proposed a sentiment analysis-based election prediction method for the same election campaign. The authors preprocessed the tweets with string replacement and stemming techniques in this method, followed by n-gram feature extraction. Multi-layer perceptron (MLP) classified 27,840 dimension features with an accuracy of 81.53%.
An election prediction method based on a deep learning approach was introduced in Hidayatullah, Cahyaningtyas & Hakim (2021) , which forecasted the Indonesian Presidential elections in 2019. The authors trained CNN, long-short term memory (LSTM), gated recurrent unit (GRU), and bidirectional LSTM, SVM, LR, and multinomial NB, from which bidirectional LSTM dominated against the rest by achieving 84.6% prediction rate. It also implied that, in comparison, DNNs attained a better accuracy rate than traditional machine learning algorithms. Similarly, another deep learning approach was implemented to forecast US presidential elections 2020 in Singh et al. (2021) . Three machine learning algorithms (SVM, NB, and TextBlob) and one deep learning algorithm (BERT) were trained and evaluated. As a result, the BERT algorithm attained the highest prediction rate of 94%. It denoted that DNN algorithms achieved better accuracy than conventional machine learning algorithms. Ali et al. (2022) introduced another DNN election prediction method focusing mainly on Pakistan General Elections 2018. The data were labeled manually, preprocessed, and later tokenized as usual. The resultant dataset was used to train and evaluate the DNN classifier, resulting in a 92.47% accuracy rate. Thus, the dataset used in the method above needed to be higher, due to which accuracy dropped. Previously, traditional polling data was widely considered the most reliable method for forecasting electoral outcomes. However, recent developments have revealed polling data’s potential incompleteness and inaccuracy. A study was conducted to compare the accuracy of polls with sentiment analysis results obtained from Twitter tweets ( Anuta, Churchin & Luo, 2017 ). The study analyzed a new dataset of 234,697 Twitter tweets related to politics, collected using the Twitter streaming API. The tweets underwent preprocessing, removing hashtags, links, and account names and replacing emotions and symbols with their complete form. The study’s findings indicated that Twitter exhibited a 3.5% higher bias in popular votes and a 2.5% higher bias in state results compared to traditional polls. Consequently, the study concluded that predictions based on Twitter data were inferior to those found on polling data ( Anuta, Churchin & Luo, 2017 ). The researchers highlighted the limitations of previous methods. They recommended incorporating additional techniques, such as POS tagging and sense disambiguation, during preprocessing and considering contextual and linguistic features of words to enhance prediction accuracy ( Anuta, Churchin & Luo, 2017 ).
In the context of the 2016 US elections, traditional techniques like polling were deemed unreliable due to the rapid evolution of technology and the prevalence of social and digital media platforms ( Hinch, 2018 ). A study analyzed slogans used in Twitter tweets during the elections, employing a WordCloud visualization. However, the analysis results could have been more consistent with the actual election outcomes, particularly in predicting Trump’s victory in Michigan and Wisconsin. The researchers emphasized the need to consider qualitative aspects when making electoral predictions, as the approaches employed in the study failed to capture the dynamics accurately.
The relationship between candidates’ social network size and their chances of winning elections was examined in a study that utilized data from Facebook and Twitter ( Cameron, Barrett & Stewardson, 2016 ). The study employed regression analysis and proposed three models, with the number of votes as the dependent variable and the number of Facebook connections and other factors as independent variables. The results indicated a significant correlation between the size of the social network and the likelihood of winning. However, the effect size was small, suggesting that social media data is predictive only in elections with close competition.
A study used social network techniques, such as volumetric analysis and sentiment analysis, to infer electoral results for Pakistan, India, and Malaysia ( Jaidka et al., 2019 ). The study collected approximately 3.4 million tweets using the Twitter streaming API and separated English tweets using a natural language toolkit. Volumetric analysis, measuring the volume of tweets for each party; sentiment analysis assessing positive and negative tweets; and social network analysis determining the centrality score of each party were employed. The study found that Twitter data was ineffective for making election predictions in Malaysia but proved effective and efficient for Pakistan and India. Incorporating multiple techniques, the proposed model was also effective for candidates and parties with fewer votes.
A study conducted in 2016 proposed a predictive model for forecasting the outcome of the US presidential elections based on an NB approach utilizing Twitter data ( Tunggawan & Soelistio, 2016 ). The researchers collected tweets from December to February, covering three months. The collected data underwent simple pre-processing techniques to prepare it for sentiment analysis. The resulting model achieved an impressive accuracy of 95.8% in sentiment prediction. A 10-fold cross-validation technique was employed to assess the model’s robustness. The F1 Score was used to evaluate the model’s accuracy in predicting positive sentiments, while F1 represented the model’s accuracy in classifying negative sentiments. The model’s accuracy in predicting negative sentiments ( Tunggawan & Soelistio, 2016 ). The authors of Heredia, Prusa & Khoshgoftaar (2018) introduced their sentiment analysis model, which classified the data with an accuracy of 98.5%. However, when the model’s predictions were compared with actual polling data, the results indicated an accuracy of 54.8%.
The statistical analysis of the included research papers revealed interesting insights regarding the distribution of publications across conferences and journals as shown in Fig. 4 . The data indicated that a substantial portion of the research publications were disseminated through conferences, accounting for 64% of the total publications. On the other hand, research papers published in reputable journals constituted 9% of the overall distribution as can be seen in Fig. 4a . This finding highlights the significance of conferences as platforms for rapid knowledge sharing and the enduring impact of journals in disseminating scholarly research.

The analysis further examined the distribution of research publications across different approaches. It was observed that a diverse range of approaches were employed across the reviewed papers. As seen in Fig. 4b , the data indicated that machine learning approach constituted the highest proportion accounting for 90% of the publications, followed by deep learning approach with 20%. This distribution showcases the varied methodologies utilized by researchers within the field and the prominence of certain approaches in contributing to the existing body of knowledge. To determine the years in which the authors exhibited a greater influence through their publications, an examination of publication trends from 2010 till 2022 was conducted and presented in Fig. 5 .

The analysis revealed that the years 2015 and 2022 had the most publications in this area. Articles written in the year 2023 are not included as the numbers might change by the end of the year. This shows that trend is increasing for this domain. Moreover, the paper analyzed the distribution of various categories of approaches in era 1 and era 2, representing different time frames of papers published on the topic. The aim was to investigate the evolution and trends of research methodologies and approaches used in the field over time. Fig. 3 presents the distribution of approaches across era 1 and era 2.
The analysis depicted that era 1 was dominated with machine learning algorithms but the shift started changing from era 2 to deep learning approach. Overall, the distribution of approaches in the field has undergone changes between era 1 and era 2, indicating an evolving research landscape. The shift towards deep learning and lexicon approaches suggests a diversification of research methodologies and a broadening of research interests in the field over time. These findings highlight the importance of understanding the temporal dynamics in research approaches and methodologies within the topic, providing valuable insights into the progression and development of the field.
Furthermore, the analysis identified the most relevant and highly cited journals in this domain as shown in Table 1 . Through a thorough examination of the citations within the reviewed papers, it was found that out of 42 journals, 15 contained articles with citations above a hundred. It was further seen that Journal of Social Science and Computer Review emerged as the most relevant and cited journal, followed by the journal, First Monday. These journals have consistently published influential research within the domain, indicating their significance as reputable outlets for disseminating scholarly work
Similarly, the analysis identified the most relevant and highly cited conferences in this domain as presented in Table 2 . The data showed that most papers were submitted to conferences on the web and social media, artificial intelligence, and on conferences on big data. The meta-analysis in this paper further helped in compilation of ten most highly cited articles, serving as a means to identify publications of significant research interest in Table 3 .
The paper has drawn comparisons between the findings of this research and the most relevant works in academia within the field. These comparisons aimed to situate the current study within the existing literature and highlight its contributions. The results align with previous studies that emphasize the importance of conferences and journals in disseminating research findings. Additionally, the prevalence of specific approaches identified in this research aligns with prior works that have identified and discussed these approaches in the literature.
This study holds several implications from theoretical, managerial, and practical standpoints. Theoretical implications include further validating and expanding existing theories and frameworks within the field, particularly in relation to the distribution of research publications and the prevalence of different approaches. The findings of this study contribute to the overall understanding of the research landscape and can serve as a basis for future theoretical developments and investigations.
From a managerial perspective, the results offer insights into the most influential years and the distribution of research approaches. This knowledge can assist managers and decision-makers in understanding the trends and dynamics of the field, enabling them to make informed decisions regarding resource allocation, collaboration opportunities, and strategic planning.
Practically, this research provides valuable guidance for researchers and scholars in terms of selecting appropriate publication outlets and identifying the prevailing approaches in the field. The identification of the most relevant and cited journals and conferences can aid researchers in targeting their work for maximum impact and visibility. Furthermore, knowledge of the most cited papers within the domain helps researchers stay abreast of seminal works and establish connections with influential researchers.
This study provides a detailed analysis of existing sentiment classification techniques in chronological order and categorizes them into statistical, lexicon, oncology, supervised, unsupervised, and deep learning approaches. It can be concluded that deep learning approach produced promising results. Despite that, deep learning constitutes new challenges such as high computational requirements and large dataset for training its models. The review paper further addresses the existing gap in the literature on election prediction using sentiment analysis of Twitter data. It contributes to the field by thoroughly analyzing existing studies, evaluating the effectiveness of sentiment analysis as a predictive tool, identifying challenges associated with this approach, and discussing the implications and future directions for research. By consolidating the findings, highlighting limitations, and suggesting potential advancements, this review is a valuable resource for researchers, practitioners, and policymakers interested in utilizing sentiment analysis to predict election outcomes and understand public opinion.
It has been analyzed that while there may be observed correlations between specific Twitter trends or sentiment patterns and election outcomes, it does not necessarily imply that these correlations indicate a causal relationship or direct influence on the election results. Merely correlating Twitter data and election results does not mean that the sentiment expressed on Twitter is causing the election outcome. Other factors, including traditional polling data, campaign strategies, socioeconomic factors, and voter behavior, may play more significant roles in determining the election outcome. Integrating multiple data sources and carefully considering other relevant factors to address this limitation is crucial. By doing so, researchers can mitigate this limitation and achieve a more accurate and comprehensive understanding of the dynamics underlying elections.
Moving forward, there are several areas where sentiment analysis for election prediction can be further scrutinized to enhance the efficiency and accuracy of classification algorithms. Incorporating additional data sources such as news articles, television transcripts, and survey data can provide a more comprehensive view of public opinion and enable the development of robust models that mitigate bias within extensive training data. Furthermore, improving sentiment analysis models to encompass diverse source data and exploring various aspects of the text, including sarcasm, subjectivity, and emotions, can contribute to predicting sentiment with higher precision.
Acknowledgments
We would like to extend our gratitude to Sheikh Bilal Ahmed for his assistance. We are grateful to all the anonymous reviewers for their useful comments.
Funding Statement
The authors received no funding for this work.
Additional Information and Declarations
The authors declare there are no competing interests.
Quratulain Alvi conceived and designed the experiments, performed the experiments, analyzed the data, prepared figures and/or tables, authored or reviewed drafts of the article, and approved the final draft.
Syed Farooq Ali conceived and designed the experiments, analyzed the data, authored or reviewed drafts of the article, and approved the final draft.
Sheikh Bilal Ahmed conceived and designed the experiments, performed the experiments, analyzed the data, prepared figures and/or tables, authored or reviewed drafts of the article, and approved the final draft.
Nadeem Ahmad Khan analyzed the data, prepared figures and/or tables, and approved the final draft.
Mazhar Javed conceived and designed the experiments, authored or reviewed drafts of the article, review, and approved the final draft.
Haitham Nobanee performed the experiments, authored or reviewed drafts of the article, review, and approved the final draft.
Beyond the Ballot: Analysis and Implications of the South Korean General Election in 2024
By j. james kim, in korean peninsula.
- April 19, 2024

The South Korean parliamentary election was everything it was hyped up to be, except for the result. With the conservative ruling party adding just five seats, the People Power Party (PPP) fell short of their desired 110+ seats, which would have been a face-saving loss for the leadership. By securing just 90 single-member district seats and 18 semi-proportional representation seats, the ruling party barely prevented the opposition front from achieving a veto-proof supermajority. For this reason, the result was interpreted as a disappointing one for the ruling party. However, one bright spot in this election was the high turnout, which was aided by a very competitive race and the entry of a new third party led by former Justice Minister Cho Kuk. Although the result portends a difficult road ahead for the president and the conservatives, the opposition parties’ ability to constrain the administration will depend on how well they can work together in the coming months.
What Happened?
Voter participation was high, with early turnout at 31.3 percent and total turnout at 67 percent, which was 0.8 percentage points higher than the election in 2020 ( Figure 1 ). Initial exit poll results projected a landslide victory for the Democratic Party (DP), which would have allowed them to achieve a veto-proof majority (200 seats), but this result never materialized. What this suggests is that the early votes, which were not reflected in the exit poll, are likely to have favored the conservatives more so than the progressives, contrary to mainstream media analysis.
In the end, however, the result was as predicted . The ruling party gained a few seats but not enough to tip the balance of the legislative process in their favor ( Figure 2 and Figure 3 ).
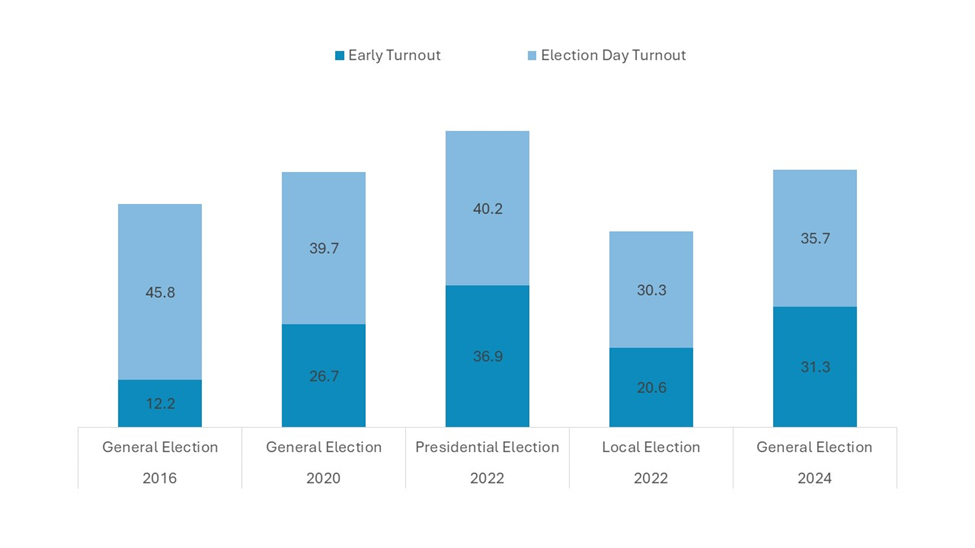
Figure 1. Voter Turnout. (Source: National Election Commission of the Republic of Korea [NEC])
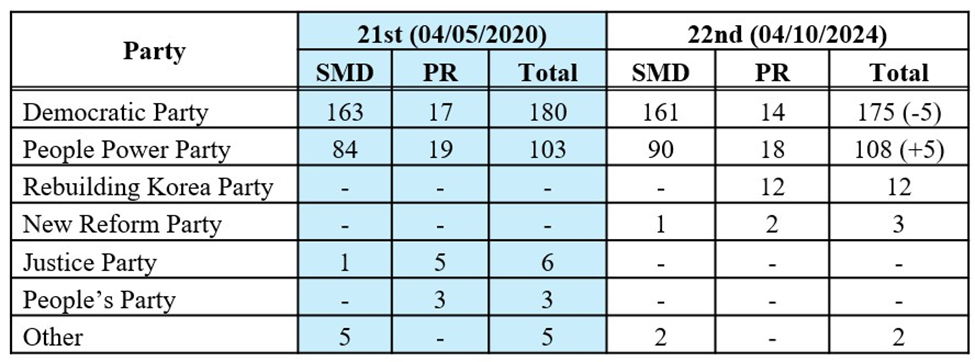
Figure 2. Results of the 21st and 22nd General Election. (Source: NEC)
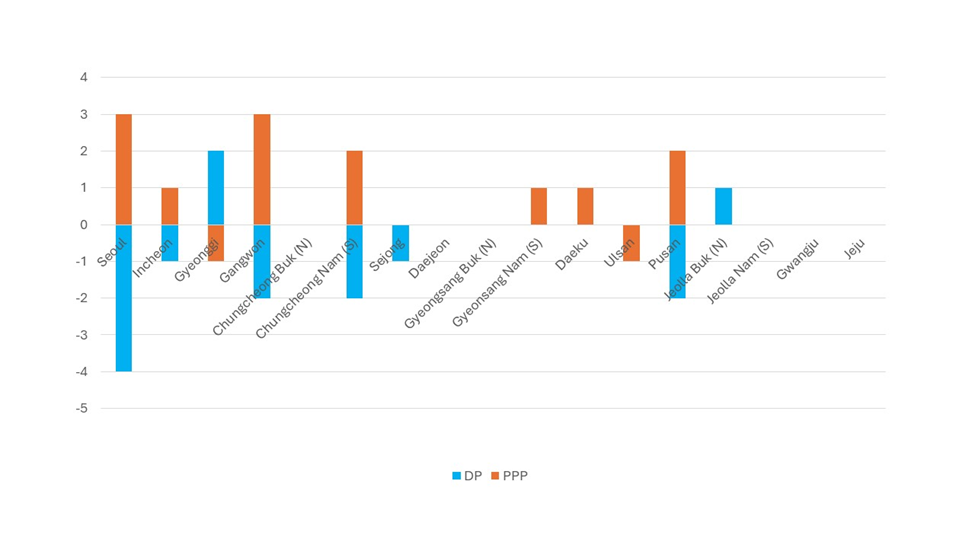
Figure 3. Number of Seats Gained and Lost in the 22nd General Election by Party and Region. (Source: NEC)
Twenty-four of the 254 single-member district races were nailbiters, with a margin of victory being less than three percentage points. Although the outcome was not a complete loss for the PPP, the conservatives’ inability to prevent the opposition coalition from attaining a filibuster-proof supermajority (i.e., greater than 180 seats) was interpreted as a failure. At the end of the day, the interim PPP leader, Han Dong-hoon, had to admit defeat and resign from his post, as did most of the key personnel in the presidential office except for the national security team.
One of the newly formed opposition parties, the National Innovation or Rebuilding Korea Party (RKP), promptly moved to follow through on their campaign promise by demanding the investigation of the First Lady in a press conference staged in front of the Supreme Prosecutor’s Office building the day after the election.
Why Did It Happen?
Established wisdom in election studies suggests that voter participation depends on three factors: 1) the likelihood of an individual vote being pivotal; 2) stakes in the election outcome; and 3) costs of voting. 1 Aaron Edlin, Andrew Gelman and Noah Kaplan, “Voting as a Rational Choice: Why and How People Vote to Improve the Well-Being of Others,” Rationality and Society 19, no. 3 (2007): 292-314. The high turnout appeared to be the result of these three conditions in this election.
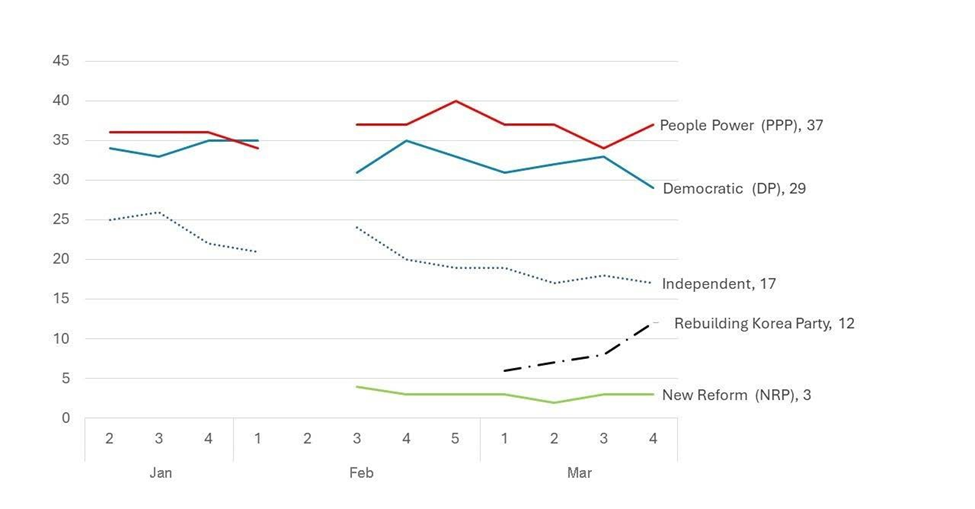
Figure 4. Party Support. (Unit: Percent; source: NEC)
First, the polls leading up to the election showed neither of the two major parties having a clear advantage ( Figure 4 ). Although the conservatives appeared to be slightly ahead, the marginal difference was relatively small, and a significant number of independent or undecided voters meant that the election was very difficult to predict. In short, the high uncertainty of outcome translated into a higher probability that an individual vote would play a more decisive role in the result.
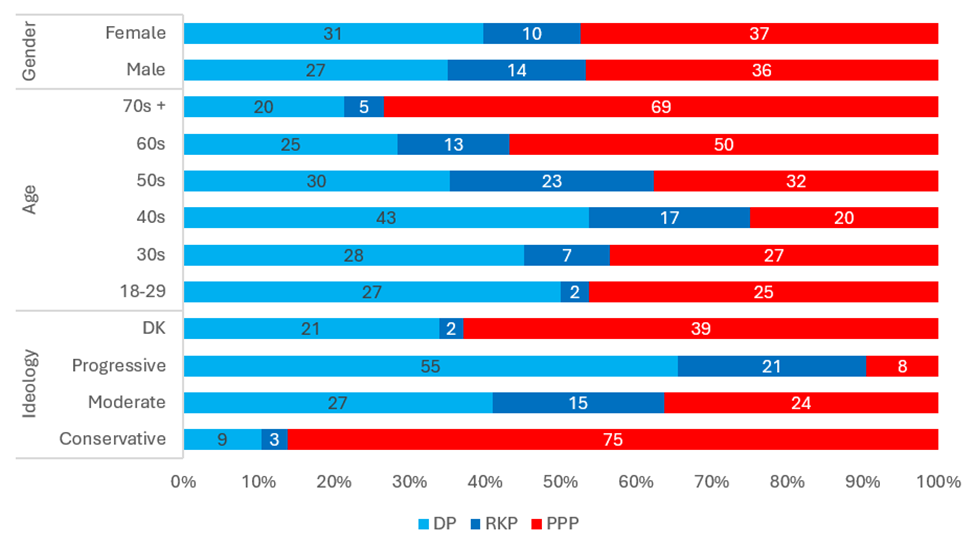
Figure 5. Demographic Breakdown of Party Support, March 26-28, 2024. (Unit: Percent; source: Gallup Korea)
Higher turnout was also aided by the introduction of new parties, such as the RKP, which was able to energize undecided voters. In fact, when we compare the characteristics of the support for the RKP, we can see disproportionate support among individuals in their 40s (17 percent) and 50s (23 percent) and among those who self-identified as progressive (21 percent) or moderate (15 percent) ( Figure 5 ). Incidentally, these are also the groups that tended to support the DP more so than the PPP. Given the higher early voting turnout in Jeolla Province and the result, which seems to suggest that many moderate votes are likely to have gone toward the RKP (see below), the introduction of third parties appears to have energized the undecided voters who were not entirely satisfied with the establishment choices.
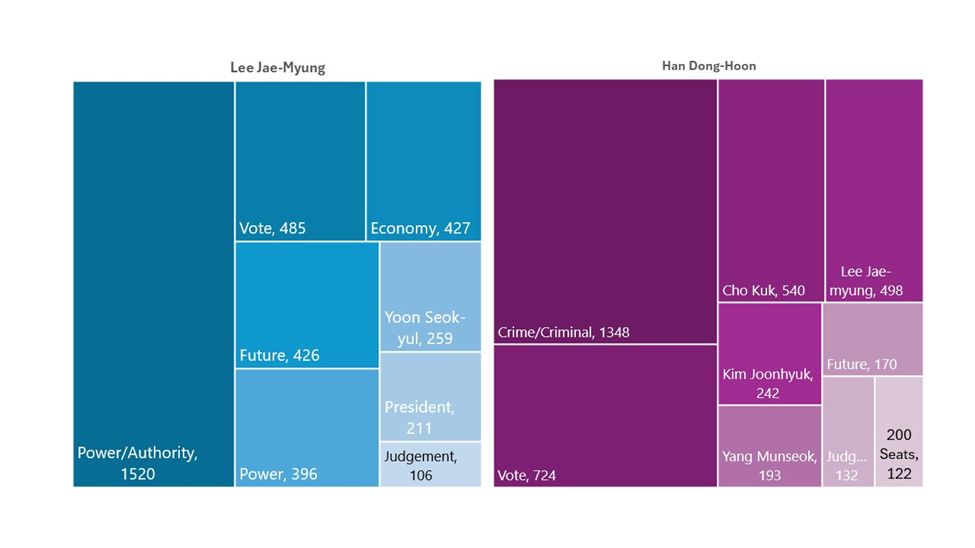
Figure 6. Keywords from Stump Speech, March 28-April 8, 2024. (Unit: Frequency; source: Donga Ilbo)
With respect to the stakes, the leaders of the two major parties sought to frame this election around the issue of passing judgment on each other’s party leadership ( Figure 6 ). Although the PPP presented concrete policy platforms that hinged on measures such as elimination of capital gains tax, valuing up equities in the stock market, and relocating the parliament from Yeouido to Sejong City, among others, none of these substantive policy issues really became the focal point of this election. Instead, both parties resorted to negative campaigning. As the content analysis of the stump speech by the leaders of the two major parties shows ( Figure 6 ), the progressives focused on the president’s leadership style and the economy. The conservatives focused on individuals in the Democratic Party marred by different types of scandals. The events leading up to the election appear to have reinforced both side’s arguments, but this framing did not move the needle in either party’s favor.
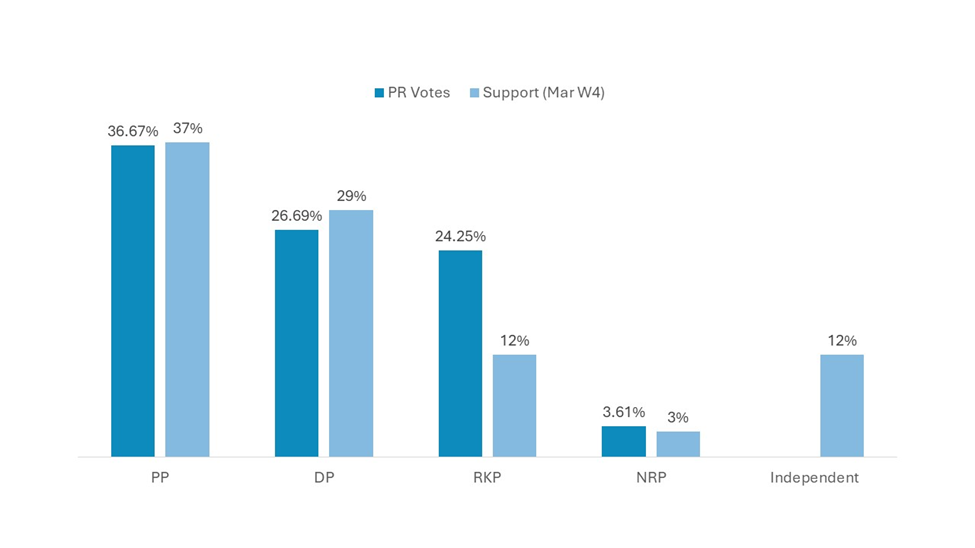
Figure 7. Comparison of Party Support and PR Votes. (Source: NEC and Gallup Korea)
One especially striking result from this election was the strong correlation between the overall support for the major parties and the share of votes that each party received. If we stack the independent/undecided support with the support for RKP at the end of March, the partisan support for each party does a remarkably good job of predicting the PR vote for each party ( Figure 7 ). The election dynamic at the district level is likely to differ depending on the candidate and the distribution of voter characteristics. Nonetheless, the results suggest that the framing in this election did little to move the needle in either direction, and the third party may have absorbed a sizable number of undecided votes.
Basically, this election is interpreted as a referendum on the current administration. Depending on how well the opposition parties can work together to keep President Yoon’s agenda in check, the administration’s ability to push forward with its reform agenda is likely to be hampered.
This does not necessarily mean President Yoon will be a “ dead duck ” for the remainder of his term. President Yoon has had some success passing important legislation through the National Assembly over the past year when he had far fewer ruling party votes on the chamber floor. Moreover, it is yet unclear how close the cooperation between DP and RKP will be in the days ahead. Although the two parties have agreed to coordinate their effort in the next Assembly, there were moments when the DP leadership became weary of the RKP and its leader, former Minister of Justice Cho Kuk. Finally, there is the question of legal woes hanging over the heads of both leaders of the DP and RKP, Mr. Lee Jae-myung and Mr. Cho. Both men are being tried for fraud and corruption. The opposition dynamic can change depending on the outcome of these cases.
Whoever may be in charge, President Yoon will have to figure out a way to work with the opposition if he wishes to pass more of his policy agenda. If not, there is a danger that he will not be able to achieve much in the next three years. Some observers argue that he may double down and push forward with his agenda unilaterally using vetoes and presidential orders. In this case, Yoon is likely to meet strong resistance from the opposition and Korean interbranch relations are likely to become more contentious.
That said, President Yoon’s foreign policy orientation is not likely to change much, given that the executive retains the power to set the agenda on most of these matters in presidential systems. However, the opposition can constrain the president’s foreign policy agenda through legislative intervention via ratification or auxiliary implementing legislation. The administration’s credibility and bargaining leverage on the international stage could be weakened if it consistently fails to deliver on the promises it makes with its counterpart due to domestic political constraints.
Geopolitical and geoeconomic trends may also impact domestic political dynamics. With deepening US-China competition, the upcoming US election and increased coordination between North Korea and Russia, national security and foreign policy challenges could become especially acute, if not significantly problematic, for South Korea until the next presidential election three years from now. At some point, however, partisan differences are more likely to be set aside when opposing political factions realize they are faced with an overwhelming national security or foreign policy challenge. Hopefully the different parties in Korean politics will come to this realization before it’s too late.
- 1 Aaron Edlin, Andrew Gelman and Noah Kaplan, “Voting as a Rational Choice: Why and How People Vote to Improve the Well-Being of Others,” Rationality and Society 19, no. 3 (2007): 292-314.
Recent & Related
About Stimson
Transparency.
- 202.223.5956
- 1211 Connecticut Ave NW, 8th Floor, Washington, DC 20036
- Fax: 202.238.9604
- 202.478.3437
- Caiti Goodman
- Communications Dept.
- News & Announcements
Copyright The Henry L. Stimson Center
Privacy Policy
Subscription Options
Research areas trade & technology security & strategy human security & governance climate & natural resources pivotal places.
- Asia & the Indo-Pacific
- Middle East & North Africa
Publications & Project Lists South Asia Voices Publication Highlights Global Governance Innovation Network Updates Mekong Dam Monitor: Weekly Alerts and Advisories Middle East Voices Updates 38 North: News and Analysis on North Korea
- All News & Analysis (Approx Weekly)
- 38 North Today (Frequently)
- Only Breaking News (Occasional)
Numbers, Facts and Trends Shaping Your World
Read our research on:
Full Topic List
Regions & Countries
- Publications
- Our Methods
- Short Reads
- Tools & Resources
Read Our Research On:
Political Typology 2017
Survey conducted June 8-18 and June 27-July 9, 2017
The Generation Gap in American Politics
Generational differences have long been a factor in U.S. politics. These divisions are now as wide as they have been in decades, with the potential to shape politics well into the future.
Political Typology Reveals Deep Fissures on the Right and Left
The partisan divide on political values grows even wider.
Gaps between Republicans and Democrats over racial discrimination, immigration and poverty assistance have widened considerably in recent years.
Partisan Shifts in Views of the Nation, but Overall Opinions Remain Negative
Republicans have become far more upbeat about the country and its future since before Donald Trump’s election victory. By contrast, Democrats have become much less positive.
Since Trump’s Election, Increased Attention to Politics – Especially Among Women
Following an election that had one of the largest gender gaps in history, women are more likely than men to say they are paying increased attention to politics.
Support for Same-Sex Marriage Grows, Even Among Groups That Had Been Skeptical
Two years after the Supreme Court decision that required states to recognize same-sex marriages nationwide, support for allowing gays and lesbians to marry legally is at its highest point in over 20 years of Pew Research Center polling on the issue.
Public Has Criticisms of Both Parties, but Democrats Lead on Empathy for Middle Class
Both political parties’ favorability ratings are more negative than positive and fewer than half say either party has high ethical standards.
Download Dataset
1615 L St. NW, Suite 800 Washington, DC 20036 USA (+1) 202-419-4300 | Main (+1) 202-857-8562 | Fax (+1) 202-419-4372 | Media Inquiries
Research Topics
- Age & Generations
- Coronavirus (COVID-19)
- Economy & Work
- Family & Relationships
- Gender & LGBTQ
- Immigration & Migration
- International Affairs
- Internet & Technology
- Methodological Research
- News Habits & Media
- Non-U.S. Governments
- Other Topics
- Politics & Policy
- Race & Ethnicity
- Email Newsletters
ABOUT PEW RESEARCH CENTER Pew Research Center is a nonpartisan fact tank that informs the public about the issues, attitudes and trends shaping the world. It conducts public opinion polling, demographic research, media content analysis and other empirical social science research. Pew Research Center does not take policy positions. It is a subsidiary of The Pew Charitable Trusts .
Copyright 2024 Pew Research Center
Terms & Conditions
Privacy Policy
Cookie Settings
Reprints, Permissions & Use Policy
IEC ready to print ballot papers for 2024 elections

With the finalisation of the list of candidates contesting seats in the 2024 National and Provincial Elections (NPE2024), the Electoral Commission (IEC) can now go ahead with the printing of ballot papers for the elections.
"The 27.79 million registered voters will receive three ballot papers to elect candidates to represent them in the National Assembly and Provincial Legislatures,” IEC Chief Electoral Officer (CEO) Sy Mamabolo said on Tuesday in Centurion.
Addressing a media briefing, Mamabolo said the use of the three ballots follows the amendment of the Electoral Act, which was signed into law in April 2023.
“This amendment revised the electoral system to allow independent candidates to contest in the regional (province-to-national) tier of the National Assembly and the Provincial Legislatures. Although the phenomenon of three ballots will be familiar to voters in various local municipalities, it will be new to voters in metropolitan areas and for the first time in general elections for national and provinces.
“There are a total of 400 contested seats in the National Assembly. The proportional representation compensatory 200 seats will be contested by political parties only and there is a dedicated ballot paper for this tier of the National Assembly.
“The remaining regional or province-to-national 200 seats will be contested by independent candidates and political parties. This tier of the National Assembly will also have a dedicated ballot paper,” he said.
This means that National Assembly elections will be based on two ballot papers – a national ballot and the newly introduced regional or province-to-national ballot.
“Therefore, in respect of the elections of the National Assembly, voters may elect a preferred party on the national ballot and elect another preferred party or independent on the regional ballot. However, in respect of provincial elections, voters will elect a preferred party or independent candidate on a single provincial ballot,” the CEO said.
Mamabolo explained how the three ballot papers would work.
WATCH |
The National Ballot will consist of a list of political parties vying for seats for 200 seats in the National Assembly.
“This ballot will be used to vote for political parties. There are currently 52 parties who will be on this ballot and the configuration will be a dual column. The Regional or Province-to-National Ballots will have political parties and independent candidates contesting for the seats reserved for each province in the National Assembly.
“Voters will use this ballot to elect a political party or an independent candidate to represent them in the National Assembly. The number of contestants range from 30 to 44 on regional ballots. The configuration of this ballot is single column,” he said.
The Provincial Ballots are unique to each province and include parties and independent candidates competing for seats in each respective provincial legislature.
“This ballot will allow voters to choose either a political party or an independent candidate to represent them in provincial legislatures. The number of contestants range from 24 to 45 on the provincial legislatures ballots,” the CEO said.
The Commission has decided that the design of the ballot papers will be underpinned by the following identifiers:
- Full registered name of the party.
- The photograph of the registered party leader.
- Registered abbreviated name of the party.
- The registered emblem or symbol of the party.
In respect of independent candidates, the ballot papers will have:
- The name of the independent;
- The photograph bearing the face of the independent and
- The word “INDEPENDENT.”
The Commission has urged voters to carefully review and mark each of these three ballot papers before depositing them into the ballot box.
“Our appeal to voters is to remember that they can only put one mark on each ballot, more than one mark will result in a spoiled ballot and will not [count]. The Universal Ballot Template (UBT), whose dimensions are benchmarked against the longest ballot paper, is in production and will be available in all voting stations.
“The UBT can be used by blind and partially sighted people, low-vision users, people who are dyslexic, and people with motor and neuron conditions which do not allow for a steady hand,” Mamabolo said.
Voters have been reminded that they may only vote at a voting station at which they are registered.
“Voters who will inevitably be away from their voting districts on Election Day, 29 May 2024, may give a Section 24A notice of their intention to vote at another identified voting station by no later than 17 May 2024,” the CEO said. – SAnews.gov.za
- Election 2024
- Entertainment
- Newsletters
- Photography
- Personal Finance
- AP Investigations
- AP Buyline Personal Finance
- AP Buyline Shopping
- Press Releases
- Israel-Hamas War
- Russia-Ukraine War
- Global elections
- Asia Pacific
- Latin America
- Middle East
- Election Results
- Delegate Tracker
- AP & Elections
- Auto Racing
- 2024 Paris Olympic Games
- Movie reviews
- Book reviews
- Personal finance
- Financial Markets
- Business Highlights
- Financial wellness
- Artificial Intelligence
- Social Media
Only 1 in 3 US adults think Trump acted illegally in New York hush money case, AP-NORC poll shows
The first criminal trial facing former President Donald Trump is also the one in which Americans are least convinced he committed a crime, a new AP-NORC Center for Public Affairs Research poll finds.
FILE - Former President Donald Trump sits in Manhattan criminal court with his legal team in New York, April 15, 2024. (Jabin Botsford/Pool Photo via AP)
- Copy Link copied
WASHINGTON (AP) — The first criminal trial facing former President Donald Trump is also the one in which Americans are least convinced he committed a crime, a new AP-NORC Center for Public Affairs Research poll finds.
Only about one-third of U.S. adults say Trump did something illegal in the hush money case for which jury selection began Monday, while close to half think he did something illegal in the other three criminal cases pending against him. And they’re fairly skeptical that Trump is getting a fair shake from the prosecutors in the case — or that the judge and jurors can be impartial in cases involving him.
What to know about Trump’s hush money trial:
- Trump will be first ex-president on criminal trial. Here’s what to know about the hush money case.
- A jury of his peers: A look at how jury selection will work in Donald Trump’s first criminal trial .
- Donald Trump is facing four criminal indictments, and a civil lawsuit. You can track all of the cases here.
Still, half of Americans would consider Trump unfit to serve as president if he is convicted of falsifying business documents to cover up hush money payments to a woman who said he had a sexual encounter with her.
While a New York jury will decide whether to convict Trump of felony charges, public opinion of the trial proceedings could hurt him politically. The poll suggests a conviction could hurt Trump’s campaign. Trump enters a rematch with President Joe Biden as the first presumptive nominee of a major party — and the first former president — to be under indictment. A verdict is expected in roughly six weeks, well before the Republican National Convention, at which he will accept the GOP nomination.
Trump has made the prosecutions against him a centerpiece of his campaign and argued without evidence that Biden, a Democrat, engineered the cases. That argument helped him consolidate GOP support during the Republican primary, but a conviction might influence how many Americans — including independent voters and people long skeptical of Trump — perceive his candidacy.
“Any conviction should disqualify him,” said Callum Schlumpf, a 31-year-old engineering student and political independent from Clifton, Texas. “It sets a bad example to the rest of the world. I think it misrepresents us, as a country, as to what we believe is important and virtuous.”
Yet, a cloud of doubt hangs over all the proceedings. Only about 3 in 10 Americans feel that any of the prosecutors who have brought charges against Trump are treating the former president fairly. And only about 2 in 10 Americans are extremely or very confident that the judges and jurors in the cases against him can be fair and impartial.
“It’s very obvious political persecution,” said Christopher Ruff, a 46-year-old political independent and museum curator from Sanford, North Carolina. “I’m no fan of Trump in any way, shape or form. Didn’t vote for him, never will. But it’s obviously all political.”
Former President Donald Trump sits in Manhattan criminal court with his legal team in New York, April 15, 2024. (Jabin Botsford/Pool Photo via AP)
Consistent with AP-NORC polls conducted over the past year, the new poll found that about half of Americans say Trump did something illegal regarding the classified documents found at his Florida home , and a similar share think he did something illegal regarding his alleged attempt to interfere in Georgia’s vote count in the 2020 presidential election . The poll also found that nearly half of Americans believe he did something illegal related to his effort to overturn the results of the 2020 election .
Prosecutors in New York will argue that Trump falsified his company’s internal records to hide the true nature of a payment to his former lawyer Michael Cohen. Cohen alleges he was directed by Trump to pay adult film actor Stormy Daniels $130,000 one month before the 2016 election to silence her claims about an extramarital sexual encounter with Trump.
Trump has pleaded not guilty to the 34-count indictment and denied any sexual encounter with Daniels.
The poll found that 35% of Americans say Trump has done something illegal with regard to the hush money allegations. Slightly fewer, about 3 in 10, think he did something unethical without breaking the law. Fourteen percent think he did nothing wrong at all. Those numbers haven’t shifted meaningfully in the year since he was first charged in the case.
Republicans are much less likely than Democrats and independents to say Trump committed a crime in the hush money case.
“He’s done nothing wrong,” said Louie Tsonos, a 43-year-old sales representative and Republican from Carleton, Michigan, a suburb of Detroit. “Because Trump has a lot of money and fame, they want to destroy his reputation. Or at least they are trying to.”
Fewer than one in 10 Republicans say Trump did something illegal in the case, while 4 in 10 Republicans think he did something unethical but did not break the law. About 3 in 10 Republicans, like Tsonos, say he did nothing wrong.
By contrast, about 6 in 10 Democrats and roughly 3 in 10 independents believe he did something illegal.
Monica Brown, a Democrat from Knoxville, Tennessee, thinks Trump did something unethical, though not illegal, in the New York criminal case under way. But a conviction would ruin his credibility to serve as president, she said.
“I don’t believe any president – whether it’s Donald Trump or anyone else – should have a criminal conviction on his record,” said Brown, a 60-year-old veterinary technician and social worker. “Even if it’s related to something like hush money, what respect are they going to get from anyone? Citizens of the country or world leaders, they aren’t going to respect you.”
Nearly 6 in 10 Republicans say they would consider Trump fit to be president even if he were to be convicted of falsifying business documents in the hush money case. About 8 in 10 Democrats say Trump would not be fit to serve in the event of a conviction. About half of independents think he would be unfit to serve, with 22% saying he would be fit and 30% saying they didn’t know enough to say.
“I don’t think any of that stuff has any relevance to his ability to lead this country,” said Jennifer Solich, a Republican from York, Pennsylvania, and retired nuclear engineer who believes Trump would be fit to serve if convicted in the New York case. “There may be some unethical aspects to it. I just think it’s more trivial than what we’re facing as a nation.”
Beaumont reported from Des Moines, Iowa.
The poll of 1,204 adults was conducted April 4-8, 2024, using a sample drawn from NORC’s probability-based AmeriSpeak Panel, which is designed to be representative of the U.S. population. The margin of sampling error for all respondents is plus or minus 3.9 percentage points.
IMAGES
COMMENTS
Erosion of trust in the honesty of elections and concomitant weakening of democratic institutions and practices are growing concerns in modern global politics. This paper contributes to the discussion by detecting and examining a rare electoral irregularity observed in 2019 general election in India - the incumbent party won ...
1.1 Previous Work. There is a large literature that suggests that preelection polls affect election outcomes. Based on an experiment, Farjam (Citation 2021) discerned a substantial bandwagon effect, estimating that "after participants saw pre-election polls, majority options on average received an additional 7% of the votes." (Farjam also offers an extensive bibliography of papers about ...
Political opposition sought to reframe the campaign and elections in general as a choice between granting and denying legitimacy to the process. Footnote 40 The impact of peaceful protests on election results and their initial acceptance was minimal. Their legacy was however hampered by tension that escalated in the post-electoral period (July ...
The primary reported reason for not voting in 2022 was not knowing enough about the choices (12.1 percent of non-voters), followed by not being interested (11.7 percent). and being too busy (9.8 percent). Voter confidence. Measured across all voters, confidence that votes were counted as intended remained similar to past years.
In this special issue, there are four examples of longitudinal research on political communication on social media in four different national contexts. The first study by Bruns, Angus, and Graham is a study of political party activities on Twitter focusing on the general election of 2019 while comparing with 2016 and 2013 elections.
New research on political elections from Harvard Business School faculty on issues including marketing lessons from Trump's campaign, how to improve voter turnout, and voter registration costs and disenfranchisement. ... This paper studies data generated prior to the 2015 Argentine presidential ballotage, when a government propaganda campaign ...
Besides, this paper highlights the research challenges associated with predicting election results and open issues related to sentiment analysis. Further, this paper also suggests some future directions in respective election prediction using social media content. ... Bermingham and Smeaton analyzed Irish general election 2011 and explained ...
November 3, 2020: General Election Day. General election day for electors for the President and Vice President is set by law (3 U.S.C. §1) as the Tuesday after the first Monday in November in presidential election years. Voters cast a single vote for a joint ticket of their preferred candidates for President and Vice President.
The research discovered that the 2019 General Election was heralded with several issues, various challenges and some level of success and that there are lessons that are learnt from the process ...
Abstract. Election campaigns attract great attention from voters, media and academics alike. The academics, however, tend to focus their research on the electoral result and on societal and long-term political factors influencing that result. The election campaign — the event of great interest, which has at least some role to play in ...
Research Papers in Economics 2017: 5. Department of Economics, Stockholm University. 1-64. Available at: ... Herman NS, et al. (2020) E-voting readiness mapping for general election implementation. Journal of Theoretical and Applied Information Technology 98(20): 3280-3290.
Abstract. This paper analyzes democracy and Nigeria's general elections of 2023 while taking into account a broader range of variables that influenced both the process and the result. Over the ...
The exit poll is more a set of interlocking surveys than a single, uniform poll. Aside from the phone and in-person components, Edison will field state-specific questionnaires at 350 of its 1,000 or so polling locations, in addition to the national questionnaire all respondents receive. The idea, Lenski said, is to be able to ask about issues ...
1 Most works considered here deal with national elections, but some of them also focus on state elect ; 2 I owe this formulation to Amit Prakash, whose comments on a previous version of this paper were ver ; 2 Election studies are here defined as scholarly work focusing on the major phases of the electoral process, i.e. the campaign, the vote, the announcement of results and subsequent ...
This paper studies the impact of Indian General Elections on the stock market performances of the firms using the election event data of 2004, 2009 and 2014 as the sample. Fixed Effect (FE) model ...
In general elections, turnout is most strongly driven by competitive campaigns and whether the election takes place in an even-numbered year, according to researchers at the University of Missouri-St.Louis. ... Other research on inactive ballots: A 2015 paper highlights ballot exhaustion in RCV elections, but only examines four elections rather ...
Before starting further, here is an introduction to some terminologies which has been used throughout the paper. Lok Sabha election or General election is the election for the lower house of the parliament in India, electoral or leader or candidate is the Prime Ministerial (PM) candidate of a political party, Mahagathbandhan (MGB) is an alliance of national and regional parties, Bhartiya Janta ...
The 2015 and 2019 general elections in Nigeria marked a turning point in the use of social media for awareness, campaigns, discourse and even outright posting of election results. In lieu of this, this study investigated the influence of social media on youth participation in Nigerian politics and its impact on the outcome of the last two ...
This analysis is based on a survey of 11,818 members of Pew Research Center's American Trends Panel conducted Nov. 12-17, 2020, shortly after the general election. It also draws on surveys conducted among 10,640 panelists from Nov. 7-16, 2018, after the midterm election that year and 4,183 panelists from Nov. 29 to Dec. 12, 2016, after the ...
This paper focuses on the 2022 general elections in Papua New Guinea, covering both electoral quality and election outcomes. Overall, the 2022 elections were very troubled. In parts of the country, serious violence and electoral fraud were major issues. In other parts of the country, polling was less fraught. However, some problems, such as the ...
already holding a portfolio of assets in the country that is subject to the election shock. IV. RESEARCH OBJECTIVES [1] To Study the effect of General Election on Indian Stock market performance through an event study of the impact of General Election 2019 on NSE NIFTY, S&P BSE SENSEX and on other Sector-wise Indices namely,
The dataset related to Pakistan general elections 2018 was gathered from Twitter, and they were labelled manually. Then the data was preprocessed with data transformation, tokenization, and stemming. ... On the other hand, research papers published in reputable journals constituted 9% of the overall distribution as can be seen in Fig. 4a. This ...
short term (10 days), medium term (20 days) & long term (30 days) in pre-elections and post- elections period.The analysis has been emphasizing to measure the volatility, average returns and impact of elections . For this analysis 5 election sessions were considered that is 1998 - 2014. To analyse the data t test, f test are used.
The South Korean parliamentary election was everything it was hyped up to be, except for the result. With the conservative ruling party adding just five seats, the People Power Party (PPP) fell short of their desired 110+ seats, which would have been a face-saving loss for the leadership. By securing just 90 single-member district seats and 18 semi-proportional representation seats, the ruling ...
Abstract. An election is a critical component of democratic governance. In the formation of an elected government, elections play a decisive role. The Election Commission of Pakistan derives its ...
About Pew Research Center Pew Research Center is a nonpartisan fact tank that informs the public about the issues, attitudes and trends shaping the world. It conducts public opinion polling, demographic research, media content analysis and other empirical social science research. Pew Research Center does not take policy positions.
A new poll from the AP-NORC Center for Public Affairs Research finds that more than half of U.S. adults think Biden's presidency has hurt the country on cost of living and immigration, while nearly half think Trump's presidency hurt the country on voting rights and election security, relations with foreign countries, abortion laws and ...
With the finalisation of the list of candidates contesting seats in the 2024 National and Provincial Elections (NPE2024), the Electoral Commission (IEC) can now go ahead with the printing of ballot papers for the elections. "The 27.79 million registered voters will receive three ballot papers to ...
Having won all the five seats in Uttarakhand in both 2014 and 2019 general elections, the BJP is seeking to retain them for a third term. The first phase the Lok Sabha elections will be held on ...
WASHINGTON (AP) — The first criminal trial facing former President Donald Trump is also the one in which Americans are least convinced he committed a crime, a new AP-NORC Center for Public Affairs Research poll finds.. Only about one-third of U.S. adults say Trump did something illegal in the hush money case for which jury selection began Monday, while close to half think he did something ...