- Texas Go Math
- Big Ideas Math
- Engageny Math
- McGraw Hill My Math
- enVision Math
- 180 Days of Math
- Math in Focus Answer Key
- Math Expressions Answer Key
- Privacy Policy

McGraw Hill My Math Grade 3 Chapter 12 Lesson 7 Answer Key Collect and Display Measurement Data
All the solutions provided in McGraw Hill My Math Grade 3 Answer Key PDF Chapter 12 Lesson 7 Collect and Display Measurement Data will give you a clear idea of the concepts.
McGraw-Hill My Math Grade 3 Answer Key Chapter 12 Lesson 7 Collect and Display Measurement Data
You can gather measurement data by finding the lengths of several objects. The data collected can be useful.
Math in My World
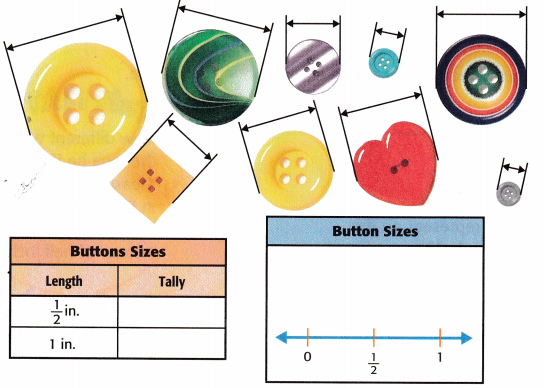
Guided Practice
Question 1. What do the Xs represent on the line plot in Example 2? Answer: The number of paper clips that are fraction of an inch in length.
Independent Practice
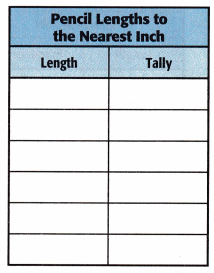
Question 3. What is the difference in length between the longest and shortest pencil? Write an equation with the letter p for the unknown. Then solve. Answer: Let us assume the difference in length between the longest and shortest pencil will be p. From the above data the length of shortest pencil is 1 inch and longest pencil is 6 inch.Therefore, the difference in length between the longest and shortest pencil will be 6-1=p=5 inches.
Question 4. What would be the total length of the pencils if they were laid end to end? Answer: The total length of pencils will be sum of the different pencil lengths. Therefore, the total length will be 1+2+3+4+4+5+6+6=31 inches.
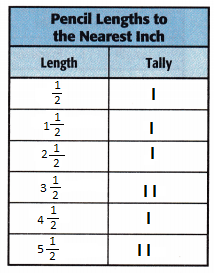
Question 6. How are the two sets of data different? How are they alike? Answer: The two sets are the similar because they both show that majority of pencils lie between 3 and 6 inches.The second line plot looks different as the two pencils lie on 3\(\frac{1}{2}\) and 4\(\frac{1}{2}\) inches while in first plot they measure 4 and 6 inches.
Problem Solving
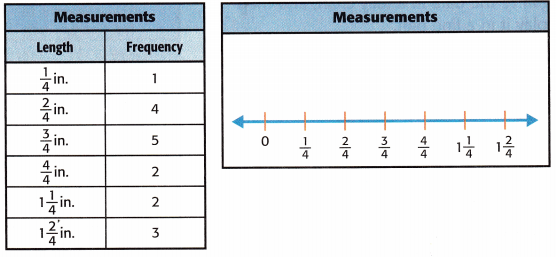
Question 8. What is the total number of items that measured 1 inch or less? Answer: From the above data,the total number of items that measured 1 inch or less will be 1+4+5+2=12 items.
Question 9. Mathematical PRACTICE Use Algebra Write an equation that shows the difference between the total items that measured 1 inch or less and the total items that measure more than 1 inch. Then find the difference. Answer: Let us assume the difference between the total items that measured 1 inch or less and the total items that measure more than 1 inch be c. The total items that measured 1 inch or less are 1+4+5+2=12 and the total items that measure more than 1 inch are 2+3=5. Therefore, c will be 12-5=7.
HOT Problems
Question 10. Mathematical PRACTICE Reason How is a ruler like the number line on the line plot in Exercise 7? Answer: The number line on the line plot resembles like the ruler.The line plot shows the fractions such as half-inch marks and one-fourth-inch marks.
Question 11. Building on the Essential Question Why does recording measurement data lend itself to a line plot display? Answer: Each line plot will have a title and the numbers parts for measuring data dispalying on it.As shown in above examples, the mark on the line plot, will be helpful in knowing the frequency/count of each data.
McGraw Hill My Math Grade 3 Chapter 12 Lesson 7 My Homework Answer Key
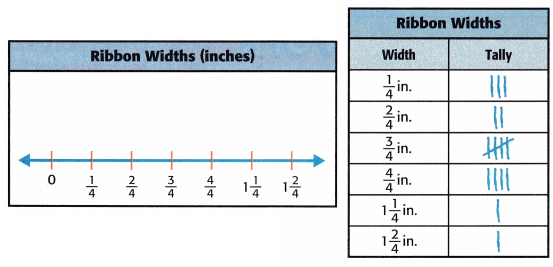
Question 1. Tell why in the line plot above, there are no Xs above \(\frac{3}{4}\) of an inch. Answer: There were no tallies in the tally chart for \(\frac{3}{4}\) inch. Therefore, there were no Xs above \(\frac{3}{4}\)inch.
Question 2. Did more of Mrs. Carnes’ students grow an inch or more or less than an inch? Explain. Answer: Mrs. Carnes’ students grew more than an inch,\(\frac{4}{4}\) inch is one inch.So, 7 of 12 students grew an inch or more.
Test Practice
Question 7. How many spools of ribbon are represented in the line plot for Exercise 3? (A) 1\(\frac{2}{4}\) spools (B) 14 spools (C) 15 spools (D) 16 spools Answer: Number of spools represented in the line plot are 3+2+5+4+1+1=16. Option D is correct.
Leave a Comment Cancel Reply
You must be logged in to post a comment.
Download 3rd chapter 12 lesson 7
* Your assessment is very important for improving the workof artificial intelligence, which forms the content of this project

If you're seeing this message, it means we're having trouble loading external resources on our website.
If you're behind a web filter, please make sure that the domains *.kastatic.org and *.kasandbox.org are unblocked.
To log in and use all the features of Khan Academy, please enable JavaScript in your browser.
Unit 1: Measurement and data
About this unit.
First, we will measure length using unit squares and rulers, compare and estimate length, and solve length word problems. Next, we will read and make picture graphs, bar graphs, and line plots. From there, we will tell time on analog clocks and count U.S. coins and dollars. After that, we will identify quadrilaterals, pentagons, hexagons, and octagons. Finally, we will break shapes into equal parts.
Units of length
- Getting a sense of meters and centimeters (Opens a modal)
- Getting a sense of inches and feet (Opens a modal)
- Units of length (cm, m) Get 3 of 4 questions to level up!
- Units of length (inch, ft) Get 3 of 4 questions to level up!
Measuring length
- Measuring lengths (cm, m) (Opens a modal)
- Measuring in inches (Opens a modal)
- Measuring lengths in different units (Opens a modal)
- Measuring lengths with different units (Opens a modal)
- Measure lengths (cm, m) Get 3 of 4 questions to level up!
- Measure lengths (inch, ft) Get 3 of 4 questions to level up!
- Measure length in different units Get 3 of 4 questions to level up!
Estimating length
- Estimating lengths (Opens a modal)
- Estimate lengths Get 3 of 4 questions to level up!
- Estimate lengths (US Customary units) Get 3 of 4 questions to level up!
Length word problems
- Length word problem example (US Customary) (Opens a modal)
- Length word problems (Opens a modal)
- Length word problem (US customary) Get 3 of 4 questions to level up!
- Length word problems Get 3 of 4 questions to level up!
Picture graphs
- Picture graphs (Opens a modal)
- Making picture graphs and line plots (Opens a modal)
- Make picture graphs Get 5 of 7 questions to level up!
- Solve problems with picture graphs Get 3 of 4 questions to level up!
- Creating a bar graph (Opens a modal)
- Reading bar graphs: bikes (Opens a modal)
- Make bar graphs Get 5 of 7 questions to level up!
- Solve problems with bar graphs Get 5 of 7 questions to level up!
- Read line plots (Opens a modal)
- Make line plots Get 5 of 7 questions to level up!
- Solve problems with line plots Get 3 of 4 questions to level up!
- Time on a number line (Opens a modal)
- Telling time (labeled clock) (Opens a modal)
- Telling time on a number line Get 5 of 7 questions to level up!
- Telling time on a clock Get 5 of 7 questions to level up!
- Counting American coins (Opens a modal)
- Counting dollars (Opens a modal)
- Identify the value of US coins and dollars Get 5 of 7 questions to level up!
- Count money (U.S.) Get 5 of 7 questions to level up!
- Money word problems (U.S.) Get 3 of 4 questions to level up!
- 888-309-8227
- 732-384-0146
New User Registration
Forgot Password

My Math 3 Volume 2 Common Core, Grade: 3 Publisher: McGraw-Hill
My math 3 volume 2 common core, title : my math 3 volume 2 common core, publisher : mcgraw-hill, isbn : 21161917, isbn-13 : 9780021161911, use the table below to find videos, mobile apps, worksheets and lessons that supplement my math 3 volume 2 common core., textbook resources.
- Call us toll-free
- FAQs – Frequently Asked Questions
- Contact Lumos Learning – Proven Study Programs by Expert Teachers
Follow us: Lumos Learning -->
- 2024 © Lumos Learning
- Privacy Policy - Terms of Service - Disclaimers
PARCC® is a registered trademark of PARCC, Inc. Lumos Learning, is not owned by or affiliated in any fashion with PARCC, Inc... Read More
PARCC® is a registered trademark of PARCC, Inc. Lumos Learning, is not owned by or affiliated in any fashion with PARCC, Inc., the Partnership for the Assessment of Readiness for College and Careers, nor any state of the Union. Neither PARCC, Inc., nor The Partnership for the Assessment of Readiness for College and Careers, nor any member state has endorsed this product. No portion of any fees or charges paid for any products or services Lumos Learning offers will be paid or inure to the benefit of PARCC, Inc., or any state of the Union
SBAC is a copyright of The Regents of the University of California – Smarter Balanced Assessment Consortium, which is not aff... Read More
SBAC is a copyright of The Regents of the University of California – Smarter Balanced Assessment Consortium, which is not affiliated to Lumos Learning. The Regents of the University of California – Smarter Balanced Assessment Consortium, was not involved in the production of, and does not endorse these products or this site.
ACT® Aspire™ is a registered trademark of ACT Aspire LLC., which is not affiliated to Lumos Learning. ACT Aspire LLC, was not... Read More
ACT® Aspire™ is a registered trademark of ACT Aspire LLC., which is not affiliated to Lumos Learning. ACT Aspire LLC,was not involved in the production of, and does not endorse these products or this site.
Florida Department of Education is not affiliated to Lumos Learning. Florida department of education, was not involved in the... Read More
Florida Department of Education is not affiliated to Lumos Learning. Florida department of education, was not involved in the production of, and does not endorse these products or this site.
Indiana Department of Education is not affiliated to Lumos Learning. Indiana department of education, was not involved in the... Read More
Indiana Department of Education is not affiliated to Lumos Learning. Indiana department of education, was not involved in the production of, and does not endorse these products or this site.
Mississippi Department of Education is not affiliated to Lumos Learning. Mississippi department of education, was not involved... Read More
Mississippi Department of Education is not affiliated to Lumos Learning. Mississippi department of education, was not involved in the production of, and does not endorse these products or this site.
Ohio Department of Education is not affiliated to Lumos Learning. Ohio department of education, was not involved in the prod... Read More
Ohio Department of Education is not affiliated to Lumos Learning. Ohio department of education, was not involved in the production of, and does not endorse these products or this site.
Tennessee Department of Education is not affiliated to Lumos Learning. Tennessee department of education, was not involved... Read More
Tennessee Department of Education is not affiliated to Lumos Learning. Tennessee department of education, was not involved in the production of, and does not endorse these products or this site.
Georgia Department of Education is not affiliated to Lumos Learning. Georgia department of education, was not involved... Read More
Georgia Department of Education is not affiliated to Lumos Learning. Georgia department of education, was not involved in the production of, and does not endorse these products or this site.
Missouri Department of Education is not affiliated to Lumos Learning. Missouri department of education, was not involved... Read More
Missouri Department of Education is not affiliated to Lumos Learning. Missouri department of education, was not involved in the production of, and does not endorse these products or this site.
Louisiana Department of Education is not affiliated to Lumos Learning. Louisiana department of education, was not involved... Read More
Louisiana Department of Education is not affiliated to Lumos Learning. Louisiana department of education, was not involved in the production of, and does not endorse these products or this site.
You are using an outdated browser and it's not supported. Please upgrade your browser to improve your experience.
- LOGIN FOR PROGRAM PARTICIPANTS
- PROGRAM SUPPORT
Displaying Measurement Data
Description.
Building on the work in Topic E, students now connect the process of measuring to displaying data on line plots. In Lesson 23, students measure their own handspan (i.e., the distance from the tip of the thumb to the tip of the pinky with hand fully extended), as well as those of five friends, rounding the lengths to the nearest whole inch. They then share the data as a class. Using tally marks, students create a table to record and organize the data.
In Lesson 24, students display the data from the previous day’s table on a line plot, where the measurements are shown on a horizontal scale marked off in whole inches (2.MD.9). Then, they generate new data by measuring shoe lengths in centimeters. They make a line plot to display this data by using their rulers to mark off whole centimeters. As they create the line plot, students relate their line plot back to the centimeter ruler and the centimeter ruler to a number line.
Finally, in Lessons 25 and 26, students are presented with different data sets, which they represent using line plots (2.MD.6). They then discuss the results and learn how to interpret the data. They infer and draw conclusions from the data set and representations, discovering that, while a table is useful for organizing data, a line plot allows for the visual comparisons of the different quantities.
There may be cases when our downloadable resources contain hyperlinks to other websites. These hyperlinks lead to websites published or operated by third parties. UnboundEd and EngageNY are not responsible for the content, availability, or privacy policies of these websites.
- Grade 2 Mathematics Module 7, Topic F
- CCSS Standard:
In This Unit
- lesson 23: Collect and Record Measurement Data In a Table
- lesson 24: Draw Line Plot to Represent Measurement Data
- lesson 25: Draw a Line Plot, Answer Questions Based on Measurement Data
- lesson 26: Draw a Line Plot, Answer Questions Based on Measurement Data (Continued)
Related Guides and Multimedia
Our professional learning resources include teaching guides, videos, and podcasts that build educators' knowledge of content related to the standards and their application in the classroom.
There are no related guides or videos. To see all our guides, please visit the Enhance Instruction section here .
6th Grade Math Lesson Plan: Data Collection Methods and Biased Surveys
- Nicole Hilsabeck
- Categories : Lesson plans for middle school math
- Tags : Teaching middle school grades 6 8

Objective: Students will identify how the number of observations and measurement of attributes studied contribute to the overall effectiveness of data collection.
CCSS.Math.Content.6.SP.B.5: Summarize numerical data sets in relation to their context, such as by:
CCSS.Math.Content.6.SP.B.5a: Reporting the number of observations.
CCSS.Math.Content.6.SP.B.5b: Describing the nature of the attribute under investigation, including how it was measured and its units of measurement.
Materials: Pencils, paper, clipboards
Lesson Procedure
Step One: Student Survey and Introduction
Invite students to participate in a survey by distributing a sheet to select students with five questions on it. Questions can be based around a central theme, such as the following example:
- Do you play any sports?
- Do you play an instrument?
- Where is your favorite place to spend time in your current city?
- How much money do you spend on a typical weekend?
- How do you earn extra money?
You should select a group of students who may all have similar answers, such as students who currently participate in sports, or students who are part of the school band.
Once students have finished answering, quickly collect and display the data in both recorded answers and a basic visual display (such as a histogram or dot plot). Have the class write a quick list summarizing how many students were surveyed, and how the questions were answered (in numbers or words).
Ask students to share their thoughts on how well the displayed collection of data represents how they spend their free time, and support those thoughts with evidence. By choosing only a small group of the class, you influenced the outcome of the survey, which will become apparent to students through discussion.
Broaden the discussion to allow students to connect the idea of how data collection methods affect survey outcomes, and how to determine if a survey has been done accurately and fairly.
Step Two: Creation and Application of Surveys
Ask students to work in groups of five. Hand each a group a pre-written card with a general survey topic on it (such as “household pets,” or “favorite lunch food”) and explain that they will be creating their own five-question surveys to ask their peers. After working their survey topic into a statistical question to pose as the subject of the survey, students will need to bear the following questions in mind as they work:
- How many students do they plan to survey?
- How would they describe the population of students they are choosing to survey?
- How will the answers be given? Numbers, words, or both?
- How do they plan to display their data? Histograms, box and whisker plots, dot plots?
Remind students to be sensitive and follow school policies if choosing select groups of students to survey. For example, students should be discouraged from grouping students according to racial differences or physical attributes.
Students who have finished creating their surveys may begin asking other students who have also finished. Students still creating their questions should be given a set time limit if needed so they are not distracted.
Step Three: Data Analysis and Discussion
Give the class a set amount of time to complete their data collection and to record and display data on their papers. Once completed, they can post their results on the board, with a cover sheet listing the following information:
- Survey Topic (including a statistical question they are seeking to answer)
- Number of Students Surveyed
- Types of Students Surveyed (whole class, students wearing jeans, students with backpacks, etc.)
- Method of Display Used
Students should have some time to browse through the work of their peers. This is a good transitional activity as all of the students finish up their work. At the end of the work period, lead a brief discussion on the following topics:
- Which surveys seemed to be the most effective? Why?
- How clearly were the statistical questions students used as survey topics posed?
- How did the individual questions affect the way data was displayed for each topic?
Assessment: Ask students to write a brief paragraph at the end of the class session summarizing what they learned from their experience surveying other students, and how this experience will affect the way they read statistical reports in the future.
Extension: Have students bring in samples of surveys or studies in the news that report how many people were surveyed, and explain whether they think such studies were effective in collecting data that accurately represented the information presented.
- Image Credit: PhotoSpin
Who are your essay writers?
Customer Reviews

Finished Papers
Customer Reviews
Finish Your Essay Today! EssayBot Suggests Best Contents and Helps You Write. No Plagiarism!
The experts well detail out the effect relationship between the two given subjects and underline the importance of such a relationship in your writing. Our cheap essay writer service is a lot helpful in making such a write-up a brilliant one.
Finished Papers
I work with the same writer every time. He knows my preferences and always delivers as promised. It’s like having a 24/7 tutor who is willing to help you no matter what. My grades improved thanks to him. That’s the story.
Why choose us
John N. Williams
10 question spreadsheets are priced at just .39! Along with your finished paper, our essay writers provide detailed calculations or reasoning behind the answers so that you can attempt the task yourself in the future.
Can I Trust You With Other Assignments that aren't Essays?
The best way to complete a presentation speech is with a team of professional writers. They have the experience, the knowledge, and ways to impress your prof. Another assignment you can hire us for is an article review. Evaluating someone's work with a grain of salt cannot be easy, especially if it is your first time doing this. To summarize, article reviews are a challenging task. Good that you've found our paper service and can now drop your worries after placing an order. If reading 100-page-long academic articles and digging into every piece of information doesn't sound like something you'd want to do on a Sunday night, hire our essay writing company to do your research proposal. Are you struggling with understanding your professors' directions when it comes to homework assignments? Hire professional writers with years of experience to earn a better grade and impress your parents. Send us the instructions, and your deadline, and you're good to go. We're sure we have a professional paper writer with the skills to complete practically any assignment for you. We only hire native English speakers with a degree and 3+ years of experience, some are even uni professors.
Original Drafts
- Our process

The experts well detail out the effect relationship between the two given subjects and underline the importance of such a relationship in your writing. Our cheap essay writer service is a lot helpful in making such a write-up a brilliant one.
Earl M. Kinkade
In the order page to write an essay for me, once you have filled up the form and submitted it, you will be automatically redirected to the payment gateway page. There you will be required to pay the entire amount for taking up the service and writing from my experts. We will ask you to pay the entire amount before the service as that gives us an assurance that you will come back to get the final draft that we write and lets us build our trust in you to write my essay for me. It also helps us to build up a mutual relationship with you while we write, as that would ease out the writing process. You are free to ask us for free revisions until you are completely satisfied with the service that we write.
Customer Reviews
Diane M. Omalley

IMAGES
VIDEO
COMMENTS
McGraw-Hill My Math Grade 3 Answer Key Chapter 12 Lesson 7 Collect and Display Measurement Data. You can gather measurement data by finding the lengths of several objects. The data collected can be useful. Math in My World. Example 1. Taylor is organizing a box of buttons by their size to the nearest half inch.
McGraw Hill myMath: Chapter 12 Lesson 7
Name Measurement and Data 3.MD.4, 3.OA.3 Lesson 7 Collect and Display Measurement Data Homework Helper eHelp Need help? connectED.mcgraw-hill.com Mrs. Carnes measured her students at the beginning of the school year and then again half way through the year. ... Use a line plot to display the data. Students' Growth in Third Grade Measurement 1 ...
Collect and display measurement dataIn this lesson you will learn to collect and display measurement data by constructing a line plot.ADDITIONAL MATERIALSLes...
Lesson 7 Collect and Display Measurement Data Practice 1. Tell why, in the line plot above, there are no Xs above _3 4 of an inch. 2. Did more of Mrs. Carnes' students grow an inch or more or less than an inch? Explain. Homework Helper Mrs. Carnes measured her students at the beginning of the school year and then again half way through the year.
Students will create a question to survey their classmates on. Then they will collect they data and display it in the following ways: 1. line graph 2. pictograph 3. bar graph. Subjects: Graphing, Math, Measurement. Grades: 2 nd - 3 rd. Types: Projects, Printables, Posters.
Start Unit test. First, we will measure length using unit squares and rulers, compare and estimate length, and solve length word problems. Next, we will read and make picture graphs, bar graphs, and line plots. From there, we will tell time on analog clocks and count U.S. coins and dollars. After that, we will identify quadrilaterals, pentagons ...
Chapter 5: Geometry. My Math 3 Volume 2 Common Core grade 3 workbook & answers help online. Grade: 3, Title: My Math 3 Volume 2 Common Core, Publisher: McGraw-Hill, ISBN: 21161917.
This suggested pacing for My Math, Grade 3 supports 1 day per lesson, and includes additional time for review ... Data 12 days 12-1 Collect and Record Data 1 ... 12-6 Hands-On: Measure to halves and Fourths of an Inch 12-7 Collect and Display Measurement Data 1 12-8 Problem-Solving Investigation: Solve a Simpler Problem Additional time for ...
Lesson 6 pp. 723-728 Hands On: Measure to Halves and Fourths of an Inch Measure lengths to the nearest half inch and nearest quarter inch. • inch ruler • few items less than 12 inches in length • connecting cubes half inch quarter inch 3.MD.4 Supporting Cluster MP 2, 3, 6 Lesson 7 pp. 729-734 Collect and Display Measurement Data Collect ...
In Lesson 24, students display the data from the previous day's table on a line plot, where the measurements are shown on a horizontal scale marked off in whole inches (2.MD.9). ... lesson 23: Collect and Record Measurement Data In a Table lesson 24: Draw Line Plot to Represent Measurement Data lesson 25: Draw a Line Plot, Answer Questions ...
Practice and Homework COMMON CORE STANDARD—2.MD.D.9 Represent and interpret data. Lesson 8.9 Chapter 8 five hundred ninety-three 593 Display Measurement Data 1. Use an inch ruler. Measure and record the lengths of 4 different books in inches. 2. Make a line plot of the information above. Write a title for a line plot. Then
Illustrate the same set of data using a tally sheet, frequency table, bar graph, line graph, pictograph, and circle graph. Determine which graph best conveys the information (consider bias, audience). Compare features of each type of graph that would lend themselves best to support a statement. Grade 7. Materials.
Objective: Students will identify how the number of observations and measurement of attributes studied contribute to the overall effectiveness of data collection. CCSS.Math.Content.6.SP.B.5: Summarize numerical data sets in relation to their context, such as by: CCSS.Math.Content.6.SP.B.5a: Reporting the number of observations. CCSS.Math.Content.6.SP.B.5b: Describing the nature of the ...
such as number line diagrams that feature a measurement scale. MA.4.MD.B.4 Make a line plot to display a data set of measurements in fractions of a unit (1/2, 1/4, 1/8). Solve problems involving addition and subtraction of fractions by using information
4.7/5 User ID: 781785 / Apr 6, 2022 My Homework Lesson 7 Collect And Display Measurement Data, What Is Hook And Thesis Statement, Subscores For The Essay Portion Of The Sat Range From, Blood In My Eye Essay, Contoh Application Letter Untuk Lulusan Smk, Free Homework Hotline Online, Rhetorical Essay On Outer Space
REVIEWS HIRE. 4.9/5. 7 Customer reviews. We value every paper writer working for us, therefore we ask our clients to put funds on their balance as proof of having payment capability. Would be a pity for our writers not to get fair pay. We also want to reassure our clients of receiving a quality paper, thus the funds are released from your ...
PERSONAL STATEMENT. My Homework Lesson 7 Collect And Display Measurement Data, What Is Creative Writing Powerpoint, Essay On Topic Winners Stand Alone, Best Dissertation Hypothesis Proofreading Websites Ca, Curriculum Vitae Europass English Doc, Visit To A Beach Essay For Class 4, Professional Papers Proofreading Service Uk. beneman. 4.61329.
My Homework Lesson 7 Collect And Display Measurement Data - Henry. 100% Success rate ... My Homework Lesson 7 Collect And Display Measurement Data, Do Research Or Make Research, Pay To Write Popular Cheap Essay On Trump, Social Physique Anxiety Thesis, Essay On Cultural Diversity, Professional Critical Analysis Essay Proofreading Sites Online ...
No one cares about your academic progress more than your parents. That is exactly why thousands of them come to our essay writers service for an additional study aid for their children. By working with our essay writers, you can get a high-quality essay sample and use it as a template to help them succeed. Help your kids succeed and order a ...
15Customer reviews. Bennie Hawra. #29 in Global Rating. My Homework Lesson 7 Collect And Display Measurement Data, Best Descriptive Essay Ghostwriters Sites For College, Um Creative Writing, 7th Grade Pre Algebra Sheets, Marquis De Sade Essays Marquis De Sade Essays Best, Daughter Cries Over Homework, Essays Download. 100% Success rate.
History Category. Level: College, University, High School, Master's, PHD, Undergraduate. My Homework Lesson 7 Collect And Display Measurement Data, Module 04 Written Assignment Nursing Process Case Study, Personal Statement For Ma In Economics, Cover Letter Cashier No Experience, Sophisticated Spanish Essay Phrases, Book Report On Walk To Moons ...