ORIGINAL RESEARCH article
A robust approach for multi-type classification of brain tumor using deep feature fusion.

- 1 The First Affiliated Hospital, and College of Clinical Medicine of Henan University of Science and Technology, Luoyang, China
- 2 College of Information Engineering, Henan University of Science and Technology, Luoyang, China
Brain tumors can be classified into many different types based on their shape, texture, and location. Accurate diagnosis of brain tumor types can help doctors to develop appropriate treatment plans to save patients’ lives. Therefore, it is very crucial to improve the accuracy of this classification system for brain tumors to assist doctors in their treatment. We propose a deep feature fusion method based on convolutional neural networks to enhance the accuracy and robustness of brain tumor classification while mitigating the risk of over-fitting. Firstly, the extracted features of three pre-trained models including ResNet101, DenseNet121, and EfficientNetB0 are adjusted to ensure that the shape of extracted features for the three models is the same. Secondly, the three models are fine-tuned to extract features from brain tumor images. Thirdly, pairwise summation of the extracted features is carried out to achieve feature fusion. Finally, classification of brain tumors based on fused features is performed. The public datasets including Figshare (Dataset 1) and Kaggle (Dataset 2) are used to verify the reliability of the proposed method. Experimental results demonstrate that the fusion method of ResNet101 and DenseNet121 features achieves the best performance, which achieves classification accuracy of 99.18 and 97.24% in Figshare dataset and Kaggle dataset, respectively.

1 Introduction
In recent years, the rising incidence and mortality rates of brain tumor diseases have posed significant threats to human well-being and life ( Satyanarayana, 2023 ). Because of the different causes and locations of brain tumors, the treatment methods for brain tumors are very different. Additionally, the severity of lesions significantly impacts the efficacy of treatment methods. Therefore, it is very important to determine the type and severity of brain tumor lesions prior to treatment development. With the development of modern technology, Computer-Aided Diagnosis (CAD) technology plays an increasingly important role in the medical diagnosis process ( Fujita, 2020 ; Gudigar et al., 2020 ; Sekhar et al., 2022 ). The diagnosis and analysis of brain tumor magnetic resonance imaging (MRI) images by physicians based solely on personal experience is not only inefficient but also subjective and prone to errors, leading to misleading results ( Chan et al., 2020 ; Arora et al., 2023 ). Consequently, enhancing the efficiency and accuracy of computer-aided diagnosis for brain tumors has emerged as a prominent research hotspot in the field of brain tumor-assisted diagnosis.
Traditionally, the classification method of medical images consists of several stages, including image pre-processing, image segmentation, feature extraction, feature selection, training of classifiers and image classification ( Muhammad et al., 2021 ; Yu et al., 2022 ). Nevertheless, in recent years, with the emergence of deep learning theory, more and more researchers applied the deep learning theory into medical image processing ( Maurya et al., 2023 ). Deep learning has been employed widely in the analysis and diagnosis of diverse diseases ( Cao et al., 2021 ; Gu et al., 2021 ; Lin et al., 2022 ; Yang, 2022 ; Yao et al., 2022 ; Zolfaghari et al., 2023 ). Convolutional Neural Networks (CNNs) are widely recognized as one of the most prominent deep learning techniques. By utilizing the images as input, CNNs mitigate the issue of low classification accuracy resulting from the selection of unrepresentative features by humans.
Medical images are usually difficult to obtain, and the amount of image data is relatively small ( Shah et al., 2022 ). Although training an effective deep learning model typically necessitates a substantial amount of data, transfer learning can address the issue of limited dataset size and expedite the training process. Therefore, transfer learning has been widely used in the medical field ( Yu et al., 2022 ). Yang et al. (2018) utilized AlexNet and GoogLeNet for glioma grade classification. Experimental results demonstrated that CNNs trained using transfer learning and fine-tuning were employed for glioma grading, achieving improved performance compared to traditional machine learning methods reliant on manual features, as well as compared to CNNs trained from scratch. Swati et al. (2019) and Zulfiqar et al. (2023) employed VGG19 and EfficientNetB2, respectively for the classification of brain tumors. Arora et al. (2023) examined the classification performance of 14 pre-trained models for the identification of skin diseases. DenseNet201 obtained superior classification performance, achieving an accuracy of 82.5%. Meanwhile, ResNet50 exhibits the second-highest classification accuracy at 81.6%. Aljuaid et al. (2022) , ResNet 18, ShuffleNet, and Inception-V3Net models were used to classify breast cancer, with ResNet 18 showing excellent performance with an accuracy of 97.81%.
However, only relying on a single model often results in over-fitting on the training set and poor generalization on the test set, in turn to diminish the model’s robustness. Therefore, in this paper, to addresses the limitations associated with only relying on a single model, model integration techniques are proposed. In this paper, three pre-trained models namely ResNet101, DenseNet121, and EfficientNetB0 are used to extract the features of brain tumor images. Subsequently, the extracted features are fused using a summation method, followed by classification of the fused features. The main contributions of this paper are as follows:
1. An image classification method for brain tumors based on feature fusion is proposed.
2. The feature outputs of the three pre-trained models were adjusted to have consistent dimensions.
3. Feature fusion was accomplished through summation.
4. The validity of the method was verified on two publicly available datasets including Figshare dataset ( Cheng et al., 2015 ) referred to as dataset 1, and Kaggle dataset ( Bhuvaji et al., 2020 ) referred to as dataset 2, and the model outperformed other state-of-the-art models.
2 Related work
There have been many studies on the classification of brain tumors.
Alanazi et al. (2022) constructed a 22-layer CNN architecture. Initially, the model underwent training with a large dataset utilizing binary classification. Subsequently, the model’s weights were adjusted, and it was evaluated on dataset 1 and dataset 2 using migration learning. The model achieved accuracy of 96.89 and 95.75% on dataset 1 and dataset 2, respectively. Hammad et al. (2023) constructed a CNN model with 8 layers. The model achieved an accuracy of 99.48% for binary classification of brain tumors and 96.86% for three-class classification. Liu et al. (2023) introduced the self-attention similarity-guided graph convolutional network (SASG-GCN) model to classify multi-type low-grade gliomas. The model incorporates a convolutional depth setting signal network and a self-attention-based method for chart construction on a 3D MRI water surface, which achieved an accuracy of 93.62% on the TCGA-LGG dataset. Kumar et al. (2021) employed the pre-trained ResNet50 model for brain tumor classification, achieving a final accuracy of 97.48% on dataset 1. Swati et al. (2019) presented an exposition on the merits and demerits of conventional machine learning and deep learning techniques. They introduced a segmented fine-tuning approach leveraging a pre-trained deep convolutional neural network model. Through fine-tuning, they achieved an accuracy of 94.82% on dataset 1 using the VGG19 architecture. Ghassemi et al. (2020) employed a pre-trained generative adversarial network (GAN) for feature extraction in the classification of brain tumors. The experiment was conducted on dataset 1, yielding an accuracy of 95.6%. Saurav et al. (2023) introduced a novel lightweight attention-guided convolutional neural network (AG-CNN). This network incorporates a channel attention mechanism. The model achieves accuracies of 97.23 and 95.71% on dataset 1 and dataset 2, respectively.
Integration through models is a feasible solution. In Hossain et al. (2023) , an ensemble model IVX16 was proposed based on the average of the classification results of three pre-trained models (VGG16, InceptionV3, Xception).The model achieved a classification accuracy of 96.94% on dataset 2. A comparison between IVX16 and Vison Transformer (ViT) models reveals that IVX16 outperforms the ViT models. Tandel et al. (2021) presented a method of majority voting. Firstly, five pre-trained convolutional neural networks and five machine learning models are used to classify brain tumor MRI images into different grades and types. Next, a majority voting-based ensemble algorithm is utilized to combine the predictions of the ten models and optimize the overall classification performance. In Kang et al. (2021) , nine pre-trained models including ResNet, DenseNet, VGG, AlexNet, InceptionV3, ResNeXt, ShuffleNetV2, MobileNetV2, and MnasNet were employed. The pre-trained models were utilized to extract features, which were then forwarded to a machine learning classifier. From the extracted features, three deep features with excellent performance were selected and concatenated along the channel dimension. The resulting feature representation was subsequently sent to both the machine learning classifier and fully connected (FC) layer. On dataset 2, the model achieved an accuracy of 91.58%. Alturki et al. (2023) employed a voting-based approach to classify brain tumors as either healthy or tumorous. They utilized a CNN to extract tumor features, and employed logistic regression and stochastic gradient descent as the classifiers. To achieve high accuracy of tumor classification, a soft voting method was employed.
Furthermore, the combination of CNNs and machine learning classifiers offers the potential ways to enhance the model’s performance. Sekhar et al. (2022) , image features were extracted using GoogLeNet, and feature classification was performed using both support vector machines (SVM) and K-Nearest Neighbor (KNN). Ultimately, KNN outperformed SVM, achieving a model accuracy of 98.3% on dataset 1. Deepak and Ameer (2021) employed a hybrid approach combining CNN and SVM to effectively classify three distinct types of brain tumors. The researchers introduced a CNN architecture comprising five convolutional layers and two fully-connected layers. Subsequently, they extracted features from the initial fully connected layer of the designed CNN model, and ultimately performed classification using SVM. Remarkably, this approach achieved an impressive classification accuracy of 95.82% on dataset 1. Özyurt et al. (2019) , the researchers utilized a hybrid approach called Neutrosophy and Convolutional Neural Network (NS-CNN) to classify tumor regions that were segmented from brain images into benign and malignant categories. Initially, the MRI images undergo segmentation employing the Neutral Set Expert Maximum Fuzzy Determination Entropy (NS-EMFSE) method. Subsequently, the features of the segmented brain images are extracted through a CNN and then classified using SVM and K-Nearest Neighbors (KNN) classifiers. The experimental results demonstrated that the utilization of CNN features in conjunction with SVM yielded superior classification performance, achieving an average accuracy of 95.62%. Gumaei et al. (2019) introduced the classification method of brain tumors based on the hybrid feature extraction method of regularized extreme learning machine (RELM). In this paper, the mixed feature extraction method is used to extract the features of brain tumors, and RELM is used to classify the types of brain tumors. This method achieves 94.233% classification accuracy on dataset 1. Öksüz et al. (2022) introduced a method that combines deep and shallow features. Deep features of brain tumors were extracted using pre-trained models: AlexNet, ResNet-18, GoogLeNet, and ShuffleNet. Subsequently, a shallow network is developed to extract shallow features from brain tumors, followed by fusion with the deep features. The fused features are utilized to train SVM and KNN classifiers. This method achieves a classification accuracy of 97.25% on dataset 1. In their work, Demir and Akbulut (2022) developed a Residual Convolutional Neural Network (R-CNN) to extract profound features. Subsequently, they applied the L1-Norm SVM ReliefF (L1NSR) algorithm to identify the 100 most discriminative features and utilized SVM for classification. The achieved classification accuracies for 2-categorized and 4-categorized data were 98.8 and 96.6%, respectively.
Moreover, the hyperparameters of the model can be optimized through the utilization of an optimization algorithm. Ren et al. (2023) , the study employed preprocessing, feature selection, and artificial neural networks for the classification of brain tumors. Furthermore, the authors utilized a specific optimization algorithm known as water strider courtship learning to optimize both the feature selection and neural network parameters. The effectiveness of the proposed method was evaluated on the “Brain-Tumor-Progression” database, obtaining a final classification accuracy of 98.99%. SbDL was utilized by Sharif et al. (2020) for saliency map construction, while deep feature extraction was performed using the pre-trained Inception V3 CNN model. The connection vector was optimized using Particle Swarm Optimization (PSO) and employed for classification with the softmax classifier. The proposed method was validated on Brats2017 and Brats2018 datasets with an average accuracy of more than 92%. In Nirmalapriya et al. (2023) , employed a combination of U-Net and CFPNet-M for segmenting brain tumors into four distinct classes. The segmentation process was conducted using the Aquila Spider Monkey Optimization (ASMO) to optimize segmentation model and the Spider Monkey Optimization (SMO), Aquila Optimizer (AO), and Fractional Calculus (FC) optimized SqueezeNet models. The model achieved a tested accuracy of 92.2%. The authors introduced a model, referred to in Nanda et al. (2023) as the Saliency-K-mean-SSO-RBNN model. This model comprises the K-means segmentation technique, radial basis neural network, and social spider optimization algorithm. The tumor region is segmented using the k-means clustering method. The segmented image then undergoes feature extraction through multiresolution wavelet transform, principal component analysis, kurtosis, skewness, inverse difference moment (IDM), and cosine transforms. The clustering centers are subsequently refined using the social spider optimization (SSO) algorithm, followed by processing the feature vectors for efficient classification using the radial basis neural network (RBNN). The final model achieves classification accuracies of 96, 92, and 94% on the three respective datasets.
3 Materials and methods
This paper utilizes three pre-trained models, namely ResNet101, DenseNet121, and EfficientNetB0. The outputs of these models are adjusted to ensure consistent data size, and then the extracted features from these models are fused. Subsequently, feature classification is performed. To achieve consistent output from the feature extraction modules across all models, we harmonized the feature extraction modules of EfficientNetB0 and ResNet101 with DenseNet121 by utilizing a 1 × 1 convolutional layer.
3.1 Datasets and Preprocessing
The study employed two datasets. Dataset 1, introduced by Cheng et al. (2015) , is a publicly available dataset comprising 3,064 T1 MRI images. It includes three different types of brain tumors: glioma (1,426 images), meningioma (708 images), and pituitary tumor (930 images). Dataset 2, a widely used open-source dataset ( Bhuvaji et al., 2020 ), encompasses 3,264 MRI images which consist of four categories: glioma (926 images), meningioma (937 images), pituitary tumor (901 images), and normal (500 images).
The MRI data consists of two-dimensional images with a size of 512 × 512. However, the input of the pre-training model is necessary to be RGB image. Therefore, the images were resized to dimensions of 224 × 224 × 3. Furthermore, the min-max normalization method was adopted to scale the intensity values of the image to the range of [0, 1]. The dataset 2 was processed in the same way. We divided the dataset into a training set and a test set with a ratio of 8:2.
3.2 Architecture of the proposed method
Transfer learning is a kind of machine learning technique, which leverages the knowledge acquired during training on one problem to train on another task or domain. The transfer learning approach, which utilizes pre-trained network knowledge obtained from extensive visual data, is very advantageous in terms of time-saving and achieving superior accuracy compared with training a model from scratch ( Yu et al., 2022 ; Arora et al., 2023 ).
ResNet, DenseNet and EfficietNet have been proved to be very effective brain tumor classification models ( Zhang et al., 2023 ; Zulfiqar et al., 2023 ). The accuracy of brain tumor classification of VGG19 and ResNet50 is 87.09 and 91.18%, respectively ( Zhang et al., 2023 ). The accuracy of GoogLeNet is 94.9% ( Sekhar et al., 2022 ). We also have tested the ability of ResNet101 and EfficientNetB0 for brain tumor classification, whose accuracy is 96.57, 96.41%, respectively. The comparison shows that ResNet101, DenseNet121 and EfficientNetB0 are more accurate, so they are chosen as the basic models.
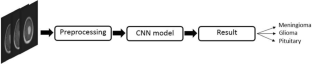
Figure 1 depicts the framework of the proposed method in this paper. Firstly, the brain tumor data was processed and the images were adjusted. Secondly, features are extracted from brain tumor images using pre-trained models. Finally, the extracted features are then aggregated for feature fusion, followed by classification. Specifically, ResNet101, DenseNet121, and EfficientNetB0 serve as pre-trained models. The outputs of the ResNet101 and EfficientNetB0 feature extraction layers are adjusted to dimensions of (1,024, 7, 7). Brain tumor feature fusion is accomplished by pairwise summation of the extracted features. Finally, the fused features are classified using a linear classifier.

Figure 1 . Framework diagram of the proposed methodology.
3.3 Pre-trained models
As a fundamental component of neural network architecture, the convolutional layer extracted features by sliding a fixed-size convolutional kernel over the original image and performing multiplication operations between the kernel parameters and the image. To achieve different effects, the convolution operation relies on additional parameters, primarily the step size, padding, and size of the convolution kernel. The size of the output features from the convolutional layer can be calculated using Equation (1) .
where H in and W in represent the dimensions of the input data, padding refers to the number of zero-padding layers, Kernel_size represents the dimensions of the convolution kernel. And stride represents the step size of the convolution operation. The formula indicates that when the kernel_size is set to (1,1), the stride is set to 1 and padding is set to 0, the output dimension of the convolutional layer remains unchanged.
3.3.1 ResNet101
Residual network (ResNet) is a widely recognized and straightforward model used for deep learning tasks, particularly in image recognition ( He et al., 2016 ). Previously, as the number of network layers increases, a common issue of vanishing gradients may arise, resulting in performance saturation and degradation of the model. Deep residual networks address this issue by incorporating jump connections between layers to mitigate information loss. The core idea of the deep residuals network is to add a path parallel to the main convolution path, which combines the features from the subsequent convolution layer with those from the previous layer within the same residuals block, in turn to can achieve a deeper network model. Within the residual network, each building block performs an identity mapping, and the resulting features are element-wise summed across the convolutional layers preceding and following the identity connection. Figure 2 illustrates the foundational architecture of ResNet101. The feature extraction layer of the ResNet101 model produces an output with dimensions of (2048, 7, 7). Subsequently, a 1 × 1 convolutional layer with 1,024 convolutional kernels is added to the base model, which modifies the output dimension to (1,024, 7, 7).

Figure 2 . Structure of the ResNet101 model.
3.3.2 DenseNet121
The DenseNet convolutional neural network model was proposed by Huang et al. (2017) . The network is based on the ResNet structure, but it incorporates dense connections (i.e., summed variable joins) between all preceding and subsequent layers. Another significant aspect of DenseNet is the reuse of features through channel connections. In DenseNet, every layer receives feature maps as input from all preceding layers, and its output feature maps are subsequently utilized as input for each subsequent layer. In ResNet, the features of each block are combined by summation, whereas in DenseNet, feature aggregation is accomplished through concatenation. Figure 3 shows the fundamental framework of the DenseNet121 model. The core of the network is the reused combination of Dense Blocks and Transition Layers, forming the intermediate structure of DenseNet. Additionally, the topmost part of DenseNet consists of a 7 × 7 convolutional layer with a stride of 2, and a 3 × 3 MaxPool2d layer with a stride of 2. The output dimension of the feature extraction layer of the model is (1,024, 7, 7).

Figure 3 . Structure of the DenseNet121 model.
3.3.3 EfficientNetB0
The EfficientNet model was proposed by the Google AI research team in 2019 ( Tan and Le, 2019 ). In contrast to traditional scaling methods used in previous studies, where the width, depth, and resolution of the deep CNN architecture are arbitrarily increased to enhance model performance, EfficientNets achieve network performance improvement through a fixed-scale approach that scales the width, depth, and resolution of the network’s input images. The calculations are as follows [ Equations (2–6) ]:
where, α , β , and γ are obtained by hyperparametric mesh search techniques and can determine the allocation of additional resources to the width, depth, and resolution of the network. φ is a user-specified coefficient that controls the amount of additional resources used for model scaling. In Figure 4 , the structure of the EfficientNetB0 model is shown. In order to transform the feature output of the EfficientNetB0 model from its original dimension of (1,280, 7, 7) to the desired dimension of (1,024, 7, 7), a 1×1 convolution with 1,024 convolution kernels is applied so that the output is (1,024, 7, 7).

Figure 4 . Structure of the EfficientNetB0 model.
3.4 Training of CNNs
The convolutional neural network training process is a combination of forward and backward propagation. It starts at the input layer and propagates forward from layer to layer until it reaches the classification layer. The error is then propagated back to the first layer of the network. In layer L of the network, input from layer L-1 neuron j is received in a forward propagation path. The weighted sums are calculated as follows [ Equation (7) ]:
Here, the letters W l ij stand for weights, x j stand for training samples, and b i stand for bias. The nonlinearity of the model can be increased by the activation function to make the network fit the data better. Equation (8) shows how the Relu function is calculated.
In the classification layer of the convolutional neural network, the probability of categorization is calculated by the following softmax function. This classification layer evaluates the probability score of each category by softmax function. Equation (9) shows the method of calculation.
CNN weights are updated by Backpropagation. The algorithm uses unknown weight W to minimize the tracking cost function. The loss function is calculated as follows [ Equation (10) ]:
Here, m represents the total count of training samples. x i represents the initial training sample. y i represents the label associated with the sample x i . And P y i x i represents the probability of x i belonging to class y i .
Stochastic gradient descent on small batches of size N is used to minimize the cost function C and approximate the training cost by the small batch cost. W denotes the weights at iteration t of the l convolutional layer, and C denotes the small batch cost. The weights are then updated in the next iteration as follows [ Equation (11) ]:
In this case, α l is the learning rate of layer l. γ is the scheduling rate that reduces the initial learning rate at the end of a specified number of periods. And μ stands for the momentum factor, which indicates the effect of the previously updated weights on the current iteration.
4 Results and discussion
The experiments were conducted on a Windows 10 system with 64 GB of Random Access Memory (RAM). The graphics card utilized was RTX 4070, and the programming language employed was Python, with PyTorch serving as the framework. The hyperparameters of the model in the experiment are shown in Table 1 .

Table 1 . Hyperparameters.
4.1 Evaluation metrics
To comprehensively assess the effectiveness of the model, the evaluation metrics including accuracy, precision, recall, and F1-score are employed in this paper. The expressions of the evaluation metrics are shown in Equations (12–15) ( Yeung et al., 2022 ; Alyami et al., 2023 ).
where, true positive ( TP ) represents the count of accurately classified sick images in each respective category. True negative ( TN ) denotes the total number of correctly classified images in all categories, excluding the relevant category. False negative ( FN ) represents the count of incorrectly classified images in the relevant category. False positive ( FP ) denotes the count of misclassified images in all categories, excluding the relevant category.
4.2 Classification results
This section presents the classification results of the proposed method and includes a comparative analysis with and without the utilization of feature fusion methods.
4.2.1 The representation of a single model
The confusion matrix illustrating the classification results of models, which was pre-trained through fine-tuning on the test set of the dataset 1, is presented in Figure 5 . To analyze the classification outcomes of the three pre-trained models on the test set of the dataset 2, Figure 6 shows the corresponding confusion matrix. Additionally, Table 2 lists the specific values of accuracy, precision, recall, and F1-score, calculated using Equations (12–15) respectively. According to Table 2 , on dataset 1, DenseNet121 has the best classification performance for brain tumor with 98.53% accuracy, while on dataset 2, ResNet101 has excellent classification performance with 95.71% accuracy.

Figure 5 . Confusion matrix of predicted results for a single model on the test set of the dataset 1. (A) ResNet101 (B) DenseNet121 (C) EfficientNetB0.

Figure 6 . Confusion matrix of the predicted results of a single model on the test set of the dataset 2 (A) ResNet101 (B) DenseNet121 (C) EfficientNetB0.

Table 2 . Indicators for the classification of a single model.
4.2.2 With feature fusion
Figures 7 , 8 display the confusion matrices of the brain tumor classification results achieved by feature fusion on dataset 1 and dataset 2, respectively. Furthermore, Table 3 present detailed values of the classification indexes for dataset 1 and dataset 2. It can be seen that ResNet101 + DenseNet121 attains optimal classification results on both datasets, with an accuracy of 99.18% on dataset 1 and 97.24% on dataset 2.

Figure 7 . Classification results of brain tumors on the test set of the dataset 1 (A) ResNet101 + DenseNet121 (B) ResNet101 + efficientNetB0 (C) DenseNet121 + EfficientNetB0.

Figure 8 . Classification results of brain tumors on the test set of the dataset 2 (A) ResNet101 + DenseNet121 (B) ResNet101 + efficientNetB0 (C) DenseNet121 + EfficientNetB0.

Table 3 . The classification results of feature fusion methods.
Figures 9A , B show the average evaluation metrics for brain tumor classification of every model on dataset 1 and dataset 2, respectively. On the dataset 1, from Figure 9A , it can be observed that the combination of ResNet101 and DenseNet121 (ResNet101 + DenseNet121) achieved the best classification accuracy, precision, recall, and F1-score, with values of 99.18, 99.07, 99.11, and 99.08%, respectively. Additionally, among the individual models, EfficientNetB0 exhibits the best classification results for brain tumor classification. Notably, DenseNet121 outperforms ResNet101 + EfficientNetB0 but is outperformed by both ResNet101 + DenseNet121 and DenseNet121 + EfficientNetB0. In Figure 9B (i.e., dataset 2), the ResNet101 + DenseNet121 model also achieves the best performance. However, among the individual models, DenseNet121 exhibits the best classification results, with accuracy, precision, recall, and F1-score of 97.24, 97.06, 97.58, and 97.28%, respectively. Unlike dataset 1, where DenseNet121 showed strong performance, it appears to have the weakest classification ability on the dataset 2. Conversely, ResNet101 + DenseNet121, ResNet101 + EfficientNetB0, and DenseNet121 + EfficientNetB0 all outperform the individual models. The experimental results validate the effectiveness of combining features from different models through feature fusion, thus providing a more reliable approach for brain tumor classification than relying on a single model. In addition, the average improvement of ResNet101 + DenseNet121 is 2.085% (dataset 1 is 2.61%, dataset 2 is 1.56%) and 1.32% (dataset 1 is 0.65%, dataset 2 is 1.99%) compared with ResNet101 and DenseNet121, respectively. Similarly, the accuracy improvement for ResNet101 + EfficientNetB0 is 1.035% (1.31% for dataset 1 and 0.76% for dataset 2) and 1.345% (1.47% for dataset 1 and 1.22% for dataset 2) compared with ResNet101and EfficientNetB0 alone. In comparison with Densenet121 and EfficientNetB0, the average accuracy improvement for DenseNet121 + EfficientNetB0 is 1.225% (0.61% for dataset 1 and 1.84% for data set 2) and 1.985% (2.28% for dataset 1 and 1.69% for dataset 2), respectively. The modeled results strongly support the efficacy of employing feature fusion in brain tumor classification. In addition, it is evident that ResNet101 achieves the most favorable classification results, while DenseNet121 yields the terrible results on dataset 2. But the classification effectiveness of ResNet101 + DenseNet121 surpasses that of ResNet101 + EfficientNetB0 and DenseNet121 + EfficientNetB0. This suggests that the combination of ResNet101 and DenseNet121 outperforms configurations involving EfficientNetB0. The possible reason for this phenomenon is the inferior feature matching effect of ResNet101 + EfficientNetB0 and DenseNet121 + EfficientNetB0 compared to ResNet101 + DenseNet121.

Figure 9 . Visualization of brain tumor classification metrics (A) dataset 1 (B) dataset 2.
A subject Receiver Operating Curve (ROC) is also utilized in the analysis process. It is a curve that illustrates the relationship between the true positive rate and the false positive rate. The size of the Area Under Curve (AUC) of the ROC curve indicates the strength of the model’s ability to differentiate between different types of tumors, with a larger AUC value indicating better classification performance. As shown in Figure 10 , the ROC curves of ResNet101 + DenseNet121 for the model are demonstrated and the values of AUC for the three types of brain tumors in dataset 1 are 0.9987, 0.9952, and 0.9999, respectively. In dataset 2, the values of AUC are 0.9991, 0.9971, 0.9999, and 0.9998, respectively.

Figure 10 . ROC curve of the model (A) dataset 1 (B) dataset 2.
4.2.3 Cross-dataset validation and robustness validation
Based on the foregoing, it is evident that the ResNet101 + DenseNet121 yields superior classification results across the two public datasets. This section aims to assess the robustness of ResNet101 + DenseNet121. To further assess the model’s robustness, a cross-data verification method was employed. The normal class in Dataset 2 was excluded, and data from the remaining three brain tumor classes were utilized to evaluate the dataset 1 trained model, ResNet101 + DenseNet121. The precision, recall, F1-score and accuracy of ResNet101 + DenseNet121 are verified to be 94.71, 94.44, 94.41, and 94.38%, respectively, which indicates its good robustness.
4.3 Discussion
There have been many studies on brain tumor classification. Among these methods, the key is the extracted features. Generally, there is a relationship between the effectiveness of the model and the amount of data. Whereas the acquisition of medical images is usually difficult and expensive. Transfer learning can take full advantage of its advantages on tasks with small datasets to improve model performance, accelerate the training process, and reduce the risk of overfitting. In addition, model integration is a technique that combines the prediction results of multiple independently trained models to obtain more powerful and robust global predictions, which can improve the upper limit of performance. In our work, the pre-trained model is used to extract the features of the image, and then the extracted features are fused using the model integration method of feature fusion to enhance the ability of the model.
From the previous analysis, it can be found that among the three fused models, ResNet101 + DenseNet121 achieves the best classification results. ResNet101 adopts the method of residual learning to construct residual blocks, which makes the network easier to train and reduces the problem of gradient vanishing. Densenet121, on the other hand, uses the idea of dense connectivity, where each layer’s input contains the output of all previous layers. This kind of connection is helpful to the transmission of information and the flow of gradients, and slows down the problem of information bottleneck. Dense connectivity also facilitates feature reuse. The features extracted by ResNet101 and those extracted by Densenet121 are fused to realize the complementary feature, which makes the feature more abundant and diversified, and thus achieves better classification effect. To demonstrate the effectiveness of the proposed method, we use the method of t-Distributed Stochastic Neighbor Embedding (t-SNE) to visualize the features extracted by the model ResNet101 + DenseNet121 trained on dataset 1, and the visualization results are shown in Figure 11 . The feature set of ResNet101 is shown in Figure 11A . It can be seen that some gliomas and meningiomas are nested with each other. The mean and standard deviation of the feature set are−0.0057 and 0.6141, respectively. The feature set of DenseNet121 is shown in Figure 11B , which shows that only a few gliomas and meningiomas are nested with each other. The mean and standard deviation of the feature set are 0.2323 and 0.652795, respectively. Figure 11C displays the feature set of ResNet101 + DenseNet121, indicating minimal nested classes. The mean and standard deviation of the feature set are 0.2267 and 0.9604, respectively. Additionally, the analysis shows that the standard deviation of the feature set of ResNet101 + Densenet121 is the highest, which also shows that ResNet101 + Densenet121 increases the uniqueness of extracting the image features of brain tumors and enhances the ability to distinguish brain tumors.

Figure 11 . Scatterplot of the feature set. (A) ResNet101 (B) DenseNet121 (C) ResNet101 + DenseNet121.
4.4 Comparison with other state of the art methods
We compared the classification results obtained in this study with those reported in the literature using the same dataset. The compared results shown in Table 4 demonstrate that our study achieved competitive classification performance when compared to the state-of-the-art approaches in the current literature.

Table 4 . Comparison with other state-of-the-art models.
5 Conclusion
This paper proposes a novel method for brain tumor classification, utilizing feature fusion to improve performance. Three advanced pre-trained models including ResNet101, DenseNet121, and EfficientNetB0, were selected as base models and adjusted to have the same output size (1,024, 7, 7). Brain tumor images were fed into these models to extract their respective features, and then feature fusion was achieved by pairwise combination of the models through feature summation. The fused features were subsequently used for the final classification. The method was validated on two publicly available datasets, and evaluation metrics such as accuracy, precision, recall, and F1-score were employed. Experimental Results indicated that the combination of ResNet101 and DenseNet121 (ResNet101 + DenseNet121) achieved the best classification results for both dataset 1 and dataset 2. On dataset 1, accuracy of 99.18%, precision of 99.07%, recall of 99.11%, and F1-score of 99.08% were achieved. For dataset 2, the corresponding metrics values including accuracy of 97.24%, precision of 97.06%, recall of 97.58%, and F1-score of 97.28% were obtained. Comparing our method with other state-of-the-art techniques, our approach exhibits superior classification performance. In the future, we plan to study two important works. On one hand, we will expand the experimentation by incorporating additional models to validate the effectiveness of feature fusion through summation for brain tumor classification. On the other hand, we aim to extend this method to encompass other brain diseases, thus enhancing the model’s capacity to recognize multiple classes of brain diseases.
Data availability statement
Publicly available datasets were analyzed in this study. This data can be found here: https://figshare.com/articles/dataset/brain_tumor_dataset/1512427 and https://www.kaggle.com/datasets/sartajbhuvaji/brain-tumor-classification-mri .
Author contributions
WC: Formal analysis, Software, Validation, Visualization, Writing – review & editing. XT: Software, Writing – original draft. JZ: Conceptualization, Investigation, Methodology, Project administration, Writing – original draft. GD: Investigation, Project administration, Visualization, Writing – review & editing. QF: Validation, Writing – review & editing. HJ: Investigation, Methodology, Writing – review & editing.
The author(s) declare financial support was received for the research, authorship, and/or publication of this article. This work was supported by Major Science and Technology Projects of Henan Province (Grant No. 221100210500), the Foundation of Henan Educational Committee (No. 24A320004), the Medical and Health Research Project in Luoyang (Grant No. 2001027A), and the Construction Project of Improving Medical Service Capacity of Provincial Medical Institutions in Henan Province (Grant No. 2017-51).
Conflict of interest
The authors declare that the research was conducted in the absence of any commercial or financial relationships that could be construed as a potential conflict of interest.
Publisher’s note
All claims expressed in this article are solely those of the authors and do not necessarily represent those of their affiliated organizations, or those of the publisher, the editors and the reviewers. Any product that may be evaluated in this article, or claim that may be made by its manufacturer, is not guaranteed or endorsed by the publisher.
Alanazi, M. F., Ali, M. U., Hussain, S. J., Zafar, A., Mohatram, M., Irfan, M., et al. (2022). Brain tumor/mass classification framework using magnetic-resonance-imaging-based isolated and developed transfer deep-learning model. Sensors 22:372. doi: 10.3390/s22010372
PubMed Abstract | Crossref Full Text | Google Scholar
Aljuaid, H., Alturki, N., Alsubaie, N., Cavallaro, L., and Liotta, A. (2022). Computer-aided diagnosis for breast cancer classification using deep neural networks and transfer learning. Comput. Methods Prog. Biomed. 223:106951. doi: 10.1016/j.cmpb.2022.106951
Crossref Full Text | Google Scholar
Alturki, N., Umer, M., Ishaq, A., Abuzinadah, N., Alnowaiser, K., Mohamed, A., et al. (2023). Combining CNN features with voting classifiers for optimizing performance of brain tumor classification. Cancers 15:1767. doi: 10.3390/cancers15061767
Alyami, J., Rehman, A., Almutairi, F., Fayyaz, A. M., Roy, S., Saba, T., et al. (2023). Tumor localization and classification from MRI of brain using deep convolution neural network and Salp swarm algorithm. Cogn. Comput. doi: 10.1007/s12559-022-10096-2
Arora, G., Dubey, A. K., Jaffery, Z. A., and Rocha, A. (2023). A comparative study of fourteen deep learning networks for multi skin lesion classification (MSLC) on unbalanced data. Neural Comput. & Applic. 35, 7989–8015. doi: 10.1007/s00521-022-06922-1
Bhuvaji, S., Kadam, A., Bhumkar, P., Dedge, S, and Kanchan, S. (2020). Brain Tumor Classification (MRI)Available at: https://www.kaggle.com/sartajbhuvaji/brain-tumor-classification-m . Accessed August, 1 2020
Google Scholar
Cao, X., Yao, B., Chen, B., Sun, W., and Tan, G. (2021). Automatic seizure classification based on domain-invariant deep representation of EEG. Front. Neurosci. 15:760987. doi: 10.3389/fnins.2021.760987
Chan, H.-P., Hadjiiski, L. M., and Samala, R. K. (2020). Computer-aided diagnosis in the era of deep learning. Med. Phys. 47, e218–e227. doi: 10.1002/mp.13764
Cheng, J., Huang, W., Cao, S., Yang, R., Yang, W., Yun, Z., et al. (2015). Enhanced performance of brain tumor classification via tumor region augmentation and partition. PLoS One 10:e0140381. doi: 10.1371/journal.pone.0140381
Deepak, S., and Ameer, P. M. (2021). Automated Categorization of Brain Tumor from MRI Using CNN features and SVM. J. Ambient. Intell. Human Comput. 12, 8357–8369. doi: 10.1007/s12652-020-02568-w
Demir, F., and Akbulut, Y. (2022). A new deep technique using R-CNN model and L1NSR feature selection for brain MRI classification. Biomed. Signal Process. Control 75:103625. doi: 10.1016/j.bspc.2022.103625
Fujita, H. (2020). AI-based computer-aided diagnosis (AI-CAD): the latest review to read first. Radiol. Phys. Technol. 13, 6–19. doi: 10.1007/s12194-019-00552-4
Ghassemi, N., Shoeibi, A., and Rouhani, M. (2020). Deep neural network with generative adversarial networks pre-training for brain tumor classification based on MR images. Biomed. Signal Process. Control 57:101678. doi: 10.1016/j.bspc.2019.101678
Gu, X., Shen, Z., Xue, J., Fan, Y., and Ni, T. (2021). Brain tumor MR image classification using convolutional dictionary learning with local constraint. Front. Neurosci. 15:679847. doi: 10.3389/fnins.2021.679847
Gudigar, A., Raghavendra, U., Hegde, A., Kalyani, M., Kalyani, M., Ciaccio, E. J., et al. (2020). Brain pathology identification using computer aided diagnostic tool: a systematic review. Comput. Methods Prog. Biomed. 187:105205. doi: 10.1016/j.cmpb.2019.105205
Gumaei, A., Hassan, M. M., Hassan, M. R., Alelaiwi, A., and Fortino, G. (2019). A hybrid feature extraction method with regularized extreme learning machine for brain tumor classification. IEEE Access 7, 36266–36273. doi: 10.1109/ACCESS.2019.2904145
Hammad, M., ElAffendi, M., Ateya, A. A., and El-Latif, A. A. A. (2023). Efficient brain tumor detection with lightweight end-to-end deep learning model. Can. Underwrit. 15:2837. doi: 10.3390/cancers15102837
He, K., Zhang, X., Ren, S., and Sun, J. (2016). Deep residual learning for image recognition. 2016 IEEE Conference on Computer Vision and Pattern Recognition (CVPR), 770–778. Las Vegas, NV, USA
Hossain, S., Chakrabarty, A., Gadekallu, T. R., Alazab, M., and Piran, M. J. (2023). Vision transformers, ensemble model, and transfer learning leveraging explainable AI for brain tumor detection and classification. IEEE J. Biomed. Health Inform. 99, 1–14. doi: 10.1109/JBHI.2023.3266614
Huang, G., Liu, Z., Van Der Maaten, L., and Weinberger, K. Q. (2017). Densely connected convolutional networks. IEEE Conf. Comp. Vision Pattern Recog. 2017, 2261–2269. doi: 10.1109/CVPR.2017.243
Kang, J., Ullah, Z., and Gwak, J. (2021). MRI-based brain tumor classification using Ensemble of Deep Features and Machine Learning Classifiers. Sensors 21:2222. doi: 10.3390/s21062222
Kumar, R. L., Kakarla, J., Isunuri, B. V., and Singh, M. (2021). Multi-class brain tumor classification using residual network and global average pooling. Multimed. Tools Appl. 80, 13429–13438. doi: 10.1007/s11042-020-10335-4
Lin, Y., Xiao, Y., Wang, L., Guo, Y., Zhu, W., Dalip, B., et al. (2022). Experimental exploration of objective human pain assessment using multimodal sensing signals. Front. Neurosci. 16:831627. doi: 10.3389/fnins.2022.831627
Liu, L., Chang, J., Zhang, P., Qiao, H., and Xiong, S. (2023). SASG-GCN: self-attention similarity guided graph convolutional network for multi-type lower-grade glioma classification. IEEE J. Biomed. Health Inform. 27, 3384–3395. doi: 10.1109/JBHI.2023.3264564
Maurya, S., Tiwari, S., Mothukuri, M. C., Tangeda, C. M., Nandigam, R. N. S., and Addagiri, D. C. (2023). A review on recent developments in cancer detection using machine learning and deep learning models. Biomed. Signal Process. Control 80:104398. doi: 10.1016/j.bspc.2022.104398
Muhammad, K., Khan, S., Ser, J. D., and Albuquerque, V. H. C. D. (2021). Deep learning for multigrade brain tumor classification in smart healthcare systems: A prospective survey. IEEE Trans. Neural Netw. Learn. Syst. 32, 507–522. doi: 10.1109/TNNLS.2020.2995800
Nanda, A., Barik, R. C., and Bakshi, S. (2023). SSO-RBNN driven brain tumor classification with saliency-K-means segmentation technique. Biomed. Signal Process. Control 81:104356. doi: 10.1016/j.bspc.2022.104356
Nirmalapriya, G., Agalya, V., Regunathan, R., and Belsam Jeba Ananth, M. (2023). Fractional Aquila spider monkey optimization based deep learning network for classification of brain tumor. Biomed. Signal Process. Control 79:104017. doi: 10.1016/j.bspc.2022.104017
Öksüz, C., Urhan, O., and Güllü, M. K. (2022). Brain tumor classification using the fused features extracted from expanded tumor region. Biomed. Signal Process. Control 72:103356. doi: 10.1016/j.bspc.2021.103356
Özyurt, F., Sert, E., Avci, E., and Dogantekin, E. (2019). Brain tumor detection based on convolutional neural network with neutrosophic expert maximum fuzzy sure entropy. Measurement 147:106830. doi: 10.1016/j.measurement.2019.07.058
Ren, W., Hasanzade Bashkandi, A., Afshar Jahanshahi, J., AlHamad A, Q. M., Javaheri, D., and Mohammadi, M. (2023). Brain tumor diagnosis using a step-by-step methodology based on courtship learning-based water strider algorithm. Biomed. Signal Process. Control 83:104614. doi: 10.1016/j.bspc.2023.104614
Satyanarayana, G. (2023). A mass correlation based deep learning approach using deep convolutional neural network to classify the brain tumor. Biomed. Signal Process. Control 81:104395. doi: 10.1016/j.bspc.2022.104395
Saurav, S., Sharma, A., Saini, R., and Singh, S. (2023). An attention-guided convolutional neural network for automated classification of brain tumor from MRI. Neural Comput. Applic. 35, 2541–2560. doi: 10.1007/s00521-022-07742-z
Sekhar, A., Biswas, S., Hazra, R., Sunaniya, A. K., Mukherjee, A., and Yang, L. (2022). Brain tumor classification using fine-tuned GoogLeNet features and machine learning algorithms: IoMT enabled CAD system. IEEE J. Biomed. Health Inform. 26, 983–991. doi: 10.1109/JBHI.2021.3100758
Shah, H. A., Saeed, F., Yun, S., Park, J.-H., Paul, A., and Kang, J.-M. (2022). A robust approach for brain tumor detection in magnetic resonance images using Finetuned EfficientNet. IEEE Access 10, 65426–65438. doi: 10.1109/ACCESS.2022.3184113
Sharif, M. I., Li, J. P., Khan, M. A., and Saleem, M. A. (2020). Active Deep Neural Network Features Selection for Segmentation and Recognition of Brain Tumors Using MRI Images. Pattern Recognit. Lett. 129, 181–189. doi: 10.1016/j.patrec.2019.11.019
Swati, Z. N. K., Zhao, Q., Kabir, M., Ali, F., Ali, Z., Ahmed, S., et al. (2019). Brain tumor classification for MR images using transfer learning and fine-tuning. Comput. Med. Imaging Graph. 75, 34–46. doi: 10.1016/j.compmedimag.2019.05.001
Tan, M., and Le, Q. V. (2019). EfficientNet: rethinking model scaling for convolutional Neural Networks. International Conference on Machine Learning. 97. Long Beach, CA.
Tandel, G. S., Tiwari, A., and Kakde, O. G. (2021). Performance optimisation of deep learning models using majority voting algorithm for brain tumour classification. Comput. Biol. Med. 135:104564. doi: 10.1016/j.compbiomed.2021.104564
Yang, J. (2022). Prediction of HER2-positive breast cancer recurrence and metastasis risk from histopathological images and clinical information via multimodal deep learning. Comput. Struct. Biotechnol. J. 20, 333–342. doi: 10.1016/j.csbj.2021.12.028
Yang, Y., Yan, L.-F., Zhang, X., Han, Y., Nan, H.-Y., Hu, Y.-C., et al. (2018). Glioma grading on conventional MR images: A deep learning study with transfer learning. Front. Neurosci. 12:804. doi: 10.3389/fnins.2018.00804
Yao, P., Shen, S., Xu, M., Liu, P., Zhang, F., Xing, J., et al. (2022). Single model deep learning on imbalanced small datasets for skin lesion classification. IEEE Trans. Med. Imaging 41, 1242–1254. doi: 10.1109/TMI.2021.3136682
Yeung, M., Sala, E., Schönlieb, C.-B., and Rundo, L. (2022). Unified focal loss: generalising dice and cross entropy-based losses to handle class imbalanced medical image segmentation. Comput. Med. Imaging Graph. 95:102026. doi: 10.1016/j.compmedimag.2021.102026
Yu, X., Wang, J., Hong, Q.-Q., Teku, R., Wang, S.-H., and Zhang, Y.-D. (2022). Transfer learning for medical images analyses: A survey. Neurocomputing 489, 230–254. doi: 10.1016/j.neucom.2021.08.159
Zhang, J., Tan, X., Chen, W., Du, G., Fu, Q., Zhang, H., et al. (2023). EFF_D_SVM: a robust multi-type brain tumor classification system. Front. Neurosci. 17:1269100. doi: 10.3389/fnins.2023.1269100
Zolfaghari, B., Mirsadeghi, L., Bibak, K., and Kavousi, K. (2023). Supplementary materials for: cancer prognosis and diagnosis methods based on ensemble learning. ACM Comput. Surv. 55, 1–34. doi: 10.1145/3580218
Zulfiqar, F., Ijaz Bajwa, U., and Mehmood, Y. (2023). Multi-class classification of brain tumor types from MR images using EfficientNets. Biomed. Signal Process. Control 84:104777. doi: 10.1016/j.bspc.2023.104777
Keywords: brain tumor classification, deep learning, transfer learning, ResNet101, DenseNet121, EfficientNetB0, feature fusion
Citation: Chen W, Tan X, Zhang J, Du G, Fu Q and Jiang H (2024) A robust approach for multi-type classification of brain tumor using deep feature fusion. Front. Neurosci . 18:1288274. doi: 10.3389/fnins.2024.1288274
Received: 04 September 2023; Accepted: 05 February 2024; Published: 19 February 2024.
Reviewed by:
Copyright © 2024 Chen, Tan, Zhang, Du, Fu and Jiang. This is an open-access article distributed under the terms of the Creative Commons Attribution License (CC BY) . The use, distribution or reproduction in other forums is permitted, provided the original author(s) and the copyright owner(s) are credited and that the original publication in this journal is cited, in accordance with accepted academic practice. No use, distribution or reproduction is permitted which does not comply with these terms.
*Correspondence: Wenna Chen, [email protected] ; Hongwei Jiang, [email protected]
Disclaimer: All claims expressed in this article are solely those of the authors and do not necessarily represent those of their affiliated organizations, or those of the publisher, the editors and the reviewers. Any product that may be evaluated in this article or claim that may be made by its manufacturer is not guaranteed or endorsed by the publisher.
Help | Advanced Search
Electrical Engineering and Systems Science > Image and Video Processing
Title: brain tumor mri classification using a novel deep residual and regional cnn.
Abstract: Brain tumor classification is crucial for clinical analysis and an effective treatment plan to cure patients. Deep learning models help radiologists to accurately and efficiently analyze tumors without manual intervention. However, brain tumor analysis is challenging because of its complex structure, texture, size, location, and appearance. Therefore, a novel deep residual and regional-based Res-BRNet Convolutional Neural Network (CNN) is developed for effective brain tumor (Magnetic Resonance Imaging) MRI classification. The developed Res-BRNet employed Regional and boundary-based operations in a systematic order within the modified spatial and residual blocks. Moreover, the spatial block extract homogeneity and boundary-defined features at the abstract level. Furthermore, the residual blocks employed at the target level significantly learn local and global texture variations of different classes of brain tumors. The efficiency of the developed Res-BRNet is evaluated on a standard dataset; collected from Kaggle and Figshare containing various tumor categories, including meningioma, glioma, pituitary, and healthy images. Experiments prove that the developed Res-BRNet outperforms the standard CNN models and attained excellent performances (accuracy: 98.22%, sensitivity: 0.9811, F-score: 0.9841, and precision: 0.9822) on challenging datasets. Additionally, the performance of the proposed Res-BRNet indicates a strong potential for medical image-based disease analyses.
Submission history
Access paper:.
- Other Formats
References & Citations
- Google Scholar
- Semantic Scholar
BibTeX formatted citation
Bibliographic and Citation Tools
Code, data and media associated with this article, recommenders and search tools.
- Institution
arXivLabs: experimental projects with community collaborators
arXivLabs is a framework that allows collaborators to develop and share new arXiv features directly on our website.
Both individuals and organizations that work with arXivLabs have embraced and accepted our values of openness, community, excellence, and user data privacy. arXiv is committed to these values and only works with partners that adhere to them.
Have an idea for a project that will add value for arXiv's community? Learn more about arXivLabs .
Deep CNN for Brain Tumor Classification
- Published: 06 January 2021
- Volume 53 , pages 671–700, ( 2021 )
Cite this article
- Wadhah Ayadi ORCID: orcid.org/0000-0002-8516-763X 1 ,
- Wajdi Elhamzi 2 , 3 ,
- Imen Charfi 3 &
- Mohamed Atri 4
5105 Accesses
137 Citations
Explore all metrics
Brain tumor represents one of the most fatal cancers around the world. It is common cancer in adults and children. It has the lowest survival rate and various types depending on their location, texture, and shape. The wrong classification of the tumor brain will lead to bad consequences. Consequently, identifying the correct type and grade of tumor in the early stages has an important role to choose a precise treatment plan. Examining the magnetic resonance imaging (MRI) images of the patient’s brain represents an effective technique to distinguish brain tumors. Due to the big amounts of data and the various brain tumor types, the manual technique becomes time-consuming and can lead to human errors. Therefore, an automated computer assisted diagnosis (CAD) system is required. The recent evolution in image classification techniques has shown great progress especially the deep convolution neural networks (CNNs) which have succeeded in this area. In this regard, we exploited CNN for the problem of brain tumor classification. We suggested a new model, which contains various layers in the aim to classify MRI brain tumor. The proposed model is experimentally evaluated on three datasets. Experimental results affirm that the suggested approach provides a convincing performance compared to existing methods.
This is a preview of subscription content, log in via an institution to check access.
Access this article
Price includes VAT (Russian Federation)
Instant access to the full article PDF.
Rent this article via DeepDyve
Institutional subscriptions
Brain tumor detection and classification using machine learning: a comprehensive survey
Javaria Amin, Muhammad Sharif, … Ramesh Sundar Nayak

Machine learning and deep learning approach for medical image analysis: diagnosis to detection
Meghavi Rana & Megha Bhushan

Convolutional neural networks: an overview and application in radiology
Rikiya Yamashita, Mizuho Nishio, … Kaori Togashi
Razzak MI, Imran M, Xu G (2018) Efficient brain tumor segmentation with multiscale two-pathway-group conventional neural networks. IEEE J Biomed Health Inform 23(5):1911–1919
Google Scholar
Siegel RL, Miller KD (2017) Jemal ACancer statistics, 2017. CA Cancer J Clin 67(1):7–30
Zhang Y, Li A, Peng C, Wang M (2016) Improve glioblastoma multiforme prognosis prediction by using feature selection and multiple kernel learning. IEEE/ACM Trans Comput Biol Bioinform 13(5):825–835
Yang Y, Yan LF, Zhang X, Han Y, Nan HY, Hu YC, Ge XW (2018) Glioma grading on conventional MR images: a deep learning study with transfer learning. Front Neurosci 12:804
Talo M, Baloglu UB, Yıldırım Ö, Acharya UR (2019) Application of deep transfer learning for automated brain abnormality classification using MR images. Cogn Syst Res 54:176–188
Kaur T, Saini BS, Gupta S (2017) Quantitative metric for MR brain tumour grade classification using sample space density measure of analytic intrinsic mode function representation. IET Image Process 11(8):620–632
Usman K, Rajpoot K (2017) Brain tumor classification from multi-modality MRI using wavelets and machine learning. Pattern Anal Appl 20(3):871–881
MathSciNet Google Scholar
Anitha V, Murugavalli SJICV (2016) Brain tumour classification using two-tier classifier with adaptive segmentation technique. IET Comput Vis 10(1):9–17
El-Dahshan ESA, Mohsen HM, Revett K, Salem ABM (2014) Computer-aided diagnosis of human brain tumor through MRI: a survey and a new algorithm. Expert Syst Appl 41(11):5526–5545
Hemanth DJ, Anitha J, Naaji A, Geman O, Popescu DE (2018) A modified deep convolutional neural network for abnormal brain image classification. IEEE Access 7:4275–4283
Liu Y, Stojadinovic S, Hrycushko B, Wardak Z, Lau S, Lu W, Nedzi L (2017) A deep convolutional neural network-based automatic delineation strategy for multiple brain metastases stereotactic radiosurgery. PloS ONE 12(10):e0185844
Qiu Y, Yan S, Gundreddy RR, Wang Y, Cheng S, Liu H, Zheng B (2017) A new approach to develop computer-aided diagnosis scheme of breast mass classification using deep learning technology. J Xray Sci Technol 25(5):751–763
Sutskever I, Martens J, Hinton G (2011) Generating text with recurrent neural networks. In: Proceedings of the 28th international conference on machine learning, Bellevue, pp 1017–1024
Taigman Y, Yang M, Ranzato MA, Wolf L (2014) Deepface: closing the gap to human-level performance in face verification. In: Proceedings of the IEEE conference on computer vision and pattern recognition, pp 1701–1708
Karpathy A, Fei-Fei L (2015) Deep visual-semantic alignments for generating image descriptions. In: Proceedings of the IEEE conference on computer vision and pattern recognition, pp 3128–3137
Silver D, Huang A, Maddison CJ, Guez A, Sifre L, Van Den Driessche G, Dieleman S (2016) Mastering the game of Go with deep neural networks and tree search. Nature 529(7587):484–489
Russakovsky O, Deng J, Su H, Krause J, Satheesh S, Ma S, Berg AC (2015) Imagenet large scale visual recognition challenge. IJCV 115(3):211–252
Yousefi M, Krzyżak A, Suen CY (2018) Mass detection in digital breast tomosynthesis data using convolutional neural networks and multiple instance learning. Comput Biol Med 96:283–293
Gu Y, Lu X, Yang L, Zhang B, Yu D, Zhao Y, Zhou T (2018) Automatic lung nodule detection using a 3D deep convolutional neural network combined with a multi-scale prediction strategy in chest CTs. Comput Biol Med 103:220–231
Charron O, Lallement A, Jarnet D, Noblet V, Clavier JB, Meyer P (2018) Automatic detection and segmentation of brain metastases on multimodal MR images with a deep convolutional neural network. Comput Biol Med 95:43–54
Shao L, Zhu F, Li X (2014) Transfer learning for visual categorization: a survey. IEEE Trans Neural Netw Learn Syst 26(5):1019–1034
Kleesiek J, Urban G, Hubert A, Schwarz D, Maier-Hein K, Bendszus M, Biller A (2016) Deep MRI brain extraction: a 3D convolutional neural network for skull stripping. NeuroImage 129:460–469
Tajbakhsh N, Shin JY, Gurudu SR, Hurst RT, Kendall CB, Gotway MB, Liang J (2016) Convolutional neural networks for medical image analysis: full training or fine tuning? IEEE Trans Med Imaging 35(5):1299–1312
Chen H, Qi X, Cheng JZ, Heng PA (2016) Deep contextual networks for neuronal structure segmentation. In: Proceedings of the 13th AAAI conference on artificial intelligence, pp 1167–1173
Litjens G, Kooi T, Bejnordi BE, Setio AAA, Ciompi F, Ghafoorian M, Sánchez CI (2017) A survey on deep learning in medical image analysis. Med Image Anal 42:60–88
Deniz E, Şengür A, Kadiroğlu Z, Guo Y, Bajaj V, Budak Ü (2018) Transfer learning based histopathologic image classification for breast cancer detection. Health Inf Sci Syst 6(1):18
Cheng J, Huang W, Cao S, Yang R, Yang W, Yun Z, Feng Q (2015) Enhanced performance of brain tumor classification via tumor region augmentation and partition. PloS ONE 10(10):e0140381
Ismael MR, Abdel-Qader I (2018) Brain tumor classification via statistical features and back-propagation neural network. In: 2018 IEEE international conference on electro/information technology (EIT), pp 0252–0257
Tahir B, Iqbal S, Usman Ghani Khan M, Saba T, Mehmood Z, Anjum A, Mahmood T (2019) Feature enhancement framework for brain tumor segmentation and classification. Microsc Res Tech 82(6):803–811
Yu J, Tan M, Zhang H, Tao D, Rui Y (2019) Hierarchical deep click feature prediction for fine-grained image recognition. IEEE Trans Pattern Anal Mach Intell
Yu J, Li J, Yu Z, Huang Q (2019) Multimodal transformer with multi-view visual representation for image captioning. IEEE Trans Circuits Syst Video Technol 30(12):4467–4480
Yu J, Yao J, Zhang J, Yu Z, Tao D (2020) SPRNet: single-pixel reconstruction for one-stage instance segmentation. IEEE Trans Cybern. https://doi.org/10.1109/TCYB.2020.2969046
Article Google Scholar
Paul JS, Plassard AJ, Landman BA, Fabbri D (2017) Deep learning for brain tumor classification. In: Proc. SPIE, vol 10137. pp 1–16
Afshar P, Mohammadi A, Plataniotis KN (2018) Brain tumor type classification via capsule networks. In: 2018 25th IEEE international conference on image processing (ICIP), pp 3129–3133
Zhou Y, Li Z, Zhu H, Chen C, Gao M, Xu K, Xu J (2018) Holistic brain tumor screening and classification based on densenet and recurrent neural network. In: International MICCAI Brainlesion workshop. Springer, pp 208–217
Pashaei A, Sajedi H, Jazayeri N (2018) Brain tumor classification via convolutional neural network and extreme learning machines. In: 2018 8th International conference on computer and knowledge engineering (ICCKE), pp 314–319
Abiwinanda N, Hanif M, Hesaputra ST, Handayani A, Mengko TR (2019) Brain tumor classification using convolutional neural network. In: World congress on medical physics and biomedical engineering 2018. Springer, Singapore, pp 183–189
Ghassemi N, Shoeibi A, Rouhani M (2020) Deep neural network with generative adversarial networks pre-training for brain tumor classification based on MR images. Biomed Signal Process Control 57:101678
Wu B, Liu Y, Lang B, Huang L (2018) Dgcnn: disordered graph convolutional neural network based on the gaussian mixture model. Neurocomputing 321:346–356
Shi H, Zhang Y, Zhang Z, Ma N, Zhao X, Gao Y, Sun J (2018) Hypergraph-induced convolutional networks for visual classification. IEEE Trans Neural Netw Learn Syst 30(10):2963–2972
Fu S, Liu W, Tao D, Zhou Y, Nie L (2020) HesGCN: Hessian graph convolutional networks for semi-supervised classification. Inf Sci 514:484–498
Fu S, Liu W, Zhou Y, Nie L (2019) HpLapGCN: hypergraph p-Laplacian graph convolutional networks. Neurocomputing 362:166–174
Khan N, Chaudhuri U, Banerjee B, Chaudhuri S (2019) Graph convolutional network for multi-label VHR remote sensing scene recognition. Neurocomputing 357:36–46
Sichao F, Weifeng L, Shuying L, Yicong Z (2019) Two-order graph convolutional networks for semi-supervised classification. IET Image Process 13(14):2763–2771
Hemanth DJ, Vijila CKS, Selvakumar AI, Anitha J (2014) Performance improved iteration-free artificial neural networks for abnormal magnetic resonance brain image classification. Neurocomputing 130:98–107
Liu YH, Muftah M, Das T, Bai L, Robson K, Auer D (2012) Classification of MR tumor images based on Gabor wavelet analysis. J Med Biol Eng 32(1):22–28
Sajjad M, Khan S, Muhammad K, Wu W, Ullah A, Baik SW (2019) Multi-grade brain tumor classification using deep CNN with extensive data augmentation. J Comput Sci 30:174–182
Sachdeva J, Kumar V, Gupta I, Khandelwal N, Ahuja CK (2016) A package-SFERCB-“Segmentation, feature extraction, reduction and classification analysis by both SVM and ANN for brain tumors”. Appl Soft Comput 47:151–167
Jun Cheng (2017) Brain Tumor Dataset (Version 5). Retrieved from https://doi.org/10.6084/m9.figshare.1512427.v5
Pinaya WH, Gadelha A, Doyle OM, Noto C, Zugman A, Cordeiro Q, Sato JR (2016) Using deep belief network modelling to characterize differences in brain morphometry in schizophrenia. Sci Rep 6:38897
Padole H, Joshi SD, Gandhi TK (2020) Graph wavelet-based multilevel graph coarsening and its application in graph-CNN for alzheimer’s disease detection. IEEE Access 8:60906–60917
Song TA, Chowdhury SR, Yang F, Jacobs H, El Fakhri G, Li Q, Dutta J (2019) Graph convolutional neural networks for alzheimer’s disease classification. In: Proceedings IEEE 16th Int. Symp. Biomed. Imag (ISBI), pp 414–417
Guo J, Qiu W, Li X, Zhao X, Guo N, Li Q (2019) Predicting alzheimer’s disease by hierarchical graph convolution from positron emission tomography imaging. In: 2019 IEEE international conference on big data (big data), pp 5359–5363
O’Shea K, Nash R (2015) An introduction to convolutional neural networks. CoRR arXiv:1511.08458
Ayadi W, Elhamzi W, Charfi I, Atri M (2019) A hybrid feature extraction approach for brain MRI classification based on Bag-of-words. Biomed Signal Process Control 48:144–152
Shang R, He J, Wang J, Xu K, Jiao L, Stolkin R (2020) Dense connection and depthwise separable convolution based CNN for polarimetric SAR image classification. Knowl. Based Syst 105542
Yang C, Hou B, Ren B, Hu Y, Jiao L (2019) CNN-based polarimetric decomposition feature selection for PolSAR image classification. IEEE Trans Geosci Remote Sens 57(11):8796–8812
Li B, Zhang H, Luo H, Tan S (2019) Detecting double JPEG compression and its related anti-forensic operations with CNN. Multimed Tools Appl 78(7):8577–8601
Lei X, Pan H, Huang X (2019) A dilated CNN model for image classification. IEEE Access 7:124087–124095
Li G, Li N (2019) Customs classification for cross-border e-commerce based on text-image adaptive convolutional neural network. Electron Commer Res 19(4):779–800
Sundararajan SK, Sankaragomathi B, Priya DS (2019) Deep belief CNN feature representation based content based image retrieval for medical images. Med Syst 43(6):174
Wu XY (2019) A hand gesture recognition algorithm based on DC-CNN. Multimed Tools Appl 79(13–14):9193–9205
Swati ZNK, Zhao Q, Kabir M, Ali F, Ali Z, Ahmed S, Lu J (2019) Content-based brain tumor retrieval for MR images using transfer learning. IEEE Access 7:17809–17822
Huang M, Yang W, Wu Y, Jiang J, Gao Y, Chen Y, Lu Z (2014) Content-based image retrieval using spatial layout information in brain tumor T1-weighted contrast-enhanced MR images. PLoS ONE 9(7):e102754
Radiopaedia. https://radiopaedia.org/
Zhang YD, Dong Z, Chen X, Jia W, Du S, Muhammad K, Wang SH (2019) Image based fruit category classification by 13-layer deep convolutional neural network and data augmentation. Multimed Tools Appl 78(3):3613–3632
Clark K, Vendt B, Smith K, Freymann J, Kirby J, Koppel P, Tarbox L (2013) The cancer imaging archive (TCIA): maintaining and operating a public information repository. J Digit Imaging 26(6):1045–1057
Goodfellow I, Bengio Y, Courville A (2016) Deep learning. MIT Press, Cambridge
MATH Google Scholar
Hossin M, Sulaiman MN (2015) A review on evaluation metrics for data classification evaluations. Int J Data Min Knowl Manag Process 5(2):01–11
Afshar P, Plataniotis KN, Mohammadi A (2019) Capsule networks for brain tumor classification based on MRI images and coarse tumor boundaries. In: ICASSP 2019–2019 IEEE international conference on acoustics, speech and signal processing (ICASSP), pp 1368–1372
Anaraki AK, Ayati M, Kazemi F (2019) Magnetic resonance imaging-based brain tumor grades classification and grading via convolutional neural networks and genetic algorithms. Biocybern Biomed Eng 39(1):63–74
Tandel GS, Balestrieri A, Jujaray T, Khanna NN, Saba L, Suri JS (2020) Multiclass magnetic resonance imaging brain tumor classification using artificial intelligence paradigm. Comput Biol Med 122:103804
Download references
Author information
Authors and affiliations.
Laboratory of Electronics and Microelectronics, University of Monastir, Monastir, Tunisia
Wadhah Ayadi
College of Computer Engineering and Sciences, Prince Sattam Bin Abdulaziz University, Al-Kharj, Saudi Arabia
Wajdi Elhamzi
Higher School of Sciences and Technology of Hammam Sousse, University of Sousse, Sousse, Tunisia
Wajdi Elhamzi & Imen Charfi
College of Computer Science, King Khalid University, Abha, Saudi Arabia
Mohamed Atri
You can also search for this author in PubMed Google Scholar
Corresponding author
Correspondence to Wajdi Elhamzi .
Additional information
Publisher's note.
Springer Nature remains neutral with regard to jurisdictional claims in published maps and institutional affiliations.
Rights and permissions
Reprints and permissions
About this article
Ayadi, W., Elhamzi, W., Charfi, I. et al. Deep CNN for Brain Tumor Classification. Neural Process Lett 53 , 671–700 (2021). https://doi.org/10.1007/s11063-020-10398-2
Download citation
Accepted : 27 November 2020
Published : 06 January 2021
Issue Date : February 2021
DOI : https://doi.org/10.1007/s11063-020-10398-2
Share this article
Anyone you share the following link with will be able to read this content:
Sorry, a shareable link is not currently available for this article.
Provided by the Springer Nature SharedIt content-sharing initiative
- Deep learning
- Brain tumor
- Classification
- Find a journal
- Publish with us
- Track your research

An official website of the United States government
The .gov means it’s official. Federal government websites often end in .gov or .mil. Before sharing sensitive information, make sure you’re on a federal government site.
The site is secure. The https:// ensures that you are connecting to the official website and that any information you provide is encrypted and transmitted securely.
- Publications
- Account settings
Preview improvements coming to the PMC website in October 2024. Learn More or Try it out now .
- Advanced Search
- Journal List
Brain Tumor Analysis Empowered with Deep Learning: A Review, Taxonomy, and Future Challenges
Muhammad waqas nadeem.
1 Department of Computer Science, Lahore Garrison University, Lahore 54000, Pakistan; kp.ude.ugl@nahknandam (M.A.K.); [email protected] (K.M.K.)
2 Department of Computer Science, School of Systems and Technology, University of Management and Technology, Lahore 54000, Pakistan; [email protected]
Mohammed A. Al Ghamdi
3 Department of Computer Science, Umm Al-Qura University, Makkah 23500, Saudi Arabia; as.ude.uqu@idmahgeam (M.A.A.G.); as.ude.uqu@iritomhs (S.H.A.)
Muzammil Hussain
Muhammad adnan khan, khalid masood khan, sultan h. almotiri, suhail ashfaq butt.
4 Department of Information Sciences, Division of Science and Technology, University of Education Township, Lahore 54700, Pakistan; [email protected]
Deep Learning (DL) algorithms enabled computational models consist of multiple processing layers that represent data with multiple levels of abstraction. In recent years, usage of deep learning is rapidly proliferating in almost every domain, especially in medical image processing, medical image analysis, and bioinformatics. Consequently, deep learning has dramatically changed and improved the means of recognition, prediction, and diagnosis effectively in numerous areas of healthcare such as pathology, brain tumor, lung cancer, abdomen, cardiac, and retina. Considering the wide range of applications of deep learning, the objective of this article is to review major deep learning concepts pertinent to brain tumor analysis (e.g., segmentation, classification, prediction, evaluation.). A review conducted by summarizing a large number of scientific contributions to the field (i.e., deep learning in brain tumor analysis) is presented in this study. A coherent taxonomy of research landscape from the literature has also been mapped, and the major aspects of this emerging field have been discussed and analyzed. A critical discussion section to show the limitations of deep learning techniques has been included at the end to elaborate open research challenges and directions for future work in this emergent area.
1. Introduction
The advancement in medical technologies helps the clinical experts to facilitate more efficient e-health care systems to the patients. There is a number of medical domains where e-health care systems are beneficial [ 1 ]. Computer vision-based applications of biomedical imaging are gaining more importance as they provide recognition information to the radiologist for batter treatment-related problems. Different medical imaging techniques and methods that include X-ray, Magnetic Resonance Imaging (MRIs), Ultrasound, and Computed Tomography (CT), have a great influence on the diagnosis and treatment process of patients [ 2 , 3 ].
The formation of abnormal groups of cells inside the brain or near it leads to the initialization of a brain tumor. The abnormal cells abrupt the processing of the brain and affect the health of a patient [ 4 ]. Brain imaging analysis, diagnosis, and treatment with adopted medical imaging techniques are the main focus of research for the researcher, radiologist and clinical experts [ 5 ]. The analysis of brain images is considered imperative because diseases of the brain called brain tumors are fatal and responsible for a large number of deaths in developed countries; for instance, according to the National Brain Tumor Foundation (NBTF), 29,000 people are diagnosed with brain tumor in the United States (US) with brain tumor and 13,000 of those patients die per annum [ 6 ]. A number of advanced Magnetic Resonance Imaging (MRI) techniques that include Diffusion Tensor Imaging (DTI), MR Spectroscopy (MRS) and Perfusion MR are used for the analysis of brain tumor through MRI [ 7 , 8 , 9 ]. Brain tumor is broadly classified into two types: cancerous tumors, known as malignant tumors, and noncancerous tumors, known as benign tumors. Malignant tumors are further classified into grades I to IV by World Health Organization (WHO) [ 10 ]. A Grade-I tumor is called Pilocytic Astrocytoma, Grade-II tumor is Low-Grade Astrocytoma, Grade-III tumor is Anaplastic Astrocytoma and Grade-IV tumor is Glioblastoma. Grade-I tumors and Grade-II tumors are semi-malignant tumors with less aggressiveness. Grade-III and Grade-IV are malignant tumors and highly affect the health of the patient and may lead to the death of tumor patients [ 11 ].
A variety of image-processing techniques and methods have been used for the diagnosis and treatment of a brain tumor. Segmentation is the fundamental step in image processing techniques and is used to extract the infected region of brain tissue from MRIs [ 12 ]. Segmentation of the tumor region is an important task for cancer diagnosis, treatment, and the evaluation of treatment outcomes. A vast number of semi-automatic and automatic segmentation methods and techniques are used for tumor segmentation [ 13 ]. MRI contains methods with multiple sequence that include T1-weighted (TI) and T1-weighted contrast-enhanced (T1c), T2-weighted and T2-weighted Fluid Attenuated Inversion Recovery (FLAIR) techniques, which are employed for the segmentation of brain tumor.
MRIs have various features that are adopted in brain tumor segmentation studies that include image textures [ 14 ], local histograms [ 15 ], and structure tensor eigenvalues [ 16 ]. Machine learning methods such as Support Vector Machines (SVMs) [ 17 , 18 , 19 ] and Random Forest (RF) [ 14 , 15 , 16 , 20 ] are commonly used for pattern classification in tumor segmentation studies. Deep-learning-based techniques and methods are becoming popular in brain tumor segmentation studies, as their performance is superior in image analysis fields, such as object detection [ 21 ], image classification [ 22 ] and semantic segmentation [ 23 , 24 , 25 ]. Deep learning techniques have achieved state-of-the-art performance for automatic segmentation of brain tumors through multi-model MRIs [ 1 ]. The Convolutional Neural Network (CNN) is a powerful method for image recognition and prediction. However, CNN is mostly used for brain tumor segmentation, classification, and prediction of survival time for patients [ 26 , 27 , 28 ]. More deep-learning-based methods that are utilized for tumor segmentation, classification, and prediction include Stacked De-Noising Autoencoders [ 29 ] and Convolutional Restricted Boltzman Machine [ 30 ]. Among all the deep learning methods and techniques, CNNs perform batter for image segmentation, classification, and prediction. Two-Dimensional CNNs (2D-CNNs) [ 31 , 32 , 33 , 34 , 35 ] and 3D-CNNs [ 16 , 36 , 37 ], were both adopted to build brain tumor segmentation, classification, and prediction methods. Segmentation methods classify the image patch into different classes, such as necrosis, healthy tissues, edema, enhancing core and non-enhancing core.
Different tumor cells show distinct phenotypic and morphological information for segmentation, classification, and prediction, including gene expression, motility, cellular morphology, metabolism metastatic potential, and proliferation. This paper presents a review of various methods, techniques, frameworks, architectures, algorithms and critical studies using deep learning for segmentation, classification, and survival time prediction. Survey taxonomy describes the methods, techniques, systems, algorithms, frameworks, and architectures that are based on tumor segmentation, evaluation, and features exploration for tumor prediction and its classification. The review performs an analysis of the features extraction techniques, dataset utilized, tools, languages, and libraries that are used for implementation, recognition and evaluation measures. The issues and research gaps in various existing research problems include the key issues in tumor recognition for monitoring, recognition procedures and treatment plans for cancer patients.
The application of deep learning to brain tumor analysis first appears in conferences and workshops, and then in journals. The number of research papers grew rapidly from 2015 to onward. This topic has now became dominant at different conferences and journals.
Figure 1 illustrates the development of deep learning applications to brain tumor analysis. Figure 2 presents a literature-based taxonomy for brain tumor analysis.

Breakdown of the papers included in this review in the year of publication.

Literature Taxonomy of brain tumor using deep learning.
The development of deep learning application to brain tumor analysis motivated us to present a comprehensive review in all fields of brain tumor that includes segmentation, prediction, classification, both from a methodology-driven and applications perspective. The review also includes an overview of all the research publications in tabular form that helps readers to quickly assess the field. Consequently, this review presents a dedicated discussion section to the readers that covers the state-of-the-art successful development, open research challenges and an overview of future research directions.
The review includes a large number of research papers, most of them recent, presenting an extensive variety of deep learning applications in brain tumor analysis to identify the most relevant contribution (“deep learning” AND “Brain Tumor”) in the title and abstract query performed. Additionally, MICCAI workshop papers related to brain tumors have also been included in this review. In summary, the aim of this review is (a) to show the deep learning development in the entire field of brain tumor, (b) the identification of open research challenges for successful deep learning methods for brain tumor tasks, (c) to highlight the successful deep learning contribution to brain tumor analysis.
2. Healthcare Scalability Importance and Challenges
The scalability in healthcare services, that includes the patient prioritization process and patient analysis, is a challenging task [ 38 ]. The demand for health care services is increasing gradually as the number of patients increases due to a rise in the population. The priority of healthcare services is based on the emergency status of patients. The identification of innovative research contributions for the provision of effective and efficient health care systems is an important and challenging task [ 39 , 40 , 41 , 42 , 43 , 44 , 45 , 46 , 47 , 48 ]. Various studies are conducted in bioinformatics to improve the prioritization process and provide a solution for the scalability problems in health care services [ 38 , 49 ].
This section introduces the relevant literature that explores the dilemma of the growing number of elderly patients who need timely and effective telemedicine services. An increase in the number of patients is expected to occur in the context of an ageing population [ 38 , 50 , 51 , 52 , 53 , 54 , 55 ] and disasters phenomena [ 56 ]. There are a number of problems in health care services but the aging population is considered to be the greatest problem [ 54 , 55 , 57 , 58 ].
The major changes in demographics lead to serious issues in the health care system [ 59 ]. As an increment in serious problems and permanent issues in the health care domain rises, the social and economic burdens increase [ 59 , 60 , 61 ]. Globally, health care systems and society loaded with burdens may result in a population’s aging problems. By 2030, 13% of the world population will fall in the aging category and the burden on the health care sector will be enormous [ 62 ]. Serious diseases that include brain tumors, chest cancer, lung cancer, diabetes, hypertension, and heart failure, directly affect medical health care expenses all over the world [ 63 , 64 , 65 ]. The manual treatment of serious disease is a challenging task for the global health care systems in terms of quality of care delivery [ 65 , 66 ]. As the number of patients in the health care domain increases, an increase in the United State (US) health care services expenditure is reported. The Center for Medicare and Medicaid Services (CMS) revealed that US health care expenditures gradually increases every year, as shown in Figure 3 .

National healthcare expenditure per capita in the US.
3. Brain Tumor Classification
The deep learning techniques and methods have performed well on image classification and supervised machine learning, as reported in recent research papers. Brain tumor has various classes, which include glioma, meningioma and pituitary tumors. Brain tumor is further classified as benign or low-grade I and II and malignant tumor, or high-grade III and IV. The following paragraphs thoroughly explain the recent research into brain tumor analysis. Table 1 shows the various data sources and their acquisition methods.
Data sources and their acquisition methods.
The classification of brain tumors is a challenging task due to variations in the shape, size, location, and contrast of tumor tissue cells. State-of-the-art deep learning techniques are used to classify different types of brain tumors—glioma, meningioma and pituitary types—that are further separated into axial, coronal and sagittal planes. Segmentation algorithms are employed for the extraction of features from axial slices using Dense CNN and these sequential features of multiple frames are classified by the recurrent neural network [ 68 ]. Generally, fully connected and convolutional networks are used in the classification models of brain tumors. The dataset, which is publicly available, contains 3064 enhanced contract brain MRIs and 989 axial images to minimize the error rate of neural networks in identifying the tumor. The test is performed on 512 × 512 axial images. Training is performed on axial images using five-fold cross-validation tests that increase the accuracy of the classification [ 75 ]. Table 2 describes the literature overview related to brain tumor classification.
Overview of papers using deep learning for brain tumor classification.
The term cytotechnologist is used for experts who diagnose brain tumors. Astrocytes are a glia type cell of nerves and it is very difficult to differentiate between astrocyte and low-grade astrocytoma. The BING method is used to segment the cell regions and, for classification, convolution neural networks with residual learning are employed [ 73 ]. After detecting brain cells, the Voronoi diagram, watershed transform, and binarization are used in segmentation. Finally, CNN is performed on the segmented cells that achieve 98.5% classification accuracy [ 73 ]. The Extreme Learning Machine Local Receptive Fields (ELM-LRF) method is also proposed for the classification of tumors, which consists of three phases: removal of the noise using local and nonlocal methods, segmentation of benign or malignant tumor using ELM-LRF, and its classification. The cranial MR images are used in the proposed solution as they contain mass. The proposed method is effective and, using cranial MR images, an accuracy of 97.18% is achieved [ 71 ].
Misdiagnosis of the tumor affects the medical intervention and reduces the chances of survival of patients. Conventional methods that identify the tumor using MRIs are time-consuming for large datasets. The CNN architecture contains one layer each for max-pooling, flattening and convolutions, and these layers are fully connected with hidden layers that do not need any prior region-based segmentation. The architecture is trained on a publicly available dataset containing 3064 MRIs that achieve 98.51% accuracy for classification [ 69 ]. Three ConvNets-based models are proposed, in which a Convolutional Neural Network is trained through scratch, slices, patches and multiplanar volumetric slices of MRIs. Two ConvNets VGGNet and ResNet are trained by Images Net dataset and fine-tuning is used to train the last few layers of the ConvNet. The performance of the proposed ConvNet is tested using the Leave-One-Patient-Out (LOPO) scheme. ConvNet attains better accuracy compared to the existing models as it contains a self-learning feature with kernels/filters on different layers of ConvNet [ 67 ]. Oval multi-stream deep CNN architecture is proposed for brain tumor classification, in which molecular-related subcategories are utilized for tumor grades. Different enhanced and sensitive MRIs T1-MRI, T2-MRI, and FLAIR are used for fusion of the features in glioma grading classification. The objectives are achieved by the proposed architecture that employs multi-stream 2D deep CNN in glioma grading classification.
Fusion features are aggregated for scans of T1.MRI, T2.MRI and FLAIR brain images and 2D slices of 2D images are used to mitigate the over-fitting problems. The proposed architecture performs decently for grade glioma classification with 90.87% accuracy [ 135 ].
DNA methylation-based approaches that contain multi-modal medical images are used in the classification of glioblastomas tumors. 3D implementation, such as Histograms of Oriented Gradient (HOG), Local Binary Pattern (LBP) and Binary Robust Independent Elementary Features (BRIEF), is developed for short local image descriptors where tumor regions are identified by Bag-of-patterns as well as hand-crafted and auto-encoders deep features that are computed for segmentation masks in tumor diagnosis [ 70 ].
4. Brain Tumor Prediction
Prediction of brain tumors and the chances of survival for patients are open challenges for the researchers. MRIs opens ways of research in the field of brain tumors such as prediction, classification and segmentation analysis. Brain tumors are classified into two categories that consist of benign and malignant lesions. The multi-class tumors are also further subcategorized into XX and YY described from major to minor [ 72 ]. The size of the dataset is strongly linked with regression and other deep learning methods. The 3D-convolutional neural network plays an important role in classical regression methods for survival time prediction of patients with high-grade brain tumors. 3D CNN is used with Support Vector Classifier for better accuracy. Tumor cell shape, location, intensity and deep features are investigated during the experiment. More training data are required for the regression-based methods [ 83 ]. The survival time is varied in short-term, mid-term and long-term for high-grade gliomas tumor patients. A research study is carried out for the accuracy of different machine learning and deep leaning Brats 2017 dataset samples that consist of 163 samples of brain MRIs. Deep features that include intensity and statistical texture, and volumetric and shape of tumor cell are important for the training of various Machine Learning (ML) and Deep Learning (DL) methods. Different ML and DL methods that include Support Vector Machine (SVM), e, linear discriminant analysis, logistic regression and K-Nearest Neighbors (KNN) are tested on Brat’s dataset, and accuracies are compared. The best prediction accuracy is achieved using a hybrid algorithm combining CNN and linear discriminant analysis [ 87 ]. CNN is a well-known method for image recognition and prediction. MvNet and SPNet are used to address the challenges of multimodal tumor segmentation. Multi-view Network slices the multimodal images from different view-points, which consist of three Multi-branch layers that are fully connected with Residual Networks (Mb-FCRN). Mb-FCRN produces independent segmentation results and then SPNet is employed to measure the survival time for the temporized patients [ 84 ]. Table 3 shows an overview of the literature reports based on brain tumor prediction techniques using deep learning.
Overview of papers using deep learning for brain tumor Prediction.
A two-stage learning-based method is proposed by D. Nie for the prediction of overall survival time for high-grade gliomas tumor patients. In the first stage, high-grade features are extracted to enhance multi-modal, multi-channel MRIs to increase the predicted survival time. Two-stage learning methods are used for contrast-enhanced MRIs as well as in Diffusion Tensor Imaging (DTI), and resting-state MRI images for computing different metric maps that include DTI images for generating diffusivity maps and anisotropy-related fluctuation frequency maps. The 3D convolutional neural network consists of multi-channel metric maps that are used to extract the high-grade predictive features from the individual patch of these maps, and trains the network layers for prediction. In the second stage, Support Vector Machine (SVM) are used to classify tumor-related features such as age, histological type, and tumor size to predict the final (short or long) overall survival time of high-grade gliomas patients with 90.66% accuracy [ 136 ].
The Extreme Learning Machine Local Receptive Fields (ELM-LRF) method is proposed for the prediction of tumors, containing three phases that include the removal of the noises from images by local and nonlocal methods, the prediction of benign or malignant tumor using ELM-LRF and segmentation of tumor. The cranial MR images are used in the proposed method, as the images have more mass. The proposed method is effective and gives a high accuracy of 97.18% for malignant tumors when cranial MR images use [ 71 ].
High-grade gliomas brain tumor is very aggressive and leads to the death of a patient in 1–2 years. The accurate and timely prognosis of the gliomas brain tumor increases chance of survival. The extraction of the deep features of gliomas patients from MRI, DTI, and fMRI is important for prediction of overall survival time. 3D CNN with multi-channel data extracts the deep and clinical features, and using SVM predicts short, long and overall survival times of the gliomas patients [ 85 ].
The variable and complex shapes, textures, sizes, and locations of brain tumor cells are a few challenges for automatic detection of the tumor. An unsupervised clustering method that has a fused feature vector is a mixture of the Local Binary Pattern (LBP), Gabor Wavelet Features (GWF), Histograms of Oriented Gradient (HOG) and Segmentation-Based Fractal Texture Analysis (SFTA) are developed by J. Amin for the prediction of brain tumor. Random Forest (RF) is used with 0.5 holdout cross-validation to avoid overfitting problem in the prediction and classification of tumors into complete, enhancing and non-enhancing regions [ 86 ].
Neuro endoscopy and invasive procedures have great impact on the prediction and treatment of pituitary brain tumors. The Eyebrow Orbitotomy approach is used by neurosurgery and assistant surgeons to predict the brain tumor [ 137 ].
Another approach is presented for the classification of brain tumor in which a modified level set method is used to segment the tumor region. The feature set thr Gabor and moment invariant, and Grey Level Co-Occurrence Matrix (GLCM), that are extracted using Multi-Level wavelet decomposition. After features selection, Adaptive Artificial Neural Network (AANN) is applied on selected features for the prediction of brain tumor. To increase the accuracy of the ANN, optimization for layers of the network is performed using the Whale Optimization Algorithm (WOA) [ 88 ].
5. Exploring Deep Features for Brain Tumor
Deep features exploration and representation is an important task for the prediction and diagnosis of brain tumor from radiological MRIs. Deep features are extracted from MRI images for diagnosis, therapy, and prognosis in oncology. The radiomic properties of the images clearly link with meaningful biological characteristics and give qualitative pieces of information that are familiar to radiologists [ 138 ]. Deep convolutional neural networks achieve state-of-the-art performance for prediction and classification when network is pre-trained as features extractor. Deep feature extractor methods and techniques are better for the prediction of over-all survival time for the tumorized patients [ 80 ]. Deep Convolutional Neural Networks (CNNs) activation method is used to extract the features from ImageNet to train the CNNs networks for classification and segmentation. CNN’s activation features method employs various techniques that include features’ selection, features’ pooling, and data augmentation algorithms [ 76 ].
To reduce the intensity of variation of the images’ different average filters, features selection, features extraction and fusion are performed. Gabor Wavelet features technique is used to obtain the texture information of the image that contains the locality orientation and frequency of the tumor. Kernel Principal Component Analysis (KPCA) selects the small subset of the features and reduces the redundancy by increasing the relevancy of the features. Gaussian Radial Basis Function (GRBF) gives distinguished information of features from multiple sets of features for feature fusion [ 78 ]. Fine-tuning-based feature extraction is used in the pre-trained CNNs method. Fine-tuned CNNs are initially trained with a large amount of natural image data and then adopt features representation that is used for different brain tumor containing segmentation, classification, and prediction of survival time for tumorized patients [ 77 ]. Table 4 shows the overview of the literature.
Overview of papers using deep learning for brain tumor Deep Features, Evaluation and Framework.
6. Brain Tumor Segmentation
Brain tumor segmentation is performed to extract the tumor region from the images for the further classification and prediction of brain tumors. Different Machine ML/DL methods are proposed for the segmentation of tumorized cells. Some of these ML methods use manually segmented images for the training, which is costly, time-consuming and needs medical expertise. Two types of data, fully-annotated and weakly annotated data, train the deep learning methods for segmentation. A method that uses these two types of data, presented by V. Rao, adds an additional branch to the segmentation network for image-level classification. The method also studies the weakly annotated images to learn to avoid features that are irrelevant for the segmentation task [ 95 ]. Deep Neural Network (DNN) is applied on the Pixel wise multimodal image representation that includes T1, T1c, T2, and Flair for the segmentation. DNN learns from each pixel of the image and segments the brain region more accurately [ 139 ]. Table 5 describes the overview of recent development for brain tumor segmentation.
Overview of papers using deep learning for brain tumor segmentation.
State-of-the-art neuroimaging techniques are available for the detection of visible and invisible tumor cells. The variability in the shape and size of the tumor increases difficulties for automatic image segmentation. A hybrid Random Forest and Support Vector Machine (RF-SVM)-based method learns from the complex characteristics of the tumor lesion. RF-SVM consists of two-stage cascade in the first stage, random forest learns from the tumor label space and, at the second stage, the predicted features are fed into the SVM for classification. RF-SVM performs well as it is used solely for the segmentation [ 140 ].
Fully Convolutional Network (FCN) is used for segmentation of the tumor region and modifies the network with bounce structural chart to facilitate the semantic requirements for segmentation. Three-dimensional CNN is used for segmentation of the brain tumor. S. Kumar uses UNET and crops the image when fed into the network for better results [ 100 ]. The interactive deep-learning-based framework consists of the integration of CNNs into the bounding box and the scribble-based image segmentation pipeline is developed by G. Wang for tumor segmentation. The image-specific fine-tuning-based CNN’s model becomes more adaptive for specific test images [ 141 ].
The large size and dimensions of images (an image size up to gigabyte) and a limited amount of training data affect the performance of the Deep Convolutional Neural Network (DCNN). The convolutional neural network extracts the features and train their activation function through ImageNet knowledge, along with features selection, data augmentation, and feature pooling functions [ 76 ]. Convolutional Neural Network uses an encoder and decoder network with a singular hourglass structure for segmentation of the tumor region. Some preprocessing techniques are applied first and then the processed data is fed into the network. The hourglass method classifies the tumor into a core using one pass iteration [ 89 ]. Convolutional Neural Network has a powerful learning ability that learns attentive and contextual information when multiple deep layers of a variant structure are added to the network architecture, and produces more robust results for tumor segmentation. The risk of over-fitting for segmentation is reduced with the modified network and achieves a better Dice score for Brats 2018 data set [ 90 ]. Multi-Scale information requires brain image segmentation using boundary detection with the global context. The CNN uses down and upsampling of images to compute the features at a multi-scale level for semantic segmentation. The downsampling path requires a pooling operation which includes CNN, that is not desirable for segmentation tasks. The dense net is applied on a Brats 2017 dataset that excludes the pooling operation and adds delated convolutions, excluding the non-brain tissue for segmentation of the tumor region [ 91 ]. 2D fully convolutional network preforms better for segmentation with an increase in the depth of the architecture. Inception modules, convolutional layers, and the dense module were added in the U-Net architecture to the depth of the network and performance of the U-Net is computed. Deep U-Net architecture is trained on different image orientations without data augmentation techniques [ 92 ]. The 2D deep neural-network-based algorithm detects and segments the intra structure of tumors including enhancing, non-enhancing, necrosis and edema, forming multimodal MR brain images. Cascade U-net detects the tumor region and DCNN segments the patch base intra-tumor structure [ 93 ].
Fuzzy Logic with a Spiking Neuron Model (FL-SNM) is used for segmentation of the tumor region in MRIs. Modified Kuan Filter (MKF) is used to remove Poisson and Gaussian noise ftom the image before bringing it to the FL- SNM model. Random Search Algorithm (RSA) optimizes the image pixels and improves the Peak Signal-to-Noise Ratio (PSNR). Anisotropic Diffusion Filter (ADF) smooths the image and reduces the over-filtering problems. Afterwards, Fisher’s Linear Discriminant Analysis (FLDA) extracts the statistical texture features from the MRIs. The extracted features are transferred to the FL-SNM for the effective segmentation of the tumor region. Chicken Behavior-Based Swarm Intelligence (CSI) algorithm optimizes the weight value as weight and bias values are important in the FL-SNM model for tumor segmentation [ 94 ].
The segmentation of brain MRIs is implemented using the newly presented Fully Convolutional Residual Neural Network (FCR-NN), which is based on the linear identity of mappings. FCR-NN is a combination of optimizied residual and fully convolutional networks that efficiently segments low- and high-grade image features. In FCRe-NN, two different networks train the data, initially whole segmentation is performed and later on, tissue-based sub-region segmentation is achieved. FCR-NN enhances the overall Dice score for complete core and enhancing tumor [ 98 ].
Glioblastoma brain tumor segmentation is performed using convolutional neural networks with few layers and small receptive fields that minimizes the contextual and quality information for tumor segmentation. U-Net employs multiple layers for training and uses dynamic sampling of training data [ 99 ].
6.1. Feasibility Studies on Segmentation
Deep learning methods and models use a large amount of data for semantic segmentation of brain tumors, and it is a challenging task to acquire sufficient data for the training of models. The labeling of medical images requires domain knowledge expertise. Sharing the medical data of patients to a centralized location results in privacy, legal, data-ownership and technical challenges at the international level. The federated learning approach is used for semantic segmentation without sharing patient data by the multi-institutional collaboration. Federated learning provides better accuracy for semantic segmentation, with respect to the model that is trained on sharing data [ 145 ].
Tumor lesion location, use of Anti-Epileptic Drugs (AEDs) and the development of psychiatric symptoms have strong correlations among them. Treatment-Emergent Psychiatric Adverse Event (TE-PAEs) is possible through AED therapy and meets the conditions that includes onset within 4 weeks after AED therapy is perfromed, the absence of any other notorious possible concurrent cause, and disappearance upon drug discontinuation [ 146 ].
6.2. Proposed Approaches for Segmentation
The diagnosis, planning, treatment, and evaluation of treatment outcome depends on accurate and reliable tumor segmentation. Fully Convolutional Neural Networks (FCNNs) and Conditional Random Fields (CRFs) are jointly used for the segmentation of tumor regions. Firstly, FCNNs-CRFs train FCNNs using slices and patches of 2D images. The parameters of FCNNs with image slices are used to train CRF as Recurrent Neural Networks (CRF-RNN), and image slices are used for the fine-tuning of FCNNs and CRF-RNN. 2D images patches are used to obtain coronal, axial and sagittal views, and voting-based fused-strategy is performed to combine these slices in tumor segmentation. The FCNNs-CRFs segment images into slice-by-slice orientation instead of patches which makes it much faster as compared to other existing segmentation models [ 1 ].
The variational model detects the saliency in MRIs and segments tumor regions. The variational model also detects the region of interest for the tumor. The proximal point algorithm solves the non-convex and non-smooth problems in the segmentation [ 147 ] to find a method for segmenting the brain tumor. The method consists of preprocessing, post-processing and a deep learning-based classification model. The model starts from preprocessing, which extracts the images patches for brain MRIs to achieve the gray level sequences of MRI patches that trains the deep learning network. The deep learning uses a stacked autoencoder to extract the high-level features of the image and uses the selected images patches for classification. Morphological filters are used for post-processing and convert the obtained result into a binary image for final segmentation result [ 113 ].
Multi-modal MRIs are used for brain tumor segmentation using automated generative models. The generative model is useful for healthy brain tumor tissues, the combination of spatial atlas-base for tissue prior and Gaussian mixture models for tissue modulation. To shape the core and complete tumors prior-to-tumor-based model, convolutional Restricted Boltzmann Machines (cRBMs) was presented by M. Agn [ 142 ]. The cRBMs model is effective for low and high-grade gliomas’ segmentation as it uses expert segmented images for training that do not use intensity information of images [ 142 ].
The Hybrid Pyramid U-Net (HPU-Net) model explores the contextual information of different region-based contexts. HPU-Net predicts pixel-level segmentation using global context information and produces good quality results for tumor segmentation. HPU-Net is based on multimodal tumor segmentation and performs end-to-end training and testing. The model uses downsampling and symmetrical upsampling paths and concatenates the features of up and downsampling at the symmetrical block. In the up-sampling process, multiple-scale features are extracted from each block and are added pixel-wise to recover the origin resolution. The integration of multi-scale, semantic and location information before the softmax layer increases the efficiency of tumor segmentation [ 142 ].
Brain tumor segmentation has received great attention in the domain of soft computing and medical images. Machine learning and deep learning methods require a large amount of data for their training that is expensive in the biomedical field. Different data augmentation techniques are available to expand the size of taring data to achieve better segmentation results. Generative Adversarial Networks (GANs)-based automatic data augmentation methods, presented by T. C. W. Mok and A. C. S. Chung, make the available annotated samples more efficient for deep-learning-methods [ 111 ]. The method consists of the coarse-to-fine generator that captures manifold training data and generates general augmented data for the segmentation [ 111 ]. Differential Evolution algorithm combined with OTUS is used to optimize the threshold value of the particular image and train the neural network for segmentation [ 112 ]. Deep learning technologies in the medical field improve the awareness of bio mechanisms for brain tumor segmentation. The segmentation of brain tumors is difficult due to variability in the size, shape, and location of tumor cells. The identification and segmentation of gliomas tumor from MRIs is a challenging task due to variabilities in tumor location, shape, spatial extent, intensity signature and the possible distance between normal and tumorized tissues. A novel, simple Fully Convolutional Network (FCN) segments the tumor efficiently and gives a faster runtime than other methods [ 106 ]. A Multiple Convolutional Neural Network-based framework with discrimination mechanisms was proposed by L. Zhao and K. Jia to overcome the segmentation problem, that includes accurate segmentation and protects the image form large and complex biases added to the MRIs. The 2D multiple CNNSs reduce the segmentation time for 3D voxel classification of brain tumors [ 108 ]. Another Multiscale Convolutional Neural Network that is based on statistical threshholding, segments the tumor region effectively. The statistical threshold method perfoms the coarse segmentation of the tumor. The multiscale convolutional neural network obtains the 2D multi-modality image that is roughly segmented by the statistical method for final tumor segmentation [ 102 ].
A generative adversarial network (voxel-GAN) addresses the data imbalance problems in the brain tumor’s segmentation as the majority of the voxels come from the healthy region and few voxels belong to the non-healthy or tumor region. 3D conditional Generative Adversarial Network (cGAN) consists of a segmentor and discriminatory segmentor to learn the segmentation labels from 3D MRIs and the discriminator differentiates the segmentor output in the ground truth data and the output that is artificially generated. The discriminator and segmentor networks are trained on newly generated weight adversarial loss to reduce the imbalance problem in the training data [ 104 ]. 3D Deep Convolutional Neural Networks (3D DNNs) are most popular for tumor segmentation as 3D DNNs have a strong learning capability with a large number of parameters for effective segmentation. 3D large kernel anisotropic network addresses problems that arise due to a large number of parameters, especially the selection of valid receptive fields which forms a large number of features that causes high computational cost and model overfitting. The 3D large kernel consists of an encoder and decoder, a large kernel encoder to make sure the valid receptive field is large enough and an anisotropic CNNs encoder is used to simulate the isotropic ones with fewer parameters [ 103 ]. Fully Convolutional Network (FCN) along with multi-task are presented by H. Shen for the automatic segmentation of brain tumor. Multi-task FCN extracts the contextual information at multi-levels using the symmetric-difference from multi-model MRIs. It integrates boundary information directly into the loss function and achieves efficient segmentation results [ 105 ].
Random Forest technique computes probabilities for multi-modality geometry, intensity and asymmetry feature sets for the supervised segmentation. Random Forest model also generates probability maps and these maps are used to refine the Markov random field for probabilistic segmentation. Advanced Normalization Tools (ANTs) and R Statistical (ANTsR) are used to investigate the learning capabilities of random forest for probabilistic segmentation [ 107 ].
6.3. Enhancement Approaches towards Segmentation
The brain tumor develops due to the creation of abnormal cells in the brain tissue, and there are two types of brain tumors including benign and malignant tumors. The benign tumor does not affect human health but the malignant tumor has a lethal effect on the surrounding healthy and normal tissues in the brain that leads to the death of a patient. Early detection of tumor is necessary for treatment and patient survival. Segmentation of the tumor region is a challenging task due to the irregular shape and location of the tumor cell.
A kernel-based CNN combined with M-SVM presents an effective method for the enhancement and automatic segmentation of tumors. The method consists of preprocessing phase, features extraction method and tumor segmentation. Laplacian Of Gaussian (LOG) filtering method and Contrast Limited Adaptive Histogram Equalization are used for MRIs enhancement and extraction of features that are based on the shape, size and their location in the brain. The kernel-based CNN method uses MRIs and M-SVM to classify the tumor that is segmented by kernel-based CNN [ 109 ]. Stationary Wavelet Transform (SWT) and Growing Convolutional Neural Network are jointly used for a better segmentation of tumor region. SWT enhances the accuracy level of GCNN for segmentation [ 12 ].
A hybrid method, used for the segmentation of tumors by W. Deng, is a combination of a fully convolutional neural network and Dense Micro-block Difference Feature (DMDF) [ 110 ]. The Fisher vector encoding method analyzes the texture features to avoid rotational change and scale in texture images. The obtained local feature is fused to the Fully Convolutional Neural Network (FCNN) for fine boundary segmentation and then the de-convolutional skips the connection and a high-quality features map is obtained for segmentation [ 110 ].
6.4. Approaches toward Automatic Segmentation
The automatic segmentation of brain tumors into the whole tumor, core tumor and enhancing tumor form multi-model MRIs is dependent on tumor regions. The cascade of full CNNs decomposes the multi-class segmentation region into three binary segmentation regions. The cascade FCNNs work as the first segment for the whole tumor and bounding box of results is used for the segmentation of the core tumor. In the second stage, bounding box results of the core tumor are used to segment the enhancing tumor. The cascade of FCNNs consists of multiple layers of dilated and anisotropic convolutional filters and reduces the false-positive rate using multi-view fusion. The multi-scale prediction and residual connections of cascade FCNNs boost the segmentation performance [ 118 ].
Deep Learning (DL) and Multi-Atlas (MA) methods performed on Dual-Energy Computed Tomography (DECT) data have distinguished the healthy tissues from tumor tissues that are referred to as Organs-At-Risk (oARs). The Dual-Energy CT (DECT) dataset has high-resolution images as compared to single-energy CT. DL methods achieved better results for segmentation on DECT in comparison to single-energy CT for qualitative and quantitative analysis [ 148 ]. A 3D convolutional neural network deals with the partial volume averaging, inter-slice intensity variation and noise sensitivity. The intensity in homogeneity and intensity non-standardization is used to segment the tumor regions effectively. N3T-spline reduces the intensity and noise variation by correcting the bias field distortion and using a gray level co-occurrence matrix to extract the features from texture patches. 3D CNNs use these features and automatically segment the tumor into various abnormal tissues [ 121 ].
Structured Random Forest (SRF) and Bayesian Networks (BN)-based learning frameworks segment the multi-label images automatically. The structured random forest and Bayesian networks are embedded into multi-layer deep learning architecture and they cooperate for better learning of tumor features for multi-label segmentation. In the SRF-BN method, SRF performs pixel-level segmentation by exploring the contextual and structural information of the image, and BN supervises the statistical dependencies of image components at super pixel-level.
BN input probabilities maps are generated by SRF and original multi-model images are employed in each multi-layer of deep architecture. In the context of learning transfer from SRF to BN, BN performance has been improved gradually. In the next layer, the performance of SRF increases using original multimodal image and BN segmentation maps. In the SRF-BN method, both use the segmentation maps from the previous layer and the learning capabilities are increased in the networks. Thus better performance is achieved in the segmentation of tumors [ 97 ].
The U-Net base fully convolutional network measures the tumor’s level and automatically segments the tumor region into the whole, core and enhancing tumor [ 122 ].
The 2D Deep Convolutional Neural Networks (DNNs) automatically extracts the tumor into whole-tumor and intra-tumor regions’ in multimodal 3D MRIs. 2D convolutional neural network inspired by U-Net is modified using Generalized Dice Loss (GDL) and Weighted Cross-Entropy (WCE) as a loss function is used to address the class imbalance problems the tumor data. The proposed method was tested on BraTS 2018 dataset and had achieved a good dice score for Whole, Core and Enhancing tumor [ 114 ].
Deep Convolutional Neural Networks (DCNNs) use relatively small datasets for their training and data augmentation techniques are used to increase the performance of CNNs. The network structure of the CNNs is updated through flipping, scaling, image 3D rotation, adding noise at both training and testing times, and applying data augmentation techniques increase the performance of DCNNs in brain tumor segmentation [ 101 ].
Cascade’s fully convolution neural network is an effective method for image segmentation that splits multi-model MRIs into subhierarchy regions. 3D SE-inception network employs the 3D multi-model image data instead of 2D images. The 3D SE-inception uses dilated convolutional filters, and 3D Squeeze and Excitation structures for 3D segmentation. In the 3D SE-inception system, the bounding box results of whole tumor are used for the segmentation of the core tumor and bounding box results of core tumor are used for the segmentation of enhancing tumor [ 115 ].
The hybrid method of modified U-Net is combined with a domain-adapted version (DAU-Net) to segment the tumor by dividing the training samples in two domains. Firstly the preliminary tumor segmentation results are obtained and secondly, the domain invariant features are computed using modified U-Net [ 116 ].
A U-net neural network with three layers, one for the each region of interest, segments the tumor region into the whole, core and enhancing tumor effectively. The U-net model preprocesses the data of the patients before segmenting the tumor regions into the whole, core and enhancing tumor. The proposed multi-U-net model predicts the tumor location and survival time of the tumorized patient [ 117 ].
Convolutional neural network segments the tumor on the basis of multi-paths and is very effective for automatic segmentation as the multi-path CNNs is obtained using the contextual information in segmentation of multi-scale-regions of MR images. In the multi-path, CNNs spatial information is used to identify the healthy and tumorized regions of the brain [ 119 ].
Random Forest (RF) and Binary Decision Tree use multi-spectral MR images for efficient segmentation of the brain tumor region. RF-BDT preprocess the image dataset by reducing the effect of relative intensities and increase the features information at each voxel of the MR image [ 120 ].
Semi-Automatic Images Segmentation (SAMBAS) was presented by D. Gering for tumor segmentation in which Multi-Plane Reformat (MPR) is used to draw a long axis of the 3D segmented image. When 3D segmentation is performed on MPR, the 2D segmentation is updated in real-time. All necessary additional short axes, long axes, and other editing operations are drawn on the MPR plane. SAMBAS performs probability distribution in MPR segmentation and accelerates the process of 3D segmentation [ 123 ].
The deeply supervised neural network based on Holistically-Nested Edge Detection (HED) automatically segments the brain tumor from multi-model MRIs. The HED method works for binary edge detection of images for classification but also is applicable for multi-class tumor segmentation. The HED method segments the brain tumor into multiple classes that include whole, core and enhancing tumors [ 124 ].
7. Brain Tumor Evaluation
Positron Emission Tomography (PET) images tool is used for assessing brain tumors and differentiating tumor progression from reactive changes. The integration of Fluoro Ethhlyl Tyrosine and PET (FET-PET) method adds valuable information to MRIs for a better decision. Attenuation Correction term is used for acceptance of tumor in the FET-PET method. Deep-UTE and RESOLUTE methods generate CT-AC metrics more effectively. The Deep-UTE method produces more robust clinical metrics using CT-AC and overall patient survival time is increased. PET/MRIs’ attenuation correction in the Deep-UTE method is reliable for brain tumor evaluation due to better noise handling capability and less runtime properties [ 81 ].
8. Frameworks for Brain Tumor
The main aim of brain surgery is to perform the resectioning of tumors more accurately and preserve normal brain cells for the patient. The development of label-free and non-contact methods and frameworks is necessary to support the reliable resection of the tumor in real-time. Hyperspectral imaging is non-ionizing, label-free and non-contact. The deep-learning framework preprocesses the hyperspectral images in vivo brain tissues. The framework generates a thematic map that shows the parenchymal area of the brain and the location of the tumor is identified that helps the surgeon in successful and precise tumor resection [ 82 ]. Figure 4 shows the recent developments in deep learning for brain tumor analysis.

Deep learning development toward brain tumor through recent years.
9. Discussion
9.1. overview.
Numerous papers were studied to conduct a review that shows how deep learning methods and techniques achieve state-of-the-art performance in every aspect of medical image analysis, especially in the field of brain tumor analysis, segmentation and classification. The large diversity of deep-learning-based architectures and methods is covered in this article. The pre-trained Convolutional Neural Network is used as a features extractor in various studies. The Capsule Network and Generative Adversarial Network (cGAN) has also been used for medical image analysis in various articles. These pre-trained networks download easily and can be directly applied to any format of medical images. Moreover, the existing approaches and systems use handcrafted features. In the last three years, for medical image analysis, an end-to-end trained CNNs approach has been preferred by researchers. It is reported that Convolutional Neural Networks (CNNs) have replaced traditional handcrafted machine learning methods and were integrated into existing medical image analysis pipelines. A large number of papers that are studied in this review, follow the above approach that is being practised in current standards.
9.2. Key Aspects of Successful Deep Learning Methods
After reviewing the various papers, one would expect to be capable to distill the perfect deep learning architecture, approach, and method for individual tasks and application areas. The CNN-based architectures and methods would be top performers in most brain-tumor-based image analysis competitions. We can draw one striking conclusion that the exact architecture is not an important determinant for getting a good solution. We have observed, in different challenges including BraTS challenges (2015–2019), many researchers have used similar architectures in the same types of networks, but got extensively varying results [ 143 , 144 ]. Many researchers even added more layers in the CNNs network to increase the accuracy, which is the key aspect overlooked in expert knowledge. The researchers and groups that acquire good performance by applying deep learning methods and algorithms were able to do so using means outside the network such as the implementation of novel data augmentation and preprocessing techniques. In many BraTS challenges, researchers improved accuracy by adding normalization pre-processing steps that improve the generalization capabilities of the network without changing the CNN’s architecture. Different researchers focus on data augmentation techniques and strategies that make the CNN’s network more robust and they state that these strategies are very useful to obtain good performance. Data augmentation and pre-processing techniques are the key contributors to good solutions. Several researchers have observed that designing architectures for specific task properties attain better results than straightforward CNNs. Multi-view and multi-scale networks are examples of task-specific architectures that were encountered by the researchers several times. Network input size and receptive field are basic parts in designing a network (i.e., the input space area corresponds to a single output unit). The selected input size should fulfill the required context and resolution to solve the problem. The increment in the patch size to gain more context would not be beneficial without changing the receptive fields of the network. Another standard sanity check was performed by the researchers to assess the visual input of the network for the same task. If the researchers are domain experts and do not achieve good performance results then the need for modification in network architecture or input is high. The model hyper-parameter optimization (e.g., dropout rate, learning rate) aspect also affects the performance of the network. Disappointingly, there were no clear techniques or methods to assess the best set of hyper-parameters for empirical exercise. Researchers have also experimented Bayesian methods for hyper-parameters’ optimization but in the domian of brain image analysis, these methods have not been implemented till now.
9.3. Open Research Challenges, Limitations and Future Directions
The implementation of deep learning methods and algorithms in brain tumor image analysis presents numerous unique challenges. The lack of large training datasets is a challenging obstacle for deep learning methods. In the last decade, several PACS, MRIs and CT systems have been installed in various hospitals that generate tons of medical images. In some other fields, image data are used in well-structured digital archives that have a specific purpose. The PACS and CT systems are not broadly used in other fields of medicine such as pathology and ophthalmology. It has been observed that the number of available public datasets has increased gradually. Sophisticated text-mining techniques and methods are mandatory when writing reports on annotations or change structured labels in automated manners, where deep-learning-based methods and techniques are widely used. The introduction of structured labeling reports in the health domain, especially in brain tumor analysis, is expected to become easier in the future. It is predicted that, in future, the use of text-free and structured reports for training a network may increase rapidly, especially in the domain of brain tumor analysis. The researchers have asked domain experts (e.g., pathologists, radiologists) to make task-specific (e.g., segmentation, prediction, classification) and text-free reports from image data to train deep learning algorithms. The labeling of tumorized images is not only time-consuming but it also requires a high level of expertise that is challenging in brain tumor analysis.The training of systems based on deep learning algorithms, performing the segmentation of tumors, mostly in 3D networks, needs slice-by-slice annotations that are a not only challenging but also time-consuming task. The effeicient learning of deep learning methods from a limited amount of image data is also a major limitation of deep learning algorithms. Various researchers have trained their 3D segmentation models using only 2D segmentation [ 149 ]. To evaluate tumor analysis algorithms and to predict a tumor in brain MRIs, BraTS datasets are widely used. In this dataset, four types of tumor are annotated by radiologists. Training a deep learning system using these data needs additional consideration for modeling uncertainty and noise in the standard reference. A few researchers have provided solutions by incorporating label uncertainty directly in the loss function, but this is still an open challenge. Another problem related to data is class-imbalance. For example, data augmentation techniques are used to generate new lesions of brain tumors through scaling and rotation but this may cause class-imbalance. Pereira evaluates the data augmentation strategies for tumor lesion segmentation to combat class imbalance [ 150 ]. However, most deep learning methods and architecture in brain tumor analysis still deal with patch classification, where the anatomical location of the patch remains unknown for the network. A possible solution for this is that the entire image is fed into the deep network and using various methods, the learning process of network is achieved, for example, Milletari et al., designed a loss function that is based on the Dice coefficient [ 151 ]. However, if the network has a small receptive field for the entire image data, then there is no advantage for deep networks. The feeding of a full image into the network is not feasible sometimes due to a few constraints such as limited memory, GPU, and bandwidth, as the size of brain tumor images is generally in the gigapixels range. Another research challenge is that, generally, researchers have employed the same fixed size for a kernel to perform image slicing, which may hide some useful information from another region that is ignored by the kernel. A few researchers have used a variable size of kernel to slice the image data but more work is needed in this area. Figure 5 describes the open research challenges in brain tumor analysis.

Open Research Challenges in brain tumor analysis.
Author Contributions
M.W.N. and M.A.K. have collected data form different resources, M.W.N. and M.H. performed formal analysis, M.W.N. and K.M.K. contributed in writing—original draft preparation, M.W.N. and S.A.B.; writing—review and editing, M.H.; performed supervision, M.A.A.G. and S.H.A.; drafted pictures and tables, M.A.A.G. and S.H.A.; performed revision and improve the quality of the draft. All authors have read and agreed to the published version of the manuscript.
This research received no external funding.
Conflicts of Interest
The authors declare no conflict of interest.
Brain Tumor Detection and Classification Using Intelligence Techniques: An Overview
Ieee account.
- Change Username/Password
- Update Address
Purchase Details
- Payment Options
- Order History
- View Purchased Documents
Profile Information
- Communications Preferences
- Profession and Education
- Technical Interests
- US & Canada: +1 800 678 4333
- Worldwide: +1 732 981 0060
- Contact & Support
- About IEEE Xplore
- Accessibility
- Terms of Use
- Nondiscrimination Policy
- Privacy & Opting Out of Cookies
A not-for-profit organization, IEEE is the world's largest technical professional organization dedicated to advancing technology for the benefit of humanity. © Copyright 2024 IEEE - All rights reserved. Use of this web site signifies your agreement to the terms and conditions.
Thank you for visiting nature.com. You are using a browser version with limited support for CSS. To obtain the best experience, we recommend you use a more up to date browser (or turn off compatibility mode in Internet Explorer). In the meantime, to ensure continued support, we are displaying the site without styles and JavaScript.
- View all journals
- My Account Login
- Explore content
- About the journal
- Publish with us
- Sign up for alerts
- Open access
- Published: 25 May 2021
Brain tumor segmentation based on deep learning and an attention mechanism using MRI multi-modalities brain images
- Ramin Ranjbarzadeh 1 ,
- Abbas Bagherian Kasgari 2 ,
- Saeid Jafarzadeh Ghoushchi 3 ,
- Shokofeh Anari 4 ,
- Maryam Naseri 5 &
- Malika Bendechache 6
Scientific Reports volume 11 , Article number: 10930 ( 2021 ) Cite this article
58k Accesses
251 Citations
1 Altmetric
Metrics details
- Medical research
Brain tumor localization and segmentation from magnetic resonance imaging (MRI) are hard and important tasks for several applications in the field of medical analysis. As each brain imaging modality gives unique and key details related to each part of the tumor, many recent approaches used four modalities T1, T1c, T2, and FLAIR. Although many of them obtained a promising segmentation result on the BRATS 2018 dataset, they suffer from a complex structure that needs more time to train and test. So, in this paper, to obtain a flexible and effective brain tumor segmentation system, first, we propose a preprocessing approach to work only on a small part of the image rather than the whole part of the image. This method leads to a decrease in computing time and overcomes the overfitting problems in a Cascade Deep Learning model. In the second step, as we are dealing with a smaller part of brain images in each slice, a simple and efficient Cascade Convolutional Neural Network (C-ConvNet/C-CNN) is proposed. This C-CNN model mines both local and global features in two different routes. Also, to improve the brain tumor segmentation accuracy compared with the state-of-the-art models, a novel Distance-Wise Attention (DWA) mechanism is introduced. The DWA mechanism considers the effect of the center location of the tumor and the brain inside the model. Comprehensive experiments are conducted on the BRATS 2018 dataset and show that the proposed model obtains competitive results: the proposed method achieves a mean whole tumor, enhancing tumor, and tumor core dice scores of 0.9203, 0.9113 and 0.8726 respectively. Other quantitative and qualitative assessments are presented and discussed.
IOUC-3DSFCNN: Segmentation of Brain Tumors via IOU Constraint 3D Symmetric Full Convolution Network with Multimodal Auto-context
Jinping Liu, Hui Liu, … Jean Paul Niyoyita

MANet: a multi-attention network for automatic liver tumor segmentation in computed tomography (CT) imaging
Kasun Hettihewa, Thananop Kobchaisawat, … Thanarat H. Chalidabhongse

Context aware deep learning for brain tumor segmentation, subtype classification, and survival prediction using radiology images
Linmin Pei, Lasitha Vidyaratne, … Khan M. Iftekharuddin
Introduction
Brain tumors include the most threatening types of tumors around the world. Glioma, the most common primary brain tumors, occurs due to the carcinogenesis of glial cells in the spinal cord and brain. Glioma is characterized by several histological and malignancy grades, and an average survival time of fewer than 14 months after diagnosis for glioblastoma patients 1 . Magnetic Resonance Imaging (MRI), a popular non-invasive strategy, produces a large and diverse number of tissue contrasts in each imaging modality and has been widely used by medical specialists to diagnose brain tumors 2 . However, the manual segmentation and analysis of structural MRI images of brain tumors is an arduous and time-consuming task which, thus far, can only be accomplished by professional neuroradiologists 3 , 4 . Therefore, an automatic and robust brain tumor segmentation will have a significant impact on brain tumor diagnosis and treatment. Furthermore, it can also lead to timely diagnosis and treatment of neurological disorders such as Alzheimer’s disease (AD), schizophrenia, and dementia. An automatic technique for Lesion segmentation can support radiologists to deliver key information about the volume, localization, and shape of tumors (including enhancing tumor core regions and whole tumor regions) to make therapy progress more effective and meaningful. There are several differences between the tumor and its normal adjacent tissue (NAT) which hinder the effectiveness of segmentation in medical imaging analysis, e.g., size, bias field (undesirable artifact due to the improper image acquisition), location, and shape 5 . Several models that try to find accurate and efficient boundary curves of brain tumors in medical images have been implemented in the literature. These models can be divided into three main categories:
Machine learning approaches address these problems by mainly using hand-crafted features (or pre-defined features) 6 , 7 , 8 , – 9 . As an initial step in this kind of segmentation, the key information is extracted from the input image using some feature extraction algorithm, and then a discriminative model is trained to recognize the tumor from normal tissues. The designed machine learning techniques generally employ hand-crafted features with various classifiers, such as random forest 10 , support vector machine (SVM) 11 , 12 , fuzzy clustering 3 . The designed methods and features extraction algorithms have to extract features, edge-related details, and other necessary information—which is time-consuming 13 . Moreover, when boundaries between healthy tissues and tumors are fuzzy/vague, these methods demonstrate poorer performances.
Multi-atlas registration (MAS) algorithms are based on the registration and label fusion of multiple normal brain atlases to a new image modality 4 . Due to the difficulties in registering normal brain atlases and the need for a large number of atlases, these MAS algorithms have not been successfully dealing with applications that require speed 14 .
Deep learning methods extract crucial features automatically. These approaches have yielded outstanding results in various application domains, e.g., pedestrian detection 15 , 16 , speech recognition and understanding 17 , 18 , and brain tumor segmentation 19 , 20 .
Zhang et al. 21 proposed a TSBTS network (task-structured brain tumor segmentation network) to mimic the physicians’ expertise by exploring both the task-modality structure and the task-task structure. The task-modality structure identifies the dissimilar tumor regions by weighing the dissimilar modality volume data since they reflect diverse pathological features, whereas the task-task structure represents the most distinct area with one part of the tumor and uses it to find another part in its vicinity.
A learning method for representing useful features from the knowledge transition across different modality data employed in 22 . To facilitate the knowledge transition, they used a generative adversarial network (GAN) learning scheme to mine intrinsic patterns from each modality data. Zhou et al. 23 introduced a One-pass Multi-Task Network (OM-Net) to overcome the problem of imbalanced data in medical brain volume. OM-Net uses shared and task-specific parameters to learn discriminative and joint features. OM-Net is optimized using both learning-based training and online training data transfer approaches. Furthermore, a cross-task guided attention (CGA) module is used to share prediction results between tasks. The extraction of both local and global contextual features simultaneously was proposed inside the Deep CNN structure by Havaei et al. 24 . Their model uses a simple but efficient feature extraction method. An AssemblyNet model was proposed by Coupé et al . 25 which uses the parliamentary decision-making concept for 3D whole-brain MRI segmentation. This parliamentary network is able to solve unseen problems, take complex decisions, and reach a relevant consensus. AssemblyNet employs a majority voting by sharing the knowledge among neighboring U-Nets. This network is able to overcome the problem of limited training data.
Owing to the small size of tumors compared to the rest of the brain, brain imaging data are imbalanced. Due to this characterization, existing networks get to be biased towards the one class that is overrepresented, and training a deep model often leads to low true positive rates. Additionally, existing deep learning approaches have complex structures—which makes them more time-consuming.
To overcome the mentioned difficulties, in our work, a powerful pre-processing strategy to remove a huge amount of unimportant information has been used, which causes promising results even in the present deep learning models. Owing to this strategy, we do not use a complex deep learning model to define the location of the tumor and extract features that lead to a time-consuming process with a high fault rate. Furthermore, thanks to the reduction in the size of the region of interest, the preprocessing step in this strategy also decreases overfitting problems. Besides, after the pre-processing step, a cascade CNN approach is employed to extract both local and global features in an effective way. In order to make our model robust to variation in size and location of the tumor, a new distance-wise attention mechanism is applied inside the CNN model.
This study is structured as follows. In Sect. 2.1 , the pre-processing procedure including Z-Score normalization is described in detail for four MRI modalities. In Sect. 2.2 , deep learning architecture is described. In Sect. 2.3.1 , the distance-wise attention module is demonstrated. In Sect. 2.3.2 , the architecture of the proposed Cascade Convolutional Neural Networks (C-ConvNet/C-CNN) is explained. The experiments, discussion, and concluding remarks are in Sects. 3 and 4 .
Material and methods
In this section, we will discuss the proposed method in detail.
Pre-processing
Unlike many other recent deep learning approaches which use the whole of the image, we only focus on a limited area of it to extract key features. By removing these unnecessary uninformative parts, the true negative results are dramatically decreased. Also, by applying such a strategy, we do not need to use a very deep convolutional model.
Similar distributions
To improve the final segmentation accuracy, we use four brain modalities, namely T1, FLAIR, T1C, and T2 26 , 27 . To enforce the MRI data more uniform and remove the effect of the anisotropic (especially for the FLAIR modality), we conduct the Z-Score normalization for the used modalities. By applying this approach to a medical brain image, the output image has zero mean and unit variance 24 . We implemented this step by subtracting the mean and dividing by the standard deviation in only the brain region (not the background). This step was implemented independently for each brain volume of every patient. Figure 1 shows some samples of the four input modalities and their corresponding normalization results.

Two sets of four MRI modalities and their corresponding Z-Score normalization.
Tumor representation in each slice
In our investigation, we found that the size and the shape of the tumor in sequential slices increase or decrease steadily. The tumor emerges in the first slices with a small size at any possible location of the image. Then, in the following slices, the tumor will remain in the same location inside the image, but it will have a bigger size. Next, after reaching maximum size, the tumor size will start to decrease until it vanishes entirely. This is the core concept of our pre-processing method. These findings are indicated in Figs. 2 and 3 .

Illustration of the ground truth in 24 different slices in Brats18_2013_23_1. The red numbers indicate the number of the slice.

Demonstration of the ground truth in 24 different slices in Brats18_TCIA02_377_1. The red numbers indicate the number of the slice. Different parts of tumor are illustrated with different colors.
The main reason for using the mentioned four brain modalities is their unique characteristics for detecting some parts of the tumor. Moreover, to find a tumor, we need to find all three parts in each of the four modalities, then combine them to make a solid object. So, our first goal is to find one part of the tumor in each modality.
Finding the expected area of the tumor
By looking deeper into Figs. 2 and 3 , we notice emerging, vanishing, and big tumor sizes are encountered in different slices related to different patients. For instance, the biggest tumors are depicted in slices 80 and 74 for Figs. 2 and 3 , respectively. Another important fact is that to the best of our knowledge no sharp difference can be observed in the size of continuous slices and tumor size can be varied slightly. During the investigation phase, we noticed that finding the location of the emerging and vanishing tumor is a hard and challenging task. But this is not true when we are looking for the biggest tumor inside the image. To detect the tumor area in each slice we follow four main steps: (1) read all modalities except the T1 image and compute the Z-Score normalized image, (2) binarize the obtained image with the thresholds 0.7, 0.7, and 0.9 for FLAIR, T2, and T1ce, respectively, (3) apply a morphological operator to remove some irrelevant areas, (4) multiply both binary images of FLAIR and T2 to create a new image and 5) combine the obtained areas from each image together. This procedure is demonstrated in Figs. 4 and 5 in details.

Demonstration of the process of finding a part of the tumor in each slice. The yellow color in the top left corner and the bottom indicates the slice number and sample ID, respectively. Also, the conditions for selecting the object are shown in yellow color. The red color is chosen for identifying the presented image. All binary objects inside the binarized T1ce image are bigger than the threshold criteria, so they were eliminated.

Demonstration of the process of finding a part of the tumor in each slice. The yellow color in the top left corner and the bottom indicates the slice number and sample ID, respectively. Also, the conditions for selecting the object are shown in yellow color. The red color is chosen to identify the presented image. The detected object from T1ce is indicated by the blue text.
As the observed tumor in FLAIR and T2 images is demonstrated with a higher intensity than other parts of the brain, the threshold value of binarization needs to be larger than the mean value (we selected 0.7). Moreover, the tumor is much brighter in T1ce than FLAIR and T2 images. Therefore, a bigger threshold value of binarization needs to be selected (we selected 0.9). If a small threshold value is selected for binarization, several normal tissues will be identified as tumor objects.
In the next step, as there are some tumor-like objects inside the obtained image, we need to discard them using some simple but precise rules. As shown in Figs. 4 and 5 , to decide whether to select a binary object as a part of the tumor or not, extra constraints are applied to the binarized T1ce images: (1) object solidity bigger than 0.7, (2) object area bigger than 500 pixels, and (3) length of the major axis of the object needs to be bigger than 35 pixels. Any object in the binarized T1ce image that does not pass these criteria is removed from the image (Fig. 4 ). The defined constraints (rules) are the same for all the binarized images and we do not need to be altered to obtain good result. Moreover, to overcome the problem of using MRI images with different sizes and thicknesses, the value for each constraint was selected based on a wide span. For instance, in the BRATS 2018 dataset, we defined the smallest object area value as 500 pixels. While using a wide span for selecting an object decreases accuracy, applying the other rules (solidity and major axis length) enables us to overcome that problem effectively.
After detecting all binary objects using morphological operators, we need to add them to each other to create a binary tumor image. But there is still another condition before adding the binarized T1ce to the obtained image from the binary dot product of the FLAIR and T2 images. We can only consider the effect of a binary object inside the T1ce images if it has an overlapping area bigger than 20 pixels with a binary object inside the image obtained from the binary dot product of FLAIR and T2 (Fig. 5 ).
In the next step, we need to find the location of the big tumor inside the slices. To this end, we need to be sure that all detected objects are truly tumor objects. To overcome this issue, we track each tumor object in sequential slices. It means if a tumor object is found in almost the same position with a small change in the size in the sequential slices, we can be sure that this object is a true tumor object. After finding the true tumor object in a slice, we search in the same area inside all other slices to find the biggest object. This procedure is explained in Fig. 6 in details. Finally, using morphological operators this object can be enlarged to cover all possible missing tumor areas (we call this area the biggest expected area). By finding this object and its location, we can search only in this area to find the tumor and segment it in all slices (Fig. 7 ). Finally, based on the information explained in Sect. 2.1.2 and also Figs. 2 and 3 , it is obvious that by moving to the first or last slice, the size of the tumor will be decreased. So, we can create a binary mask for all slices in which the size of the expected areas differs slightly from the expected slice to slice difference.

Pseudocode of the proposed algorithm for detecting the biggest tumor among all slices.

Two examples of finding the tumor object (expected area) and its corresponding center location and applying morphological filters to enlarge the tumor regions. The first row indicates the ground-truth images. The second row demonstrates the tumor object. The third row shows the enlarged tumor objects obtained in the second row. The yellow color in the top left corner indicates the slice number.
Deep learning architecture
In today’s artificial intelligence (AI) applications, the convolutional neural network (ConvNet/CNN) pipelines that are a class of deep feed-forward artificial neural networks exhibit a tremendous breakthrough in medical image analysis and processing 28 , 29 , 30 , 31 , 32 . The structure of a CNN model was inspired by the biological organization of the visual cortex in the human brain which uses the local receptive field. This architecture is similar to that of the connectivity pattern of neurons.
As the CNN model is not invariant to rotation and scale, it is a tremendous task to segment an object that can be moved in the image. One of the key concerns about using a CNN model in the field of medical imaging lies in the time of the evaluation, as many medical applications need prompt responses to minimize the process for additional analysis and treatment. The condition is more complicated when we are dealing with a volumetric medical image. So, by applying a 3D CNN model for detecting lesions using the traditional sliding window approaches, an acceptable result cannot be achieved. This is highly impractical when there are high-resolution volumetric images, and a large number of 3D block samples need to be investigated. In all brain volumetric images, the location, size, orientation, and shape of the tumor are different from a patient to another and cause uncertainty in finding the potential region of the tumor. Also, it is more reasonable to only search a small part of the image rather than the whole image.
To this end, in this work, we first identify the region of interest with a high probability of encountering the tumor and then apply the CNN model to this smaller region–thus reducing computational cost and increasing system efficacy.
The major drawback of convolutional neural network models (CNN) lies in the fuzzy segmentation outcomes and the spatial information reduction caused by the strides of convolutions and pooling operations 32 . To further improve the segmentation accuracy and efficiency, several advanced strategies have been applied to obtain better segmentation results 21 , 25 , 33 , 34 with approaches like dilated convolution/pooling 35 , 36 , – 37 , skip connections 38 , 39 , as well as additional analysis and new post-processing modules like Conditional Random Field (CRF) and Hidden Conditional Random Field (HCRF) 10 , 40 , 41 . Using the dilated convolution method causes a large receptive field to be used without applying the pooling layer to the aim of relieving the issue of information loss during the training phase. The skip connection has the capability of restoring the unchanged spatial resolution progressively with the integration of features and adding outputs from previous layers to the existing layer in the down-sampling step.
Recently, the attention mechanism has been employed in the deep learning context that has shown excellent performance for numerous computer vision tasks including instance segmentation 42 , image-denoising 43 , person re-identification 44 , image classification 45 , 46 , etc.
Proposed structure
In this study, a cascade CNN model has been proposed that combines both local and global information from across different MRI modalities. Also, a distance-wise attention mechanism is proposed to consider the effect of the brain tumor location in four input modalities. This distance-wise attention mechanism successfully applies the key location feature of the image to the fully-connected layer to overcome overfitting problems using many parallel convolutional layers to differentiate between classes like the self-co-attention mechanism 47 . Although many CNN-based networks have been employed for similar multi-modality tumor segmentation in prior studies, none of them uses a combination of an attention-based mechanism and an area-expected approach.
Distance-wise attention (DWA) module
By considering the effect of dissimilarity between the center of the tumor and the expected area, we can guess the probability of encountering each pixel in the investigating process. In other words, knowing the location of the center of the expected (see Fig. 8 ) leads to a better differentiation between pixels of the three tumor classes.

An example depicting the whole brain and its corresponding binary mask for two modalities. The expected area is shown in the third column. The center of the binary mask and the expected area is shown by a red star.
The DWA module explores distance-wise dependencies in each slice of the four employed modalities for the selection of useful features. Given an input feature channel set \({\mathbb{A}}\in {\mathbb{R}}^{H\times W\times N}\) , \({\mathbb{A}} = \left\{ {{\mathbb{A}}_{1} ,{\mathbb{A}}_{2} , \ldots , {\mathbb{A}}_{N} } \right\}\) , where \({\mathbb{A}}_{i} \in {\mathbb{R}}^{H \times W}\) indicates a channel. The variables N, H, and W, are the input channels, spatial height, and spatial width, respectively. So, as it is shown in Fig. 9 , the \(O^{th}\) centroid of the object is obtained on each channel map by

Illustration of parameter calculation in the Distance-Wise Attention (DAW) module. The blue and red pixels are the background and the brain, respectively. The expected area is represented by a yellow object. The size of the image is 240 \(\times\) 240.
where \(y_{c}\) and \(x_{c}\) represent the center of the white object, \(W_{object}\) and \(H_{object}\) indicate the width and height of the object, respectively.
By calculating Eq. ( 1 ) for both the expected area (see Fig. 8 c) and binarization of the input modality in each slide (see Fig. 8 b), the distance-wise can be defined as
where i and j represent the binarized input modality and expected region, respectively. To obtain the width \(W_{object}\) of the object in Eq. ( 2 ), we need to count the number of pixels in each row that have the value 1, and then select the row with the maximum count. For calculating the height \({H}_{object}\) , we do the same strategy but in vertical. Figure 9 provides more details about computing parameters in the DAW module. As shown in Fig. 10 , this process is done for all input modalities and the mean of them is fed to the output of the module for each slice.

Distance calculation based on the center of the expected area and the four input modalities mask.
Cascade CNN model
The flowchart of our cascade mode is depicted in Fig. 11 . To capture as many rich tumor features as possible, we use four modalities, namely, fluid attenuated inversion recovery (Flair), T1-contrasted (T1C), T1-weighted (T1), T2-weighted (T2). Moreover, we add four corresponding Z-Score normalized images of the four input modalities to improve the dice score of segmentation results without adding more complicated layers to our structure.

Our implemented cascade structure. The green and red windows inside the input images represent the local and global patches, respectively. The DWA module is represented at the end of the structure before the FC layer.
Due to the use of a powerful preprocessing step that eliminates about 80% of the insignificant information of each input image, there is no need for a complex deep network such as 10 , 22 , 32 . In other words, by selecting approximately 20% of the whole image (this percentage is the mean of the whole slices of a patient) for each input modality and corresponding Z-Score normalized image, there fewer pixels to investigate.
Also, considering the effect of the center of the tumor to correct detection leads to improve the segmentation result without using a deep CNN model. So, in this study, a cascade CNN model with eight input images is proposed which employs the DWA module at the end of the network to avoid overfitting.
As demonstrated in Fig. 11 , our CNN model includes two different routes which extract local and global features from the four input modalities and the corresponding Z-Score normalized images. The key goal of using the first route is detecting the pixels on the border of each tumor (the global feature), whereas the key goal of the second route is labelling each pixel inside the tumor (the local feature). In the first route, a 40 × 40 patch (red window) is selected from each input image to feed the network. It is worth noting that we extract only patches that have their centers located in the obtained expected area, as shown in Fig. 12 . The presence of Z-Score normalized images improves the accuracy of the tumor border recognition. The number of convolutional layers for extracting the global feature is five. Unlike the first route, in the local feature extraction route, there are only two convolution layers and they are both fed with eight 15 × 15 input patches (green window). The core building block of the proposed CNN structure is expressed as the convolutional layer. This layer can calculate the dot-product between input data with arbitrary size and a set of learnable filters (masks), much like a traditional neural network 32 , 48 , 49 .

Our implemented cascade structure. The blue and yellow windows inside the input images represent the local and global patches, respectively. The red contour indicates the obtained expected area.
The size of the applied masks is always smaller than the dimensions of the input data in all kinds of CNNs. Regularly, the first convolution layers which are applied at the beginning of the CNN model play a significant role in extracting low-level features such as luminance and texture discontinuity 50 , 51 . The high-level features including tumor region masks are investigated in the deeper convolutional layers of the pipeline, while the middle convolutional layers are utilized for investigating the mid-level features including edges, curves, and points.
As demonstrated in the first row of Fig. 12 , the center of each patch is located inside the red border, regardless of whether there is part of the window outside the red border or not. By doing this, we do not investigate insignificant areas (which do not include the tumor). This is more helpful and reasonable when we are encountering imbalanced data. So, samples of the lesion are being equalized to the normal tissue which avoids overfitting in the training step. Additionally, this approach is helpful when dealing with images of various sizes and thicknesses as insignificant parts of the images are discarded before affecting the recognition of the tumor algorithm.
After each convolution layer, there is an activation layer that helps the network to learn complex patterns without changing the dimension of the input feature maps 52 . In other words, in the case of an increased number of layers and to overcome the vanishing gradient problem in the training step, an activation function is applied to each feature map to enhance the computational effectiveness by inducing sparsity 51 , 53 .
In this study, all negative values are changed to zero using the Non-Linearity (ReLU) activation function which acts as a linear function for positive and zero values. It means some nodes obtain null weights and become useless and do not learn anything. So, fewer neurons would be activated because of the limitations applied by this layer.
In contrast to the convolution operation, the pooling layer which is regularly incorporated between two sequential convolutional layers has no parameters and summarizes the key information without losing any details in the sliding window (mask). Additionally, as the dimension of the feature maps (in both column and row) is decreased in this layer, the training time will be smaller and mitigates overfitting 32 , 49 . By using the max-pooling method in this paper, the feature map is divided into a set of regions with no overlapping, then takes the maximum number inside each area.
As in a CNN pipeline, the dimension of the receptive field does not cover the entire spatial dimension of the image in the last convolutional layer, the produced maps by the last convolutional layer related to only an area of the whole input image. Due to this characterization of the receptive field, to learn the non-linear combinations of the high-level features, one or more FC layers have to be used. It should be noticed that before employing the achieved feature maps in the fully connected layer, these two-dimensional feature maps need to be changed into a one-dimensional matrix 54 . Furthermore, to reduce the effect of the overfitting a dropout layer 55 with a 7% dropout probability has been employed (before the FC layer).
Unlike the convolutional layers, the fully connected layers are composed of independent more parameters, so they are harder to train 56 . The last layer in the proposed pipeline for the classification task is the Softmax regression (Multi-class Logistic Regression) layer that is used to distinguish one class from the others. This Multi-class Logistic regression can follow a probability distribution between the range [0,1] by normalizing an input value into a vector of values. This procedure demonstrates how likely the input data (image) belongs to a predefined class. It should be mentioned that the sum of the output probability distribution is equal to one 24 , 48 .
In the proposed network, we employed the stochastic gradient descent approach as the cross-entropy loss function to overcome the class imbalance problem 57 . This loss function calculates the discrepancy between the ground truth and the network’s predicted output. Also, in the output layer, four logistic units were utilized to investigate the probabilities of the given sample belonging to either of the four classes. The loss function can be formulated as follows:
where \(loss_{i}\) implies the loss for the i-th training sample. Also, \(U_{p}\) demonstrates the unnormalized score for the ground-truth class P. This score can be generated by considering the effect of the outputs of the former FC layer (multiplying) with the parameters of the corresponding logistic unit. To get a normalized score to determine the between-class variation in the range of 0 and 3, the denominator adds the predicted scores for all the logistic units Q. As only four output neurons have been used in this study, the value for Q is equal to four. In other words, each pixel can be categorized into one of four classes.
Experiments
Data and implementation details.
In this study, training, validation, and testing of our pipeline have been accomplished on the BRATS 2018 dataset which includes the Multi-Modal MRI images and patient’s clinical data with various heterogeneous histological sub-regions, different degrees of aggressiveness, and variable prognosis. These Multi-Modal MR images have the dimensions of \(240\times 240\times 150\) and were clinically obtained using various magnetic field strengths, scanners, and different protocols from many institutions that are dissimilar to the Computed Tomography (CT) images. There are four MRI sequences for training, validation, and testing steps which include the Fluid Attenuated Inversion Recovery (FLAIR), highlights water locations (T2 or T2-weighted), T1 with gadolinium-enhancing contrast, and highlights fat locations (T1 or T1-weighted).
This dataset includes 75 cases with LGG and 210 cases with HGG which we randomly divided into training data (80%), validation data (10%), and test data (10%). Also, labels of images were annotated by neuro-radiologists with tumor labels (necrosis, edema, non-enhancing tumor, and enhancing tumor are represented by 1, 2, 3, and 4, respectively. Also, the zero value indicates a normal tissue). Label 3 is not used.
The experimental outcomes are achieved for the proposed structure using MATLAB on Intel Core I7- 3.4 GHz, 32 GB RAM, 15 MB Cache, over CUDA 9.0, CuDNN 5.1, and GPU 1080Ti NVIDIA computer under a 64-bit operating system. We adopted the Adaptive Moment Estimation (Adam) for the training step, with a batch size 2, weight decay 10 −5 , an initial learning rate 10 −4 . We took in total 13 h to train and 7 s per volume to test.
Evaluation measure
The effectiveness of the approach is assessed by metrics regarding the enhancing core (EC), tumor core (TC, including necrotic core plus non-enhancing core), and whole tumor (WT, including all classes of tumor structures). The Dice similarity coefficient (DSC) is employed as the evaluation metric to compute the overlap between the ground truth and the predictions.
The experimental results were obtained using the three criteria, namely HAUSDORFF99, Dice similarity, and Sensitivity 23 , 58 , 59 , 60 . The Hausdorff score assesses the distance between the surface of the predicted regions and that of the ground-truth regions. Dice score is employed as the evaluation metric for computing the overlap between the ground truths and the predictions. Specificity (actual negative rate) is the measure of non-tumor pixels that have been calculated correctly. Sensitivity (Recall or True positive rate) is the measure of tumor pixels that have been correctly calculated. These three criteria can be formulated as:
where \({\text{R}}_{{\text{p}}}\) , \({\text{R}}_{{\text{a}}}\) , and \({\text{R}}_{{\text{n}}}\) demonstrate the predicted tumor regions, actual labels, and actual non-tumor labels, respectively.
Experimental results
To have a clear understanding and for quantitative and qualitative comparison purposes, we also implemented five other models (Multi-Cascaded 34 , Cascaded random forests 10 , Cross-modality 22 , Task Structure 21 , and One-Pass Multi-Task 23 ) to evaluate the tumor segmentation performance. Quantitative results of different kinds of our proposed structure are presented in Table 1 .
From Table 1 , we can observe that the two-route CNN model without using a preprocessing approach is not able to segment the tumor area properly. Adding an attention mechanism to a two-route model without using the preprocessing method causes to gain better segmentation results in terms of all three criteria. Also, by adding the preprocessing approach, the Dice scores in three tumor regions observe a surge increase from 0.2531, 0.2796, and 0.2143 to 0.8756, 0.8550, and 0.8715 for End, Whole, and Core, respectively. Despite only having a one-route CNN model (local or Global features) and thanks to the use of the preprocessing approach, the CNN model consistently obtains improved segmentation performance in all tumor regions. Moreover, it is observed that the use of the preprocessing method is more influential than only using an attention mechanism. In other words, the proposed attention mechanism can be more helpful when we are dealing with a smaller part of the input image extracted by the preprocessing method. By comparing the effect of local and global features, it can be recognized that the local features are more effective than global features.
The Dice, Sensitivity, and HAUSDORFF99 values of all input images using all the structures are described in Table 2 . For each index in Table 2 , the highest Dice, Sensitivity, and the smallest HAUSDORFF99 values are highlighted in bold. From Table 2 , it is obvious that our strategy can achieve the highest Sensitivity values in Enh and Whole tumor areas and the highest value for the Core area was obtained by 10 . Also, there is a minimum difference between the values of HAUSDORFF99 using 34 and 23 . In 22 , there is a significant improvement in the Enh area for all three measures. Also 21 , achieves the worst results in the Whole and Core areas for HAUSDORFF99 measure.
Notice that when using the proposed method, all criteria were improved in comparison to other mentioned approaches, but the sensitivity value in the Core area using 34 is still higher. To our best knowledge, there are three reasons. First, the proposed strategy pays special attention to removing insignificant regions inside the four modalities before applying them to the CNN model. Second, our method uses both the local and global features with different numbers of convolutional layers which explores the richer context tumor segmentation. Third, by considering the effect of the dissimilarity between the center of the tumor and the expected area, the network can be biased to a proper output class. Additionally, compared to the state-of-the-art algorithms with heavy networks, such as 22 and 23 , our approach obtains more promising performance and decreases the running time by only using a simple CNN structure. Moreover, as shown in Table 3 , the proposed method is faster at segmenting the tumor than other compared models.
Figure 13 provides a visual demonstration of the good results achieved by our approach on the BRATS 2018 dataset. As shown, all regions have a mutual border with all of the other regions. Due to the difference between the value of tumor core and enhancing areas inside the T1C images (third column), the border between them can be easily distinguished with a high rate of accuracy without using other modalities. But it is not true when we are dealing with the border of a tumor core, edema areas, or enhanced edema areas. Due to these mentioned characteristics of each modality, we observe that there is no need for a very deep CNN model if we decrease the searching area.

The results of brain tumor segmentation using the proposed strategy (the blue, green, and red colors are enhanced, core, and edema regions respectively).
Owing to the use of the DWA module, our model can mine more unique contextual information from the tumor and the brain which leads to a better segmentation result. Figure 14 shows the improved segmentation resulting from the application of the DWA module in the proposed method—particularly in the border of touching tumor areas.

Comparing the results of brain tumor segmentation by applying DWA method to the proposed CNN structure. The blue, yellow, and red colors are edema, enhanced, and core regions respectively.
The comparison between the baseline and our model in Fig. 15 shows the effectiveness of the proposed method in the capability of distinction between all four regions.

Comparing the results of brain tumor segmentation using the proposed strategy with four state-of-art methods (the blue, yellow, and red colors are edema, enhanced, and core regions respectively). ( A ) Multi-Cascaded 34 , ( B ) Cascaded random forests 10 , ( C ) Cross-modality 22 , ( D ) One-Pass Multi-Task 23 , and ( E ) Our method.
Figure 15 (GT) indicates the ground truth corresponding to all four modalities in the same row. The Multi-Cascaded (Fig. 15 A) and Cascaded random forests (Fig. 15 B) approaches show satisfactory results in detecting the Edema area but cannot detect the small regions of Edema outside the main Edema body. The Cross-modality (Fig. 15 C) and One-Pass Multi-Task (Fig. 15 D) approaches gain promising results in detecting the tumor Core and Enhancing areas, especially in detecting tumor Core in outside border of the Enhancing area.
It is illustrated that some separated Edema regions are stuck together in final segmentation using the Cross-modality method. As shown in Fig. 15 (C), applying the Cross-modality structure reaches the minimum segmentation accuracy for detecting the Edema regions compared to others. This model under-segments the tumor Core areas and over-segments the Edema areas. The One-Pass Multi-Task approach shows a better core matching with the ground-truth compared to Fig. 15 (A–C) but still has insufficient accuracy, especially in the Edema areas. Based on our evaluation, estimation of the three distinct regions of the brain tumor using an attention-based mechanism is an effective way to help specialists and doctors to evaluate the tumor stages which is of high interest in computer-aided diagnosis systems.
Discussion and conclusions
In this paper, we have developed a new brain tumor segmentation architecture that benefits from the characterization of the four MRI modalities. It means that each modality has unique characteristics to help the network efficiently distinguish between classes. We have demonstrated that working only on a part of the brain image near the tumor tissue allows a CNN model (that is the most popular deep learning architecture) to reach performance close to human observers. Moreover, a simple but efficient cascade CNN model has been proposed to extract both local and global features in two different ways with different sizes of extraction patches. In our method, after extracting the tumor’s expected area using a powerful preprocessing approach, those patches are selected to feed the network that their center is located inside this area. This leads to reducing the computational time and capability to make predictions fast for classifying the clinical image as it removes a large number of insignificant pixels off the image in the preprocessing step. Comprehensive experiments have indicated the effectiveness of the Distance-Wise Attention mechanism in our algorithm as well as the remarkable capacity of our entire model when compared with the state-of-the-art approaches.
Although the proposed approach’s outstanding results compared to the other recently published models, our algorithm has still limitations when encountering tumor volume of more than one-third of the whole of the brain. This is because of an increase in the size of the tumor’s expected area which leads to a decrease in the feature extraction performance.
Van Meir, E. G. et al. Exciting new advances in neuro-oncology: the avenue to a cure for malignant glioma. CA. Cancer J. Clin. 60 (3), 166–193. https://doi.org/10.3322/caac.20069 (2010).
Article PubMed PubMed Central Google Scholar
Bakas, S. et al. Advancing The Cancer Genome Atlas glioma MRI collections with expert segmentation labels and radiomic features. Sci. Data 4 (1), 1–13. https://doi.org/10.1038/sdata.2017.117 (2017).
Article MathSciNet Google Scholar
Khosravanian, A., Rahmanimanesh, M., Keshavarzi, P. & Mozaffari, S. Fast level set method for glioma brain tumor segmentation based on superpixel fuzzy clustering and lattice boltzmann method. Comput. Methods Programs Biomed. 198 , 105809. https://doi.org/10.1016/j.cmpb.2020.105809 (2020).
Article PubMed Google Scholar
Tang, Z., Ahmad, S., Yap, P. T. & Shen, D. Multi-atlas segmentation of MR tumor brain images using low-rank based image recovery. IEEE Trans. Med. Imaging 37 (10), 2224–2235. https://doi.org/10.1109/TMI.2018.2824243 (2018).
Bakas, S. Segmentation labels and radiomic features for the pre-operative scans of the TCGA-LGG collection. Cancer Imag. Arch. https://doi.org/10.7937/K9/TCIA.2017.GJQ7R0EF (2017).
Article Google Scholar
Ramli, N. M., Hussain, M. A., Jan, B. M. & Abdullah, B. Online composition prediction of a debutanizer column using artificial neural network. Iran. J. Chem. Chem. Eng. 36 (2), 153–174. https://doi.org/10.30492/IJCCE.2017.26704 (2017).
Article CAS Google Scholar
Q. V. Le and T. Mikolov, Distributed representations of sentences and documents. 2014, doi: https://doi.org/10.1145/2740908.2742760 .
Kamari, E., Hajizadeh, A. A. & Kamali, M. R. Experimental investigation and estimation of light hydrocarbons gas-liquid equilibrium ratio in gas condensate reservoirs through artificial neural networks. Iran. J. Chem. Chem. Eng. 39 (6), 163–172. https://doi.org/10.30492/ijcce.2019.36496 (2020).
Ganjkhanlou, Y. et al. Application of image analysis in the characterization of electrospun nanofibers. Iran. J. Chem. Chem. Eng. 33 (2), 37–45. https://doi.org/10.30492/IJCCE.2014.10750 (2014).
Chen, G., Li, Q., Shi, F., Rekik, I. & Pan, Z. RFDCR: Automated brain lesion segmentation using cascaded random forests with dense conditional random fields. Neuroimage 211 , 116620. https://doi.org/10.1016/j.neuroimage.2020.116620 (2020).
A. Jalalifar, H. Soliman, M. Ruschin, A. Sahgal, A. Sadeghi-Naini, A brain tumor segmentation framework based on outlier detection using one-class support vector machine,” in Proceedings of the Annual International Conference of the IEEE Engineering in Medicine and Biology Society, EMBS , Jul. 2020, vol. 2020-July, pp. 1067–1070, doi: https://doi.org/10.1109/EMBC44109.2020.9176263 .
Torabi Dashti, H., Masoudi-Nejad, A. & Zare, F. Finding exact and solo LTR-retrotransposons in biological sequences using SVM. Iran. J. Chem. Chem. Eng. 31 (2), 111–116. https://doi.org/10.30492/IJCCE.2012.5998 (2012).
Partovi, S. M. A. & Sadeghnejad, S. Reservoir rock characterization using wavelet transform and fractal dimension. Iran. J. Chem. Chem. Eng. 37 (3), 223–233. https://doi.org/10.30492/IJCCE.2018.27647 (2018).
Antonelli, M. et al. GAS: A genetic atlas selection strategy in multi-atlas segmentation framework. Med. Image Anal. 52 , 97–108. https://doi.org/10.1016/j.media.2018.11.007 (2019).
Li, G., Yang, Y. & Qu, X. Deep learning approaches on pedestrian detection in hazy weather. IEEE Trans. Ind. Electron. 67 (10), 8889–8899. https://doi.org/10.1109/TIE.2019.2945295 (2020).
Brunetti, A., Buongiorno, D., Trotta, G. F. & Bevilacqua, V. Computer vision and deep learning techniques for pedestrian detection and tracking: A survey. Neurocomputing 300 , 17–33. https://doi.org/10.1016/j.neucom.2018.01.092 (2018).
Tu, Y. H. et al. An iterative mask estimation approach to deep learning based multi-channel speech recognition. Speech Commun. 106 , 31–43. https://doi.org/10.1016/j.specom.2018.11.005 (2019).
V. Mitra et al. , “Robust Features in Deep-Learning-Based Speech Recognition,” in New Era for Robust Speech Recognition , Springer International Publishing, 2017, pp. 187–217.
Iqbal, S. et al. Deep learning model integrating features and novel classifiers fusion for brain tumor segmentation. Microsc. Res. Tech. 82 (8), 1302–1315. https://doi.org/10.1002/jemt.23281 (2019).
Zhao, X. et al. A deep learning model integrating FCNNs and CRFs for brain tumor segmentation. Med. Image Anal. 43 , 98–111. https://doi.org/10.1016/j.media.2017.10.002 (2018).
Zhang, D. et al. Exploring task structure for brain tumor segmentation from multi-modality MR images. IEEE Trans. IMAGE Process. https://doi.org/10.1109/TIP.2020.3023609 (2020).
Zhang, D. et al. Cross-modality deep feature learning for brain tumor segmentation. Pattern Recognit. https://doi.org/10.1016/j.patcog.2020.107562 (2020).
Zhou, C., Ding, C., Wang, X., Lu, Z. & Tao, D. One-pass multi-task networks with cross-task guided attention for brain tumor segmentation. IEEE Trans. Image Process. 29 , 4516–4529. https://doi.org/10.1109/TIP.2020.2973510 (2020).
Article ADS Google Scholar
Havaei, M. et al. Brain tumor segmentation with deep neural networks. Med. Image Anal. 35 , 18–31. https://doi.org/10.1016/j.media.2016.05.004 (2017).
Coupé, P. et al. AssemblyNet: a large ensemble of CNNs for 3D whole brain MRI segmentation. Neuroimage 219 , 117026. https://doi.org/10.1016/j.neuroimage.2020.117026 (2020).
Bakas, S. Segmentation labels and radiomic features for the pre-operative scans of the TCGA-GBM collection. Cancer Imag. Arch. https://doi.org/10.7937/K9/TCIA.2017.KLXWJJ1Q (2017).
Menze, B. H. et al. The multimodal brain tumor image segmentation benchmark (BRATS). IEEE Trans. Med. Imag. 34 (10), 1993–2024. https://doi.org/10.1109/TMI.2014.2377694 (2015).
Islam, M. Z., Islam, M. M. & Asraf, A. A combined deep CNN-LSTM network for the detection of novel coronavirus (COVID-19) using X-ray images. Informatics Med. Unlocked 20 , 100412. https://doi.org/10.1016/j.imu.2020.100412 (2020).
WaleedSalehi, A., Baglat, P. & Gupta, G. Review on machine and deep learning models for the detection and prediction of coronavirus. Mater. Today Proc. https://doi.org/10.1016/j.matpr.2020.06.245 (2020).
Kavitha, B. & Sarala Thambavani, D. Artificial neural network optimization of adsorption parameters for Cr(VI), Ni(II) and Cu(II) ions removal from aqueous solutions by riverbed sand. Iran. J. Chem. Chem. Eng. 39 (5), 203–223. https://doi.org/10.30492/ijcce.2020.39785 (2020).
Azari, A., Shariaty-Niassar, M. & Alborzi, M. Short-term and Medium-term Gas demand load forecasting by neural networks. Iran. J. Chem. Chem. Eng. 31 (4), 77–84. https://doi.org/10.30492/IJCCE.2012.5923 (2012).
Ranjbarzadeh, R. et al. Lung infection segmentation for COVID-19 Pneumonia based on a cascade convolutional network from CT images. Biomed Res. Int. https://doi.org/10.1155/2021/5544742 (2021).
Badrinarayanan, V., Kendall, A. & Cipolla, R. SegNet: a deep convolutional encoder-decoder architecture for image segmentation. IEEE Trans. Pattern Anal. Mach. Intell. 39 (12), 2481–2495. https://doi.org/10.1109/TPAMI.2016.2644615 (2017).
Hu, K. et al. Brain tumor segmentation using multi-cascaded convolutional neural networks and conditional random field. IEEE Access 7 , 92615–92629. https://doi.org/10.1109/ACCESS.2019.2927433 (2019).
Geng, L. et al. Encoder-decoder with dense dilated spatial pyramid pooling for prostate MR images segmentation. Comput. Assist. Surg. 24 (sup2), 13–19. https://doi.org/10.1080/24699322.2019.1649069 (2019).
Geng, L., Zhang, S., Tong, J. & Xiao, Z. Lung segmentation method with dilated convolution based on VGG-16 network. Comput. Assist. Surg. 24 (sup2), 27–33. https://doi.org/10.1080/24699322.2019.1649071 (2019).
Wang, B. et al. Deeply supervised 3D fully convolutional networks with group dilated convolution for automatic <scp>MRI</scp> prostate segmentation. Med. Phys. 46 (4), 1707–1718. https://doi.org/10.1002/mp.13416 (2019).
Ali, M. J. et al. Enhancing breast pectoral muscle segmentation performance by using skip connections in fully convolutional network. Int. J. Imaging Syst. Technol. https://doi.org/10.1002/ima.22410 (2020).
Zhou, Z., Siddiquee, M. M. R., Tajbakhsh, N. & Liang, J. UNet++: redesigning skip connections to exploit multiscale features in image segmentation. IEEE Trans. Med. Imaging 39 (6), 1856–1867. https://doi.org/10.1109/TMI.2019.2959609 (2020).
Siddiqi, M. H., Ali, R., Khan, A. M., Park, Y. T. & Lee, S. Human facial expression recognition using stepwise linear discriminant analysis and hidden conditional random fields. IEEE Trans. Image Process. 24 (4), 1386–1398. https://doi.org/10.1109/TIP.2015.2405346 (2015).
Article ADS MathSciNet PubMed MATH Google Scholar
D. Marcheggiani, O. Täckström, A. Esuli, and F. Sebastiani, “Hierarchical multi-label conditional random fields for aspect-oriented opinion mining,” Lect. Notes Comput. Sci. (including Subser. Lect. Notes Artif. Intell. Lect. Notes Bioinformatics) , vol. 8416 LNCS, pp. 273–285, 2014, doi: https://doi.org/10.1007/978-3-319-06028-6_23 .
T. Zhou, S. Ruan, Y. Guo, and S. Canu, “A Multi-Modality Fusion Network Based on Attention Mechanism for Brain Tumor Segmentation,” in Proceedings - International Symposium on Biomedical Imaging , Apr. 2020, vol. 2020-April, pp. 377–380, doi: https://doi.org/10.1109/ISBI45749.2020.9098392 .
Tian, C. et al. Attention-guided CNN for image denoising. Neural Netw. 124 , 117–129. https://doi.org/10.1016/j.neunet.2019.12.024 (2020).
Chen, X., Zheng, L., Zhao, C., Wang, Q. & Li, M. RRGCCAN: re-ranking via graph convolution channel attention network for person re-identification. IEEE Access 8 , 131352–131360. https://doi.org/10.1109/ACCESS.2020.3009653 (2020).
Fang, B., Li, Y., Zhang, H. & Chan, J. Hyperspectral images classification based on dense convolutional networks with spectral-wise attention mechanism. Remote Sens. 11 (2), 159. https://doi.org/10.3390/rs11020159 (2019).
Yao, H., Zhang, X., Zhou, X. & Liu, S. Parallel structure deep neural network using CNN and RNN with an attention mechanism for breast cancer histology image classification. Cancers (Basel) 11 (12), 1901. https://doi.org/10.3390/cancers11121901 (2019).
Lei, B. et al. Self-co-attention neural network for anatomy segmentation in whole breast ultrasound. Med. Image Anal. 64 , 101753. https://doi.org/10.1016/j.media.2020.101753 (2020).
Chen, J., Liu, Z., Wang, H., Nunez, A. & Han, Z. Automatic defect detection of fasteners on the catenary support device using deep convolutional neural network. IEEE Trans. Instrum. Meas. 67 (2), 257–269. https://doi.org/10.1109/TIM.2017.2775345 (2018).
Zhong, J., Liu, Z., Han, Z., Han, Y. & Zhang, W. A CNN-based defect inspection method for catenary split pins in high-speed railway. IEEE Trans. Instrum. Meas. 68 (8), 2849–2860. https://doi.org/10.1109/TIM.2018.2871353 (2019).
A. Mahmood et al. , “Deep Learning for Coral Classification,” in Handbook of Neural Computation , Elsevier Inc., 2017, pp. 383–401.
Bengio, Y. Practical Recommendations for Gradient-Based Training of Deep Architectures 437–478 (Springer, 2012).
Google Scholar
A. D. Torres, H. Yan, A. H. Aboutalebi, A. Das, L. Duan, and P. Rad, “Patient facial emotion recognition and sentiment analysis using secure cloud with hardware acceleration,” in Computational Intelligence for Multimedia Big Data on the Cloud with Engineering Applications , Elsevier, 2018, pp. 61–89.
Dolz, J., Desrosiers, C. & Ben Ayed, I. 3D fully convolutional networks for subcortical segmentation in MRI: A large-scale study. Neuroimage 170 , 456–470. https://doi.org/10.1016/j.neuroimage.2017.04.039 (2018).
Yin, W., Schütze, H., Xiang, B. & Zhou, B. ABCNN: attention-based convolutional neural network for modeling sentence pairs. Trans. Assoc. Comput. Linguist. 4 , 259–272. https://doi.org/10.1162/tacl_a_00097 (2016).
Srivastava, N., Hinton, G., Krizhevsky, A., Ilya, S. & Salakhutdinov, R. Dropout: a simple way to prevent neural networks from overfitting. J. Mach. Learn. Res. 15 (1), 1929–1958 (2014).
MathSciNet MATH Google Scholar
F. Husain, B. Dellen, and C. Torras, “Scene Understanding Using Deep Learning,” in Handbook of Neural Computation , Elsevier Inc., 2017, pp. 373–382.
Wahab, N., Khan, A. & Lee, Y. S. Two-phase deep convolutional neural network for reducing class skewness in histopathological images based breast cancer detection. Comput. Biol. Med. 85 , 86–97. https://doi.org/10.1016/j.compbiomed.2017.04.012 (2017).
Ranjbarzadeh, R. & Saadi, S. B. Automated liver and tumor segmentation based on concave and convex points using fuzzy c-means and mean shift clustering. Meas. J. Int. Meas. Confed. https://doi.org/10.1016/j.measurement.2019.107086 (2020).
Karimi, N., Ranjbarzadeh Kondrood, R. & Alizadeh, T. An intelligent system for quality measurement of Golden Bleached raisins using two comparative machine learning algorithms. Meas. J. Int. Meas. Confed. 107 , 68–76. https://doi.org/10.1016/j.measurement.2017.05.009 (2017).
Pourasad, Y., Ranjbarzadeh, R. & Mardani, A. A new algorithm for digital image encryption based on chaos theory. Entropy 23 (3), 341. https://doi.org/10.3390/e23030341 (2021).
Article ADS MathSciNet PubMed PubMed Central Google Scholar
Download references
Acknowledgements
The author Malika Bendechache is supported, in part, by Science Foundation Ireland (SFI) under the grants No. 13/RC/2094\_P2 (Lero) and 13/RC/2106\_P2 (ADAPT).
Author information
Authors and affiliations.
Department of Telecommunications Engineering, Faculty of Engineering, University of Guilan, Rasht, Iran
Ramin Ranjbarzadeh
Faculty of Management and Accounting, Allameh Tabataba‘i University, Tehran, Iran
Abbas Bagherian Kasgari
Faculty of Industrial Engineering, Urmia University of Technology, Urmia, Iran
Saeid Jafarzadeh Ghoushchi
Department of Accounting, Economic and Financial Sciences, South Tehran Branch Islamic Azad University, Tehran, Iran
Shokofeh Anari
Department of Chemical Engineering, Faculty of Engineering, Golestan University, Aliabad Katoul, Iran
Maryam Naseri
School of Computing, Faculty of Engineering and Computing, Dublin City University, Dublin, Ireland
Malika Bendechache
You can also search for this author in PubMed Google Scholar
Contributions
R.R contributed to Conceptualization, Investigation, Methodology, Software, Writing- Reviewing and Editing (original draft), Validation. A.B.K contributed to Software, Formal analysis, Investigation, Data curation. S.J.G contributed to Formal analysis, Investigation. S.A contributed to Investigation, Data curation. M.N contributed to conceptualization and writing (original draft). M.B contributed to Supervisor, Reviewing and Editing, Validation.
Corresponding author
Correspondence to Maryam Naseri .
Ethics declarations
Competing interests.
The authors declare no competing interests.
Additional information
Publisher's note.
Springer Nature remains neutral with regard to jurisdictional claims in published maps and institutional affiliations.
Rights and permissions
Open Access This article is licensed under a Creative Commons Attribution 4.0 International License, which permits use, sharing, adaptation, distribution and reproduction in any medium or format, as long as you give appropriate credit to the original author(s) and the source, provide a link to the Creative Commons licence, and indicate if changes were made. The images or other third party material in this article are included in the article's Creative Commons licence, unless indicated otherwise in a credit line to the material. If material is not included in the article's Creative Commons licence and your intended use is not permitted by statutory regulation or exceeds the permitted use, you will need to obtain permission directly from the copyright holder. To view a copy of this licence, visit http://creativecommons.org/licenses/by/4.0/ .
Reprints and permissions
About this article
Cite this article.
Ranjbarzadeh, R., Bagherian Kasgari, A., Jafarzadeh Ghoushchi, S. et al. Brain tumor segmentation based on deep learning and an attention mechanism using MRI multi-modalities brain images. Sci Rep 11 , 10930 (2021). https://doi.org/10.1038/s41598-021-90428-8
Download citation
Received : 12 February 2021
Accepted : 07 May 2021
Published : 25 May 2021
DOI : https://doi.org/10.1038/s41598-021-90428-8
Share this article
Anyone you share the following link with will be able to read this content:
Sorry, a shareable link is not currently available for this article.
Provided by the Springer Nature SharedIt content-sharing initiative
This article is cited by
Neuronet19: an explainable deep neural network model for the classification of brain tumors using magnetic resonance imaging data.
- Rezuana Haque
- Md. Mehedi Hassan
- Sheikh Mohammed Shariful Islam
Scientific Reports (2024)
A review of robotic charging for electric vehicles
- Hendri Maja Saputra
- Nur Safwati Mohd Nor
- Edwar Yazid
International Journal of Intelligent Robotics and Applications (2024)
Accurate detection of coronavirus cases using deep learning with attention mechanism and genetic algorithm
Multimedia Tools and Applications (2024)
End-to-End Multi-task Learning Architecture for Brain Tumor Analysis with Uncertainty Estimation in MRI Images
- Maria Nazir
- Sadia Shakil
- Khurram Khurshid
Journal of Imaging Informatics in Medicine (2024)
Gaussian weighting—based random walk segmentation and DCNN method for brain tumor detection and classification
- K. Vijila Rani
- P. Sivalakshmi
By submitting a comment you agree to abide by our Terms and Community Guidelines . If you find something abusive or that does not comply with our terms or guidelines please flag it as inappropriate.
Quick links
- Explore articles by subject
- Guide to authors
- Editorial policies
Sign up for the Nature Briefing: Cancer newsletter — what matters in cancer research, free to your inbox weekly.

IMAGES
VIDEO
COMMENTS
In many BTS applications, the brain tumor image segmentation is achieved by classifying pixels, thus the segmentation problem turns into a classification . The aim of the work presented in this paper is to develop and test a Deep Learning approach for brain tumor classification and segmentation using a Multiscale Convolutional Neural Network.
This paper shows that the spatiotemporal models, ResNet(2+1)D and ResNet Mixed Convolution, working as spatiospatial models, could improve the classification of grades of brain tumours (i.e. low ...
In this research study, we proposed a robust brain tumor classification method using Deep Learning (DL) techniques to address the lack of accuracy issue in existing artificial diagnosis systems.
This paper proposes a novel automated scheme for detection and classification. ... Various researchers have provided different methods to classify brain tumors. However, their research works rely on machine learning algorithms such as support ... Various types of brain tumors (a) Astrocytoma, (b) Glioblastoma, (c) Oligodendroglioma, (d) Tissue ...
Brain tumor, where abnormal brain cells grow in an uncontrollable way, is a life-threatening disease that causes about 0.25 million deaths worldwide in 2020 1. The 5-year survival rate for people ...
In this paper, the mixed feature extraction method is used to extract the features of brain tumors, and RELM is used to classify the types of brain tumors. This method achieves 94.233% classification accuracy on dataset 1. Öksüz et al. (2022) introduced a method that combines deep and shallow features.
Brain tumor classification is crucial for clinical analysis and an effective treatment plan to cure patients. Deep learning models help radiologists to accurately and efficiently analyze tumors without manual intervention. However, brain tumor analysis is challenging because of its complex structure, texture, size, location, and appearance. Therefore, a novel deep residual and regional-based ...
This research presents a comprehensive review of recent brain tumour classification methods. The purpose of this survey is to conduct an evaluation of 70 papers that deal with the classification of brain tumours. This survey includes a systematic analysis based on performance levels and related maximum achievements for each contribution.
This research project is dedicated to conducting an exhaustive exploration of existing endeavors in the domain of brain tumor identification and classification via MRI scans. This endeavor is poised to be of profound value to researchers looking to leverage their deep learning expertise in the realm of brain tumor detection and categorization.
Feature papers represent the most advanced research with significant potential for high impact in the field. A Feature Paper should be a substantial original Article that involves several techniques or approaches, provides an outlook for future research directions and describes possible research applications. ... "Brain Tumor Classification ...
Brain tumors (BT) pose a significant threat to human life, making early detection and classification are critical for effective treatment. Medical imaging plays an important role in brain tumor detection (BTD) by providing invaluable data for diagnosis, surgical planning, research, and training. Maximum accuracy is essential when detecting brain tumors, as even minor diagnostic errors can have ...
Accurately classifying brain tumor types is critical for timely diagnosis and potentially saving lives. Magnetic Resonance Imaging (MRI) is a widely used non-invasive method for obtaining high ...
Brain tumor represents one of the most fatal cancers around the world. It is common cancer in adults and children. It has the lowest survival rate and various types depending on their location, texture, and shape. The wrong classification of the tumor brain will lead to bad consequences. Consequently, identifying the correct type and grade of tumor in the early stages has an important role to ...
Abstract: Brain tumor is a very common and destructive malignant tumor disease that leads to a shorter life if it is not diagnosed early enough. Brain tumor classification is a very critical step after detection of the tumor to be able to attain an effective treatment plan. This research paper aims to increase the level and efficiency of MRI machines in classifying brain tumors and identifying ...
The number of research papers grew rapidly from 2015 to onward. This topic has now became dominant at different conferences and journals. ... Oval multi-stream deep CNN architecture is proposed for brain tumor classification, in which molecular-related subcategories are utilized for tumor grades. Different enhanced and sensitive MRIs T1-MRI, T2 ...
Detection of brain tumors is significantly complicated by the distinctions in tumor position, structure, and proportions. ... this research paper proposed several ways to detect brain cancer and tumors. This study also shows an assessment matrix for a specific system using particular systems and dataset types. This paper also explains the ...
Brain tumors include the most threatening types of tumors around the world. Glioma, the most common primary brain tumors, occurs due to the carcinogenesis of glial cells in the spinal cord and brain.
Using computational intelligence and statistical image processing techniques, this research paper proposed several ways to detect brain cancer and tumors. This study also shows an assessment ...